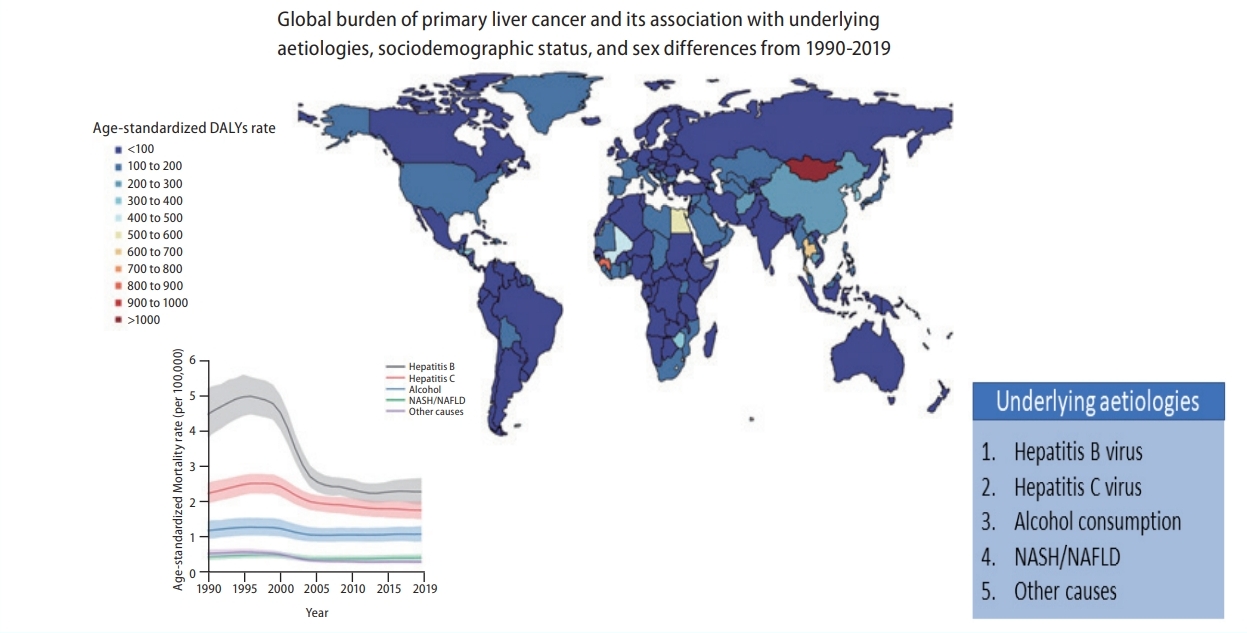
Clin Mol Hepatol > Volume 29(2); 2023 > Article
Choi, Kim, Yon, Lee, Lee, Chang, Park, Koyanagi, Jacob, Dragioti, Radua, Shin, Kim, and Smith: Global burden of primary liver cancer and its association with underlying aetiologies, sociodemographic status, and sex differences from 1990–2019: A DALY-based analysis of the Global Burden of Disease 2019 study

ABSTRACT

Background/Aims

Global distribution of dominant liver cancer aetiologies has significantly changed over the past decades. This study analyzed the updated temporal trends of liver cancer aetiologies and sociodemographic status in 204 countries and territories from 1990 to 2019.

Methods

The Global Burden of Disease 2019 report was used for statistical analysis. In addition, we performed stratification analysis to five quintiles using sociodemographic index and 21 geographic regions.

Results

The crude numbers of liver cancer disease-adjusted life years (DALYs) and deaths significantly increased during the study period (DALYs; 11,278,630 in 1990 and 12,528,422 in 2019, deaths; 365,215 in 1990 and 484,577 in 2019). However, the Age-standardized DALY and mortality rates decreased. Hepatitis B virus (HBV) remains the leading cause of liver cancer DALYs and mortality, followed by hepatitis C virus (HCV), alcohol consumption, and non-alcoholic steatohepatitis/non-alcoholic fatty liver disease (NASH/NAFLD). Although Age-standardized DALY and mortality rates of liver cancer due to HBV and HCV have decreased, the rates due to alcohol consumption and NASH/NAFLD have increased. In 2019, the population of the East Asia region had the highest Age-standardized DALY and mortality rates, followed by high-income Asia-Pacific and Central Asia populations. Although East Asia and high-income Asia-Pacific regions showed a decrease during the study period, Age-standardized DALY rates increased in Central Asia. High-income North American and Australasian populations also showed a significant increase in Age-standardized DALY.

Conclusions

Liver cancer remains an ongoing global threat. The burden of liver cancer associated with alcohol consumption and NASH/NAFLD is markedly increasing and projected to continuously increase.

Graphical Abstract

INTRODUCTION

Primary liver cancer is a significant global health concern, representing the seventh most common type of cancer and the second leading cause of cancer-related deaths [1]. The countries with the highest incidence of liver cancer mainly typically show lower levels of economic development, and most cases of liver cancer occur in geographically diverse countries, including those in North and West Africa (Gambia, Egypt, and Guinea) and East and Southeast Asia (Cambodia, Mongolia, and Vietnam) [2,3]. The major aetiologies of primary liver cancer include chronic hepatitis B virus (HBV) and hepatitis C virus (HCV) infections, alcoholic liver disease, and non-alcoholic fatty liver disease (NAFLD). However, the aetiologies greatly vary from region to region. More specifically, the most important risk factors in China and East Africa are chronic HBV infection and aflatoxin contamination in food, respectively, and in other countries such as Egypt and Japan, chronic HCV infection is often the main cause. In Western countries, chronic HCV infection, alcohol consumption, and obesity/diabetes are the most common causes of liver cancer.
The Global Burden of Disease (GBD) database was constructed to provide a tool for quantifying health losses from hundreds of diseases, injuries, and risk factors. The GBD was initiated and maintained by a consortium of more than 3,600 researchers in nearly 200 countries. The database comprises a comprehensive catalogue of surveys, censuses, vital statistics, and other health-related data such as death and disability [4]. Therefore, the GBD database can provide helpful insights for understanding the nature of liver cancer, how the challenges are changing over time, and how to allocate health resources more effectively.
Because effective antivirals against chronic HBV and HCV infections have recently become available, the global distribution of the dominant aetiologies has changed. In particular, due to universal screening for HCV infection and direct-acting antivirals (DAAs) against chronic HCV infection, HCV is expected to be eliminated by 2030. However, trends in liver cancer based on specific aetiology and sociodemographic status have rarely been reported and compared.
In this study, we aimed to describe and analyse the updated temporal trends in aetiologies and sociodemographic status from 1990 to 2019 to provide insights into appropriate global intervention strategies.

MATERIALS AND METHODS

Overview

The GBD 2019 report consists of 369 diseases and injuries [5]. Over 80 behavioural, environmental, occupational, and metabolic risk factors are also recorded. Estimation of the sampling error was described in detail in a previous study [6,7].

Data sources

Data on the number and Age-standardized rates of incidence and mortality of primary liver cancer were extracted from the GBD 2019 database (http://ghdx.healthdata.org/gbd-2019). Liver cancer data from 204 countries and territories were collected. This was further divided into five quintiles based on sociodemographic index (SDI; low, low-middle, middle, high-middle, high) and 21 geographic regions. Cancer incidence, mortality, and morbidity data used in the GBD 2019 included individual population-based cancer registries, Cancer Incidence in Five Continents (CI5), the Nordic Cancer Registries database and European Network of Cancer Registries. Primary liver cancer in the GBD 2019 report corresponds to C22–C22.8 and Z85.05 in the International Classification of Diseases 10th revision. Liver cancer cases were divided into five categories based on underlying aetiology (hepatitis B, hepatitis C, alcohol, non-alcoholic steatohepatitis [NASH]/NAFLD, and other causes) in the GBD 2019 database. The proportion of liver cancer cases based on aetiology was determined using a systematic literature search and various adjusting models (hepatitis B, hepatitis C, and NASH/NAFLD prevalence; alcohol consumption; hepatitis B vaccination coverage; and proportion of cirrhosis due to liver cancer subtyping). For every study, proportions of liver cancer due to the five aetiologies were calculated using five separate Dis-Mod-Mr 2.1 models (aetiology split model). The estimated proportion was then used to split the total liver cancer estimates into aetiologies.

Sociodemographic index (SDI)

Socioeconomic development status was graded based on the SDI, which incorporates the total fertility rate in women <25 years of age, mean educational level for individuals ≥15 years of age, and lag-distributed income per person. The method for generating the SDI has been described in detail in a previous report [8]. The SDI values range between 0 and 1, which indicates the socioeconomic development level of a country on a scale of worst to best. SDI locations were chosen based on quintile of ranked SDI values. A specific country or region with SDI <20th, 20th–39th, 40th–59th, 60th–79th, and >80th percentage of the ranked SDI values was grouped as low, low-middle, middle, high-middle, and high SDI, respectively. The SDI quintiles were obtained from the GBD 2019 data and are presented in Supplementary Table 1.

Uncertainty analysis

The incidence and mortality rates in each year were assumed to follow a log-normal distribution, and the rates in different years were independent of each other. Based on these assumptions, 95% uncertainty indices (UIs) were calculated in each bootstrap draw based on the 25th and 975th ranked values across all 1,000 draws in the GBD 2019.

RESULTS

Global burden of liver cancer

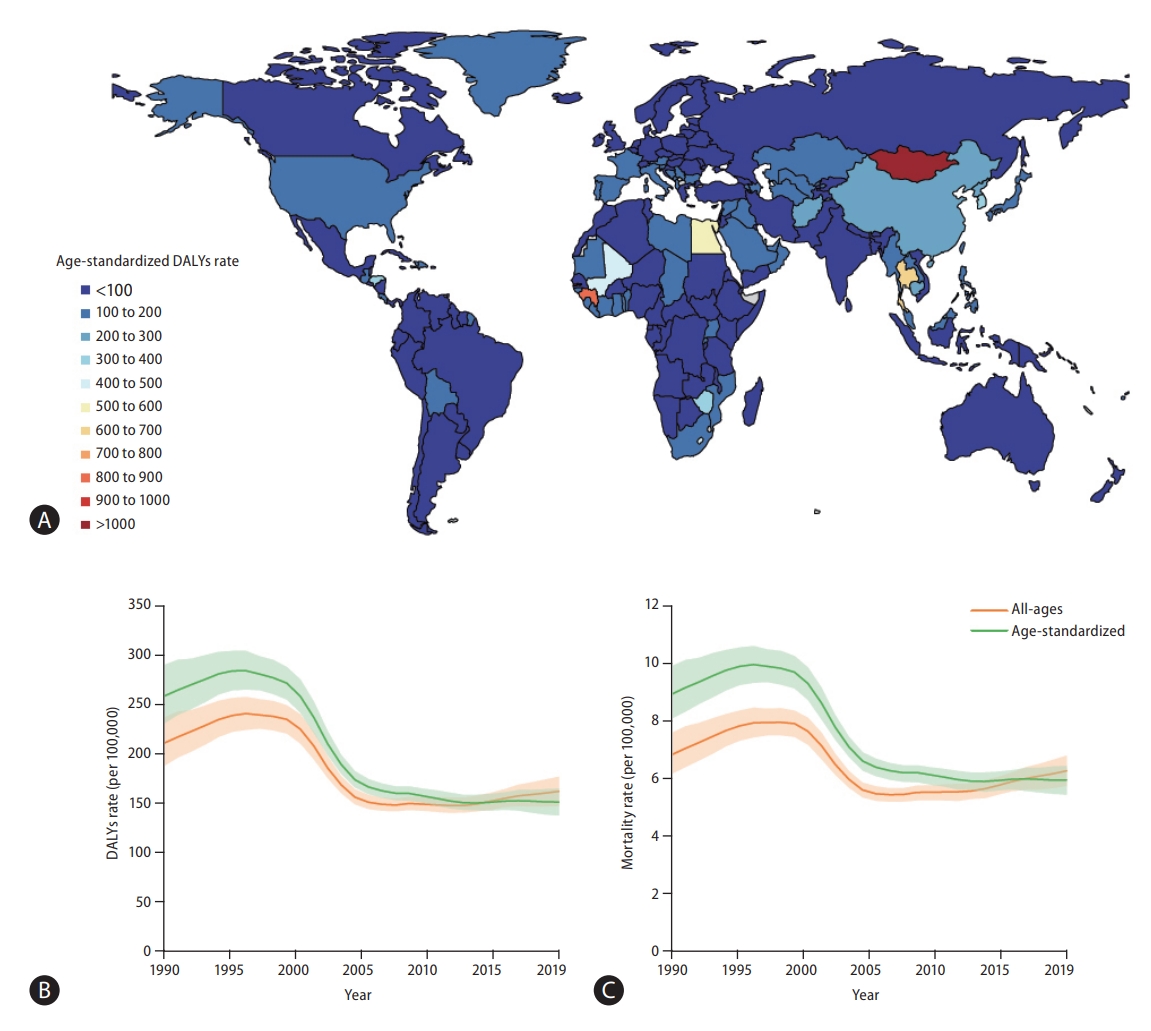
A world map of Age-standardized disease-adjusted life year (DALY) rates (per 100,000 individuals) is shown in Figure 1A. At the global level, the number of DALYs from liver cancer increased from 11,278,630 (95% UI, 10,062,526–12,677,403) in 1990 to 12,528,422 (95% UI, 11,400,671–13,687,675) in 2019 (Table 1). The number of deaths also increased from 365,215 (95% UI, 329,967–405,774) to 484,577 (95% UI, 444,091– 525,798) from 1990 to 2019 (Table 1), and the total number of liver cancer patients almost doubled from 433,327 (95% UI, 390,105–482,719) to 747,288 (95% UI, 680,904–822,765) during the same period (Supplementary Table 2).
age-standardized DALY and mortality rates showed similar trends during the study period (Fig. 1B, C). From 1990 to 1996, Age-standardized DALY rate increased from 258.4 (95% UI, 230.9–290.1) to 284.1 (95% UI, 265–304.1), and Age-standardized mortality rate increased from 8.9 (95% UI, 8.1–9.9) to 10 (95% UI, 9.3–10.6). In the 1996 to 2012 period, decreasing age-standardized DALY and mortality rates were observed (in 2012, age-standardized DALY rate: 150.4, 95% UI, 143.4–158.5; age-standardized mortality rate: 5.9, 95% UI, 5.6–6.2). After 2012, age-standardized DALY and mortality rates slightly increased during the study period (in 2019, age-standardized-DALY rate: 151.1, 95% UI, 137.5–164.8; age-standardized mortality rate: 5.9, 95% UI, 5.4–6.4). Overall, both age-standardized DALY and mortality rates showed a decrease, with respective decreases of 41.5% (95% UI, 31.5–49.8) and 33.4% (95% UI, 23.2–41.9) during the study period. Age-standardized rates of prevalence and incidence showed a decline between 1990 and 2019: age-standardized prevalence rates slightly decreased from 10.2 (95% UI, 9.2–11.3) to 9.1 (95% UI, 8.3–10.0) and age-standardized incidence rates from 9 (95% UI, 8.1–10) to 6.5 (95% UI, 5.9–7.2; Supplementary Tables 2, 5).
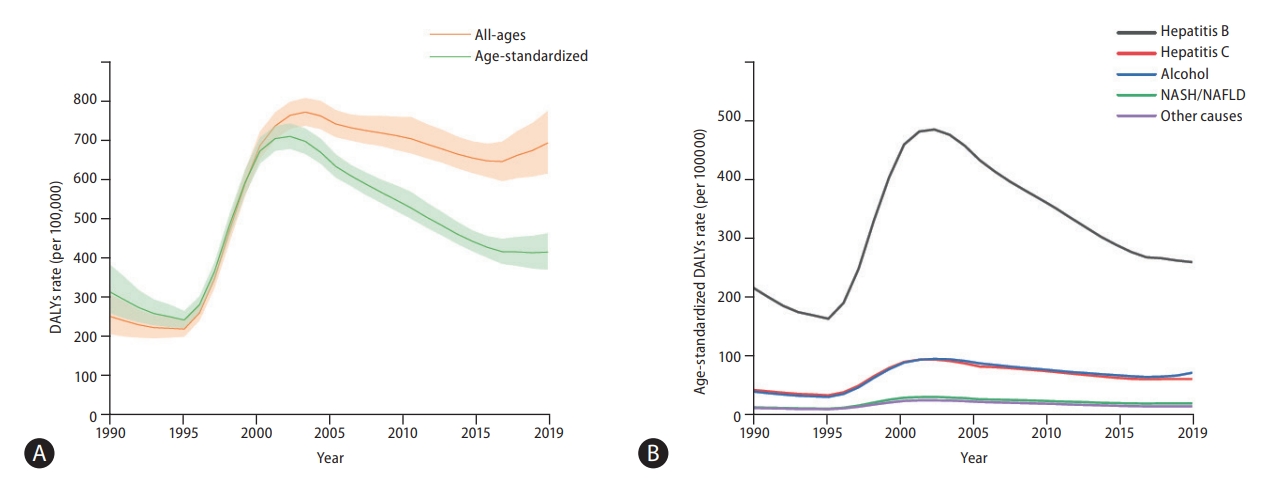
The Republic of Korea shows an overall declining trend of liver cancer burden during the past decade, with age-standardized DALY rate decreasing 21.2% (95% UI, -31.2% to -10.6%; Fig. 2). In 2019, the Republic of Korea had a 390.8 (95% UI, 348.6–435.9) age-standardized DALY rate, 16.2 (95% UI, 14.5–17.9) age-standardized mortality rate, and 22.8 (95% UI, 18.7–27.3) age-standardized incidence rate for liver cancer (Fig. 2, Supplementary Figs. 2527).

Burden of liver cancer based on geographic and sociodemographic region

The burden of liver cancer based on geographic and sociodemographic characteristics is summarized in Table 1. The age-standardized DALY rate of liver cancer varies widely worldwide. In 2019, among the 21 GBD-classified regions, East Asia had the highest age-standardized DALY rates (263.4; 95% UI, 221.3–312.2), followed by high-income populations in Asia-Pacific (238.6; 95% UI, 220.6–255.5) and Central Asia (213.5; 95% UI, 184.9–244.5). Although East Asia and high-income Asia-Pacific regions exhibited a decrease between 1990 and 2019, age-standardized DALY rates in Central Asia increased by 150.2% (95% UI, 111.1–196.2%), as did that in high-income North America and Australasia, increasing by 107% (95% UI, 84.0–126.2%) and 94.8% (95% UI, 77.6–112%), respectively. Similar trends were observed with mortality: high-income Asia-Pacific, East Asia, and Central Asia had the highest age-standardized incidence rates in 2019, and Central Asia, high-income North America, and Australasia showed the largest percentage changes between 1990 and 2019.
In 2019, the middle SDI quintile had the highest Age-standardized DALY, mortality, and incidence rates of 206.9, 7.9, and 8.3 (95% UI, 180.2–235, 95% UI, 7.0–8.9, and 95% UI, 7.2–9.5), respectively.

Burden of liver cancer based on aetiology

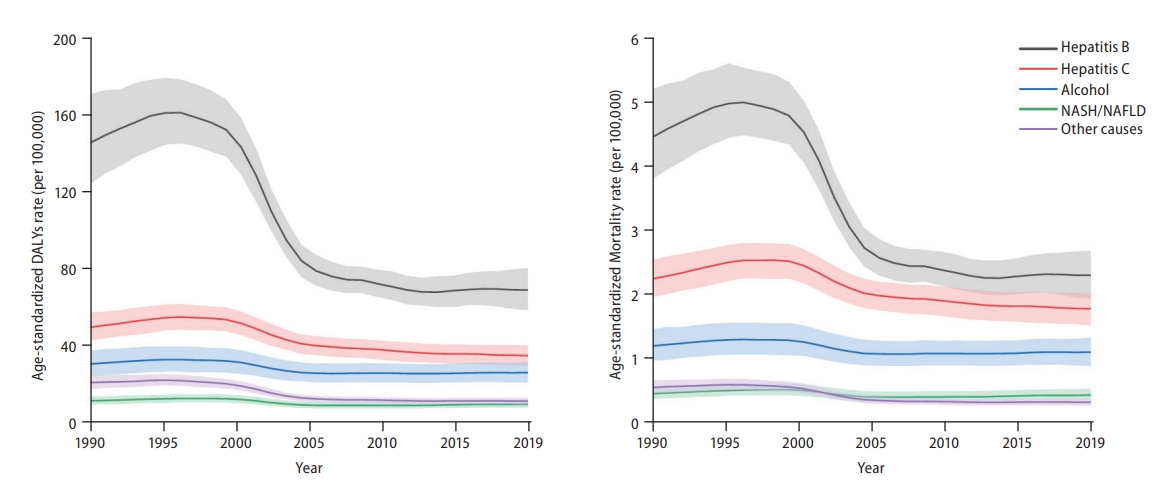
Globally, in 2019, HBV remained the leading cause of Age-standardized liver cancer DALY and mortality rates, followed by HCV, alcohol consumption, and NASH/NAFLD (Fig. 3). Although other aetiologies have remained stable or decreased during the past 10 years, the age-standardized DALY and mortality rates of liver cancer due to alcohol consumption and NASH/NAFLD have gradually increased over the past decade (Fig. 3). Data regarding liver cancer due to other causes is shown in Supplementary Figures 20-23.

Burden of liver cancer due to HBV

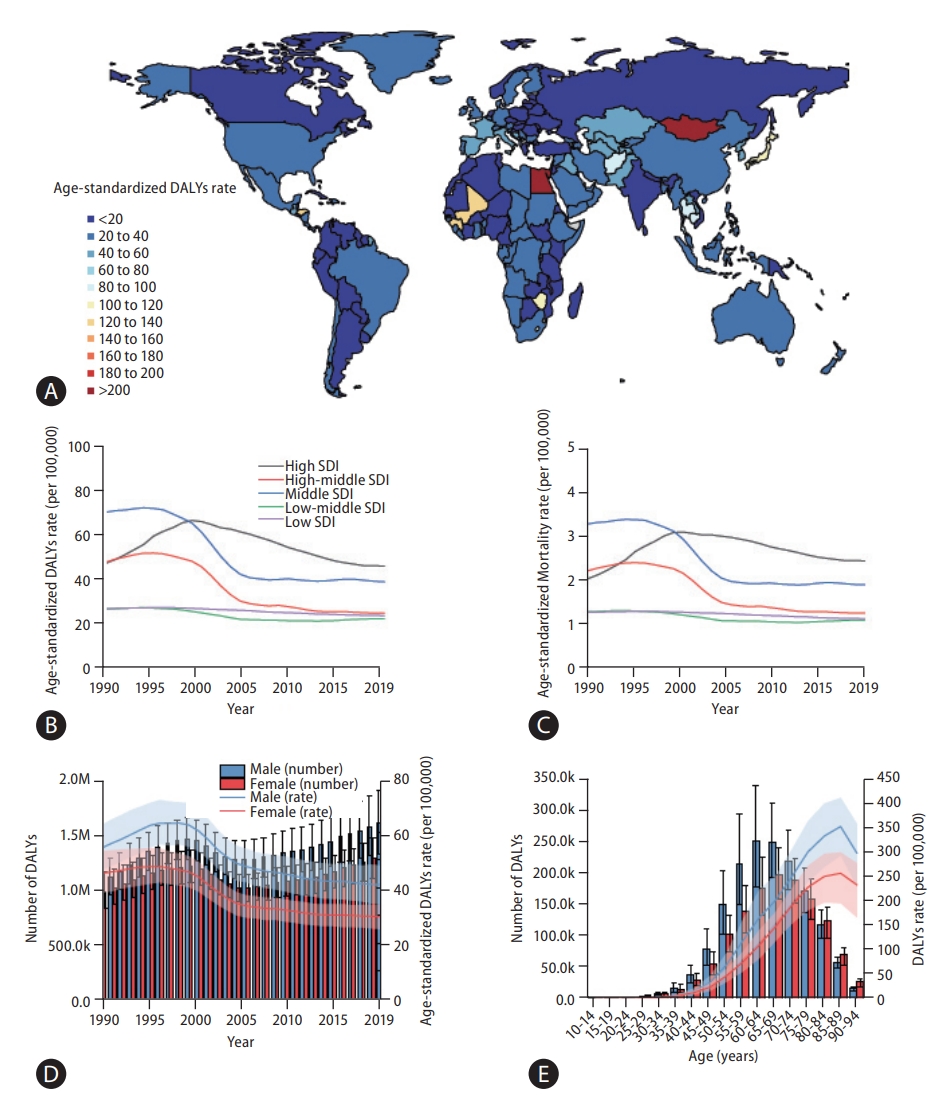
HBV accounts for the highest Age-standardized mortality rate of liver cancer. When stratified based on GBD region, noticeable decrease in Age-standardized DALY and mortality rates was observed in liver cancer caused by HBV in East Asia between 1990 and 2019 (-65.5%, 95% UI, -73.6% to -54% and -64.1%, 95% UI, -72.3% to -52.6%, respectively). However, East Asia remained the region with the highest age-standardized mortality rate due to HBV liver cancer. Central Asia, high-income North America, and Australasia experienced a steep increase in age-standardized DALY rate during the same period (129.9%, 95% UI, 89.5–177.7%; 81.7%, 95% UI, 58.4–103.4%; and 73.2%, 95% UI, 53–93.8%, respectively; Table 2). At the country level, Mongolia showed the highest Age-standardized DALY rate of 763.2 per 100,000 individuals (95% UI, 508.2–1,105.8), followed by Gambia with 627.5 per 100,000 individuals (95% UI, 428.2–889.4) and Guinea with 497.7 per 100,000 individuals (95% UI, 327.7–691.6; Fig. 4A). Liver cancer burden due to HBV is significantly decreasing in the Republic of Korea, with age-standardized DALY rate decreasing by 26.1% (95% UI, -36.5% to -14.7%) in the past decade (in 2019, age-standardized DALY rate: 237, 95% UI, 196.1–279.1; age-standardized mortality rate: 8.8, 95% UI, 7.2– 10.4; Fig. 2, Supplementary Fig. 29).
For all five SDI quintiles, age-standardized DALY and mortality rates remained steady during the past decade. Although an abrupt decline occurred during the early 2000s in the middle- and high-middle SDI quintiles, these quintiles remained at the top regarding liver cancer DALYs and mortality due to HBV (Fig. 4B, C).
Significant sex differences were observed in DALYs of liver cancer caused by HBV, with males showing more than triple the age-standardized DALY rates and number of DALYs than females in 2019 (Fig. 4D). In addition, DALY rates per 100,000 individuals based on age group increased steeply in younger ages and plateaued earlier for males (Fig. 4E).

Burden of liver cancer due to HCV

HCV is the second leading cause of liver cancer based on age-standardized DALY rates. Liver cancer due to HCV showed a different trend, with the high-income Asia-Pacific population showing the greatest age-standardized mortality rate (98.2, 95% UI, 87.1–109). Central Asia, Australasia, and high-income North America were the top three regions with the steepest increase in age-standardized mortality rates of 157.1% (95% UI, 116.6–205.1%), 117.1% (95% UI, 94.5–136.9%), and 117.9% (95% UI, 98.8–140.2%), respectively (Table 2). Mongolia showed the highest age-standardized DALY rate of 752.6 (95% UI, 511.9–1,044.1) per 100,000 population, followed by Egypt and Honduras (Fig. 5A). Liver cancer burden due to HCV is declining in the Republic of Korea, with 16.3% decrease in age-standardized DALY rate (95% UI, -27.7% to -4.4%) in the past decade (in 2019, age-standardized DALY rate: 56, 95% UI, 38.2–75.5; age-standardized mortality rate: 3.1, 95% UI, 2.2–4; Fig. 2, Supplementary Fig. 29).
Contrary to the high-middle and middle SDI regions that showed an abrupt decline during the early 2000s, the high SDI region showed steep increase in age-standardized DALY and mortality rates in the 1990s but experienced a gradual decrease until 2019. Even after a gradual decrease, the high SDI quintile showed the highest age-standardized DALY and mortality rates (Fig. 5B, C). Notably, age-standardized DALY rates decreased for high and high-middle SDI quintiles during the last decade, while the other quintiles showed minimal to no change (Fig. 5B).
Figure 5D shows the sex differences in number of deaths and age-standardized mortality rates for liver cancer due to HCV infection. From 1990 to 2019, the age-standardized DALYs rate of liver cancer due to hepatitis HCV was higher in males than females. age-standardized DALY rates showed a decreasing trend during the past decade in both sexes (Fig. 5D). The number of DALYs based on age group showed a unique pattern: in younger age groups, more DALYs occurred in males; however, after 85 years of age, this pattern was reversed (Fig. 5E).

Burden of liver cancer due to alcohol consumption

Liver cancer caused by alcohol consumption accounts for the third greatest aetiology in age-standardized DALY rates of liver cancer. For liver cancer due to alcohol consumption, Central Asia, high-income North America, and Eastern Europe experienced significant increase between 1990 and 2019, of 182.6% (95% UI, 134–235.3%), 125.7% (95% UI, 96.5– 151%), and 109.8% (95% UI, 82.5–143.5%), respectively. At the country level, Mongolia had a significantly high age-standardized DALY rate of 786.6 per 100,000 individuals (95% UI, 516.1–1,130), followed by Gambia (201.5, 95% UI, 144.6–312) and Thailand (176.3, 95% UI, 112.8–265.3; Fig. 6A). Although liver cancer burden due to alcohol consumption decreased in the Republic of Korea by 4.9% (95% UI, -20% to -12.1%) from 2010 to 2019, the recent trend shows an increasing burden (in 2019, Age-standardized DALY rate: 65.8, 95% UI, 44.7–91.9; age-standardized mortality rate: 2.9, 95% UI, 2–4; Fig. 2, Supplementary Fig. 29).
Middle and low-middle SDI quintiles showed an increasing age-standardized DALY rate trend, with the highest Age-standardized DALY rate in 2019 in the high SDI quintile (Fig. 6B, C).
Sex differences are prominent in liver cancer caused by alcohol consumption. Age-standardized DALY rates differed more than four-fold between males and females. The number of DALYs from alcohol-related liver cancer in males has significantly increased during the past decade (Fig. 6D). In addition, both the number of DALYs and DALY rates were higher in males than in females in each age group (Fig. 6E).

Burden of liver cancer due to NASH/NAFLD

In 2019, among the four major aetiologies of liver cancer, NASH/NAFLD showed the lowest age-standardized DALY rate. The highest percentage increase in age-standardized mortality rates of liver cancer due to NASH/NAFLD occurred in Central Asia (243.8%, 95% UI, 188.1–304.5%), Australasia (175.7%, 95% UI, 135.8–216.3%), and high-income North America (128.5%, 95% UI, 103.7–148.8%); Table 2). In 2019, Mongolia had the highest Age-standardized DALY rate of 167.2 (95% UI, 106.9–249) per 100,000 individuals, and Gambia and Guinea were the second and third highest countries (Fig. 7A). For the past decade, the Republic of Korea showed a decreased age-standardized DALY rate of 14.8% (95% UI, -27% to -0.6%) with recent years plateauing (in 2019, Age-standardized DALY rate: 18.4, 95% UI, 12.7–26.8; Age-stan-dardized mortality rate: 0.9, 95% UI, 0.6–1.4; Fig. 2, Supplementary Fig. 29).
In 2019, the middle SDI quintile had the highest age-standardized DALY and mortality rates, which have been increasing during the past decade. Unlike the comparatively low age-standardized DALY and mortality rates, the age-standardized incidence rates were relatively high in the high SDI quintile compared with the middle SDI quintile (Fig. 7B, C, Supplementary Fig. 17).
The number of DALYs from NASH/NAFLD-related liver cancer has increased for both sexes during the past decade (Fig. 7D). In addition, after the 75–79-year age group, females showed a higher number of DALYs but with a similar pattern in rate compared with males (Fig. 7E).

DISCUSSION

In the present study, we showed that the crude numbers of DALYs, deaths, and incident cases of liver cancer significantly increased between 1990 and 2019. However, age-standardized DALYs, mortality, and incidence rates have declined. The discrepancy between the number and rates of DALYs, deaths, and cases might be explained by the aging population structure [9,10]. With continued aging and population growth, the number and rate of incidence, as well as years of life lost and mortality, are projected to increase in the near future [11-13]. Concordant with previous studies, HBV remains the leading cause of liver cancer mortality and incidence, followed by HCV, alcohol consumption, and NASH/NAFLD [14]. Age-standardized mortality rates of liver cancer due to HBV and HCV have decreased during the past decade, possibly due to the effect of HBV vaccination and nucleos(t)ide analogues (NUCs) [15] and novel DAAs against HCV [16,17]. However, age-standardized mortality rates of liver cancer due to alcohol consumption and NASH/NAFLD have increased.
Patterns of liver cancer burden also vary significantly between regions and countries. In 2019, the liver cancer burden due to HBV was high in HBV-endemic regions such as East Asia, high-income Asia-Pacific, Southeast Asia, and Southern and Western Sub-Saharan Africa [18]. However, most of these regions are experiencing or will have a significant decrease in the burden of liver cancer due to HBV through universal HBV immunization programs and HBV screenings [18-20]. In contrast, the overall age-standardized mortality and incidence rates were low in the high-income countries of North America and Australasia, but increased to >80% in 2019 compared with 1990. In addition, the GBD 2019 data showed an inverse trend in the age-standardized incidence rates of acute HBV infection, cirrhosis, and other chronic diseases due to HBV compared with HBV-attributable liver cancer in these regions (Supplementary Figs. 16). Therefore, despite the current use of potent NUCs, liver cancer progression rates are not well controlled [21-24]. In the era of pre-NUCs, patients with chronic HBV infection would die before de novo hepatocarcinogenesis due to hepatic decompensation. Because HCC risk cannot be eliminated using only potent NUCs, the development of novel treatments is required to effectively eradicate closed circular DNA in hepatocytes. Furthermore, a more effective HCC surveillance strategy should be established to detect patients at an early stage and implement curative treatment.
In contrast to HBV infection, liver cancer due to HCV infection has a different threat pattern. Countries with high SDI were more affected by liver cancer due to HCV infection, with the high-income Asia-Pacific region showing the highest age-standardized mortality rates. However, with the development of DAAs with sustained virological response rates near 95%, the incidence and mortality caused by liver cancer due to HCV are expected to significantly decrease in the next decades [25-30]. Notably, in high-income North America and Australasia, the age-standardized mortality rates have doubled in 2019 compared with 1990. This trend, however, is likely due to the 20-to 40-year lag from HCV infection to HCC progression [31]. The effect of the 1945–1965 birth cohort in the United States with significantly high HCV infection rates [32,33] and the use of injectable drugs in Australia [34] could be causing this increase. Thus, even with careful measures, the burden of liver cancer due to HCV infection is likely to increase before the effects of intervention occur. In contrast to the past decade, when mainly high and high-middle SDI quintiles showed a decrease in age-standardized DALY rates, lowand middle-income countries are also likely to benefit from DAAs because of the production of cost-effective generic DAAs in the near future [35,36]. Only 21% of the HCV-infected population knew their diagnosis and only 62% were treated with DAAs in 2019 according to a WHO report [37], with many low- and middle-income countries lacking current standard diagnostic methods [36]. Thus, systematic and universal screening and appropriate referrals for HCV in endemic regions should be recommended with development of novel cost-effective diagnostic tests [38-41]. However, to prevent infection, an effective HCV vaccine is needed [42,43].
Contrary to liver cancer due to HBV and HCV, the age-standardised incidence and mortality of liver cancer due to alcohol consumption are increasing. Assuming an 8- to-9- year latency period of alcohol-induced liver cancer [44,45], the increasing trend of liver cancer due to alcohol consumption is concordant with the WHO Global information system on alcohol and health data (alcohol, total per capita [15+] consumption). A sharp increase was observed from 5.3 litres (95% confidence interval [CI] 5–6.5) in 2005 to 6.1 litres (95% CI 5.8–6.5) in 2010 [46]. If the trend of liver cancer due to alcohol consumption follows the alcohol consumption data, the number of liver cancers due to alcohol consumption is likely to remain steady in the next decade as alcohol consumption remains steady or possibly decreases (2019 alcohol consumption, 5.8, 95% CI, 5.5–6.2). Among the GBD regions, Central Asia, high-income North America, and Eastern Europe have experienced significant increase in age-standardized liver cancer mortality due to alcohol consumption. This is in agreement with previous studies reporting higher liver cancer mortality rates due to alcohol consumption in Central Asia and Eastern Europe in the 2012 to 2017 period [47]. In addition, alcohol consumption was recently suggested as a main reason for the increase in age-standardized mortality rate of HCC in the United States [48].
Furthermore, the liver cancer burden due to NASH/NAFLD is markedly increasing. As the prevalence of NAFLD significantly increases [49], and more than 25% of the global population suffers from NAFLD [50-52], liver cancer due to NASH/NAFLD will also likely increase for a prolonged period. Modelling studies have predicted that NAFLD-related HCC incidence will increase in the near future, with the United States experiencing a 137% increase in incidence rate by 2030 [53]. Similarly, China, France, Germany, Italy, Japan, and the United Kingdom will experience noticeable increase by 2030 [54]. Thus, controlling obesity and diabetes in the population [55,56], promoting weight loss [57,58], promoting a balanced diet [59], and suggesting chemoprevention for patients with comorbidities such as diabetes, obesity, and cardiovascular diseases[57,60] should be implemented in regions with a high number of NASH/NAFLD patients. Particular attention should be given to Central Asia, Australasia, and high-income North America where age-standardized DALY rates increased more than two-fold compared with those in 1990.
Liver cancer burden in the Republic of Korea has shown a declining trend during the past decade, with gradually decreasing age-standardized DALYs and mortalities. This could be attributed to the widespread use of NUCs for HBV, DAAs against HCV, and better treatment options for liver cancer patients. However, in agreement with the recent report on chronic liver disease [61], liver cancer burden due to alcohol consumption has increased in recent years. Although alcohol consumption in the Republic of Korea has declined in recent years, alcohol consumption continuously increased from 1998 to 2015 [62]. Thus, further measures to control alcohol consumption are needed to reduce the burden of alcohol-related liver cancer.
Sex and age differences were observed in liver cancer burden. Males tended to have a higher burden of liver cancer due to all major aetiologies, except NASH/NAFLD. The HBV genome has been suggested to interact with androgens, leading to increased expression of oncoproteins [63,64]. Oestrogen receptor expression and epigenetic mechanisms are associated with HCV-HCC [64,65]. and gender differences exist in alcohol consumption [66]. Various mechanisms have been proposed, including the protective role of oestrogen, HCC-promoting role of androgens, and additional role of sex chromosomes [67]. Furthermore, the age group with the highest incidence in females was older and postmenopausal, which may be partially explained by the progression of liver fibrosis that can accelerate after menopause [68], and because postmenopausal hormone therapy has a protective effect against liver cancer [69].
The main strength of the present study includes the analysis of the most recent data on the global burden of liver cancer, focusing on DALYs of major liver cancer aetiologies. To the best of our knowledge, this study is the first to analyse indepth DALYs of liver cancer based on aetiology. However, this study had several limitations. First, because data from the GBD 2019 database were analysed, the same limitations of the original dataset were applicable to the current study. Major limitations include the availability of primary data and the use of statistical modelling to generate estimates. For regions that lacked sufficient quality data, GBD estimates relied on predictive covariates and modelling measures. In addition, even when primary data were available, delay in data reporting and data obtained without using the preferred case definition could limit accuracy of the estimates. Thus, results need to be carefully interpreted regarding uncertainty intervals. In addition, due to the lack of data, various types of cancer have been widely identified as liver cancer, which hampered accurate analysis of gender and age differences. Third, the GBD 2019 database lacks detailed information other than epidemiological data such as vaccination policy changes, antiviral therapy use, and public health measures. Thus, this detailed information could not be included in the analysis.
In conclusion, despite substantial advances in prevention, diagnosis, and treatment, liver cancer continues to be an ongoing global threat. In particular, the liver cancer burden due to alcohol consumption and NASH/NAFLD is increasing and will continue to significantly increase if an effective intervention is not implemented. Because the burden of liver cancer significantly varies based on geographic region, SCI, sex, and age group, a more tailored approach should be implemented.

Lay summary

The global distribution of dominant liver cancer etiologies likely differs across global regions due to differential distribution or availability of effective antiviral drugs. Updated temporal trends of liver cancer aetiologies and sociodemographic status from 1990 to 2019 based on the Global Burden of Disease 2019 report were analysed in this study.

ACKNOWLEDGMENTS

This study was supported by Basic Science Research Program through the National Research Foundation of Korea (NRF) funded by the Ministry of Science, ICT & Future Planning (2019R1A2C4070136) and by the Technology Innovation Program (20013712) funded by the Ministry of Trade, Industry & Energy (MOTIE, Korea). The funders had no role in study design, data collection and analysis, decision to publish, or preparation of the manuscript. This research was also funded by the National Research Foundation of Korea (NRF-2021R1I1A2059735).

FOOTNOTES

Authors’ contribution
S Choi, BK Kim, DK Yon, SW Lee, JI Shin, and SU Kim: study concept and design; S Choi and HG Lee: data acquisition and analysis; S Choi, BK Kim, JI Shin and SU Kim: manuscript drafting and data interpretation; S Choi, BK Kim, DK Yon, SW Lee, HG Lee, HH Chang, JI Shin, SU Kim, S Park, A Koyanagi, L Smith, L Jacob, E Dragiotiv, and J Radua: manuscript revision, provided critical comments, and wrote the final version of the manuscript; BK Kim, DK Yon, SW Lee, JI Shin, and SU Kim: study supervision. All authors made substantial contributions to the following: (1) conception and design of the study, data acquisition, or analysis and interpretation of data; (2) drafting or critical revision of the article for intellectual content; and (3) final approval of version to be submitted.
Conflicts of Interest
Seung Up Kim has served as an advisory committee member Gilead Sciences, Bayer, Eisai, and Novo Nordisk. He is a speaker for Gilead Sciences, GSK, Bayer, Eisai, Abbvie, EchoSens, MSD, Eisai, Otsuka, and Bristol-Myers Squibb. He has also received a research grant from Abbvie and Bristol-Myers Squibb. The other authors declare that they have no competing interests.

Supplementary materials

Supplementary material is available at Clinical and Molecular Hepatology website (http://www.e-cmh.org).
Supplementary Material 1.
GATHER checklist of information that should be included in reports of global health estimates
cmh-2022-0316-Supplementary-1.pdf
Supplementary Figure 1.
Age-standardized incidence rate of acute HBV in high-income North America from 1990 to 2019. HBV, hepatitis B virus.
cmh-2022-0316-Supplementary-Fig-1.pdf
Supplementary Figure 2.
Age-standardized incidence rate of cirrhosis and other chronic liver diseases due to HBV in high-income North America from 1990 to 2019. HBV, hepatitis B virus.
cmh-2022-0316-Supplementary-Fig-2.pdf
Supplementary Figure 3.
Age-standardized incidence rate of liver cancer due to HBV in high-income North America from 1990 to 2019. HBV, hepatitis B virus.
cmh-2022-0316-Supplementary-Fig-3.pdf
Supplementary Figure 4.
Age-standardized incidence rate of acute HBV in Australasia from 1990 to 2019. HBV, hepatitis B virus.
cmh-2022-0316-Supplementary-Fig-4.pdf
Supplementary Figure 5.
Age-standardized incidence rate of cirrhosis and other chronic liver diseases due to HBV in Australasia from 1990 to 2019. HBV, hepatitis B virus.
cmh-2022-0316-Supplementary-Fig-5.pdf
Supplementary Figure 6.
Age-standardized incidence rate of liver cancer due to HBV in Australasia from 1990 to 2019. HBV, hepatitis B virus.
cmh-2022-0316-Supplementary-Fig-6.pdf
Supplementary Figure 7.
Age-standardized incidence rate of liver cancer due to five causes at the global level from 1990 to 2019. NASH, non-alcoholic steatohepatitis.
cmh-2022-0316-Supplementary-Fig-7.pdf
Supplementary Figure 8.
Age-standardized incidence rates of liver cancer due to HBV at the SDI regional level from 1990 to 2019. HBV, hepatitis B virus; SDI, sociodemographic index.
cmh-2022-0316-Supplementary-Fig-8.pdf
Supplementary Figure 9.
Number and age-standardized incidence rates of liver cancer due to HBV at the global level from 1990 to 2019. HBV, hepatitis B virus.
cmh-2022-0316-Supplementary-Fig-9.pdf
Supplementary Figure 10.
Number and mortality rates of liver cancer due to HBV at the global level in 2019. HBV, hepatitis B virus.
cmh-2022-0316-Supplementary-Fig-10.pdf
Supplementary Figure 11.
Age-standardized incidence rates of liver cancer due to HCV at the SDI regional level from 1990 to 2019. HCV, hepatitis C virus; SDI, sociodemographic index.
cmh-2022-0316-Supplementary-Fig-11.pdf
Supplementary Figure 12.
Number and age-standardized incidence rates of liver cancer due to HCV at the global level from 1990 to 2019. HCV, hepatitis C virus.
cmh-2022-0316-Supplementary-Fig-12.pdf
Supplementary Figure 13.
Number and mortality rates of liver cancer due to HCV at the global level in 2019. HCV, hepatitis C virus.
cmh-2022-0316-Supplementary-Fig-13.pdf
Supplementary Figure 14.
Age-standardized incidence rates of liver cancer due to alcohol consumption at the SDI regional level from 1990 to 2019. SDI, sociodemographic index.
cmh-2022-0316-Supplementary-Fig-14.pdf
Supplementary Figure 15.
Number and age-standardized incidence rates of liver cancer due to alcohol consumption at the global level from 1990 to 2019. DALY, disease-adjusted life year.
cmh-2022-0316-Supplementary-Fig-15.pdf
Supplementary Figure 16.
Number and mortality rates of liver cancer due to alcohol consumption at the global level in 2019.
cmh-2022-0316-Supplementary-Fig-16.pdf
Supplementary Figure 17.
Age-standardized incidence rates of liver cancer due to NASH at the SDI regional level from 1990 to 2019. NASH, non-alcoholic steatohepatitis; SDI, sociodemographic index.
cmh-2022-0316-Supplementary-Fig-17.pdf
Supplementary Figure 18.
Number and age-standardized incidence rates of liver cancer due to NASH at the global level from 1990 to 2019. NASH, non-alcoholic steatohepatitis.
cmh-2022-0316-Supplementary-Fig-18.pdf
Supplementary Figure 19.
Number and mortality rates of liver cancer due to NASH at the global level in 2019. NASH, non-alcoholic steato- hepatitis.
cmh-2022-0316-Supplementary-Fig-19.pdf
Supplementary Figure 20.
Age-standardized incidence rates of liver cancer due to other causes at the SDI regional level from 1990 to 2019. SDI, sociodemographic index.
cmh-2022-0316-Supplementary-Fig-20.pdf
Supplementary Figure 21.
Number and age-standardized incidence rates of liver cancer due to other causes at the global level from 1990 to 2019.
cmh-2022-0316-Supplementary-Fig-21.pdf
Supplementary Figure 22.
Number and mortality rates of liver cancer due to other causes at the global level in 2019.
cmh-2022-0316-Supplementary-Fig-22.pdf
Supplementary Figure 23.
Global burden of liver cancer caused by other causes: (A) World map of age-standardized mortality rates (per 100,000 population) of liver cancer caused by other causes at the country level in 2019; (B) age-standardized mortality rates (per 100,000 population) of liver cancer caused by other causes at the SDI regional level; (C) age-standardized incidence rates (per 100,000 population) of liver cancer due to other causes at the SDI regional level; (D) number and age-standardized mortality rates (per 100,000 population) of liver cancer due to other causes at the global level from 1990 to 2019; and (E) number and incidence rates (per 100,000 population) of liver cancer due to other causes at the global level based on age group in 2019. SDI, sociodemographic index.
cmh-2022-0316-Supplementary-Fig-23.pdf
Supplementary Figure 24.
All-ages and age-standardized DALY rates of liver cancer in the Republic of Korea from 1990 to 2019. DALY, disease-adjusted life year.
cmh-2022-0316-Supplementary-Fig-24.pdf
Supplementary Figure 25.
All-ages and age-standardized mortality rates of liver cancer in the Republic of Korea from 1990 to 2019.
cmh-2022-0316-Supplementary-Fig-25.pdf
Supplementary Figure 26.
All-ages and age-standardized prevalence rates of liver cancer in the Republic of Korea from 1990 to 2019.
cmh-2022-0316-Supplementary-Fig-26.pdf
Supplementary Figure 27.
All-ages and age-standardized incidence rates of liver cancer in the Republic of Korea from 1990 to 2019.
cmh-2022-0316-Supplementary-Fig-27.pdf
Supplementary Figure 28.
Age-standardized DALY rates of liver cancer due to causes in the Republic of Korea from 1990 to 2019. DALY, disease-adjusted life year; NASH, non-alcoholic steatohepatitis; NAFLD, non-alcoholic fatty liver disease.
cmh-2022-0316-Supplementary-Fig28.pdf
Supplementary Figure 29.
Age-standardized mortality rate of liver cancer due to five causes in the Republic of Korea from 1990 to 2019. NASH, non-alcoholic steatohepatitis; NAFLD, non-alcoholic fatty liver disease.
cmh-2022-0316-Supplementary-Fig-29.pdf
Supplementary Figure 30.
Age-standardized prevalence rate of liver cancer due to five causes in the Republic of Korea from 1990 to 2019. NASH, non-alcoholic steatohepatitis; NAFLD, non-alcoholic fatty liver disease.
cmh-2022-0316-Supplementary-Fig-30.pdf
Supplementary Figure 31.
Age-standardized incidence rate of liver cancer due to five causes in the Republic of Korea from 1990 to 2019. NASH, non-alcoholic steatohepatitis; NAFLD, non-alcoholic fatty liver disease.
cmh-2022-0316-Supplementary-Fig-31.pdf
Supplementary Figure 32.
Number and age-standardized DALY rate of liver cancer due to HBV in the Republic of Korea from 1990 to 2019. DALY, disease-adjusted life year; HBV, hepatitis B virus.
cmh-2022-0316-Supplementary-Fig-32.pdf
Supplementary Figure 33.
Number and age-standardized DALY rate of liver cancer due to HCV in the Republic of Korea from 1990 to 2019. DALY, disease-adjusted life year; HCV, hepatitis C virus.
cmh-2022-0316-Supplementary-Fig-33.pdf
Supplementary Figure 34.
Number and age-standardized DALY rate of liver cancer due to alcohol consumption in the Republic of Korea from 1990 to 2019. DALY, disease-adjusted life year.
cmh-2022-0316-Supplementary-Fig-34.pdf
Supplementary Figure 35.
Number and age-standardized DALY rate of liver cancer due to NASH/NAFLD in the Republic of Korea from 1990 to 2019. DALY, disease-adjusted life year; NASH, non-alcoholic steatohepatitis; NAFLD, non-alcoholic fatty liver disease.
cmh-2022-0316-Supplementary-Fig-35.pdf
Supplementary Figure 36.
Number and DALY rate of liver cancer due to HBV in the Republic of Korea in 2019. DALY, disease-adjusted life year; HBV, hepatitis B virus.
cmh-2022-0316-Supplementary-Fig-36.pdf
Supplementary Figure 37.
Number and DALY rate of liver cancer due to HCV in the Republic of Korea in 2019. DALY, disease-adjusted life year; HCV, hepatitis C virus.
cmh-2022-0316-Supplementary-Fig-37.pdf
Supplementary Figure 38.
Number and DALY rate of liver cancer due to alcohol consumption in the Republic of Korea in 2019. DALY, disease-adjusted life year.
cmh-2022-0316-Supplementary-Fig-38.pdf
Supplementary Figure 39.
Number and DALY rate of liver cancer due to NASH/NAFLD in the Republic of Korea in 2019. DALY, disease-adjusted life year; NASH, non-alcoholic steatohepatitis; NAFLD, non-alcoholic fatty liver disease.
cmh-2022-0316-Supplementary-Fig-39.pdf
Supplementary Table 1.
SDI at the country level in 2019
cmh-2022-0316-Supplementary-Table-1.pdf
Supplementary Table 2.
Liver cancer prevalence in 1990 and 2019 for both sexes and percentage change in age-standardized rates based on location
cmh-2022-0316-Supplementary-Table-2.pdf
Supplementary Table 3.
Deaths due to liver cancer in 1990 and 2019 for both sexes and percentage change in age-standardized rates based on location
cmh-2022-0316-Supplementary-Table-3.pdf
Supplementary Table 4.
DALYs due to liver cancer in 1990 and 2019 for both sexes and percentage change in age-standardized rates based on location
cmh-2022-0316-Supplementary-Table-4.pdf
Supplementary Table 5.
Incidence of liver cancer in 1990 and 2019 for both sexes and percentage change in age-standardized rates based on location
cmh-2022-0316-Supplementary-Table-5.pdf
Supplementary Table 6.
YLDs of liver cancer in 1990 and 2019 for both sexes and percentage change in age-standardized rates based on location
cmh-2022-0316-Supplementary-Table-6.pdf
Supplementary Table 7.
YLLs of liver cancer in 1990 and 2019 for both sexes and percentage change in age-standardized rates based on location
cmh-2022-0316-Supplementary-Table-7.pdf

Figure 1.
Global burden of liver cancer. (A) World map of age-standardized disease-adjusted life year (DALY) rates (per 100,000 population) of liver cancer at the country level in 2019, (B) rates (per 100,000 population) of age-standardized and all-age DALYs of liver cancer at the global level between 1990 and 2019, and (C) rates (per 100,000 population) of age-standardized and all-age mortality from liver cancer at the global level from 1990 to 2019. Green line denotes age-standardized rates and orange line all-age rates.

cmh-2022-0316f1.jpg
Figure 2.
Burden of liver cancer in the Republic of Korea. (A) Rates (per 100,000 population) of age-standardized and all-age disease-adjusted life years (DALYs) of liver cancer in the Republic of Korea between 1990 and 2019 and (B) DALY rates (per 100,000 population) of liver cancer based on aetiology in the Republic of Korea from 1990 to 2019. Additional data on liver cancer burden in the Republic of Korea is shown in Supplementary Figures 24-39. NASH, non-alcoholic steatohepatitis; NAFLD, non-alcoholic fatty liver disease.

cmh-2022-0316f2.jpg
Figure 3.
Global trends of liver cancer based on aetiology from 1990 to 2019. (A) Disease-adjusted life year (DALY) rates (per 100,000 population) of liver cancer based on aetiology at the global level from 1990 to 2019 and (B) mortality rates (per 100,000 population) of liver cancer based on aetiology at the global level from 1990 to 2019. Age-standardized incidence rate data is shown in Supplementary Figure 7. NASH, non-alcoholic steatohepatitis; NAFLD, non-alcoholic fatty liver disease.

cmh-2022-0316f3.jpg
Figure 4.
Global burden of liver cancer caused by hepatitis B virus (HBV). (A) World map of age-standardized disease-adjusted life year (DALY) rates (per 100,000 population) of liver cancer caused by HBV at the country level in 2019, (B) age-standardized DALY rates (per 100,000 population) of liver cancer due to HBV at the sociodemographic index (SDI) regional level, (C) age-standardized mortality rates (per 100,000 population) of liver cancer due to HBV at the SDI regional level (Age-standardized incidence rate data is shown in Supplementary Fig. 8), (D) number and age-standardized DALY rates (per 100,000 population) of liver cancer caused by HBV at the global level from 1990 to 2019 (number and Age-standardized rate of incidence is shown in Supplementary Fig. 9), and (E) number and DALY rates (per 100,000 population) of liver cancer caused by HBV at the global level by age group in 2019 (number and Age-standardized rate of mortality is shown in Supplementary Fig. 10).

cmh-2022-0316f4.jpg
Figure 5.
Global burden of liver cancer caused by hepatitis C virus (HCV). (A) World map of age-standardized disease-adjusted life year (DALY) rates (per 100,000 population) of liver cancer caused by HCV at the country level in 2019, (B) age-standardized DALY rates (per 100,000 population) of liver cancer caused by HCV at the sociodemographic index (SDI) regional level, (C) age-standardized mortality rates (per 100,000 population) of liver cancer caused by HCV at the SDI regional level (Age-standardized incidence rate data is shown in Supplementary Fig. 11), (D) number and age-standardized DALY rates (per 100,000 population) of liver cancer caused by HCV at the global level from 1990 to 2019 (number and age-standardized rate of incidence is shown in Supplementary Fig. 12), and (E) number and DALY rates (per 100,000 population) of liver cancer due to HCV at the global level based on age group in 2019 (number and Age-standardized rate of mortality is shown in Supplementary Fig. 13).

cmh-2022-0316f5.jpg
Figure 6.
Global burden of liver cancer caused by alcohol consumption. (A) World map of Age-standardized disease-adjusted life year (DALY) rates (per 100,000 population) of liver cancer caused by alcohol consumption at the country level in 2019, (B) age-standardized DALY rates (per 100,000 population) of liver cancer caused by alcohol consumption at the sociodemographic index (SDI) regional level, (C) Age-standardized mortality rates (per 100,000 population) of liver cancer caused by alcohol consumption at the SDI regional level (Age-standardized incidence rate data is shown in Supplementary Fig. 14), (D) number and age-standardized DALY rates (per 100,000 population) of liver cancer caused by alcohol consumption at the global level from 1990 to 2019 (number and Age-standardized rate of incidence is shown in Supplementary Fig. 15), and (E) number and DALY rates (per 100,000 population) of liver cancer caused by alcohol consumption at the global level based on age group in 2019 (number and Age-standardized rate of mortality is shown in Supplementary Fig. 16).

cmh-2022-0316f6.jpg
Figure 7.
Global burden of liver cancer caused by non-alcoholic steatohepatitis/non-alcoholic fatty liver disease (NASH/NAFLD). (A) World map of age-standardized disease-adjusted life year (DALY) rates (per 100,000 population) of liver cancer caused by NASH/NAFLD at the country level in 2019, (B) age-standardized DALY rates (per 100,000 population) of liver cancer caused by NASH/NAFLD at the sociodemographic index (SDI) regional level, (C) age-standardized mortality rates (per 100,000 population) of liver cancer caused by NASH/NAFLD at the SDI regional level (Age-standardized incidence rate data is shown in Supplementary Fig. 17), (D) number and age-standardized DALY rates (per 100,000 population) of liver cancer caused by NASH/NAFLD at the global level from 1990 to 2019 (number and age-standardized rate of incidence is shown in Supplementary Fig. 18), and (E) number and DALY rates (per 100,000 population) of liver cancer caused by NASH/NAFLD at the global level based on age group in 2019 (number and Age-standardized rate of mortality is shown in Supplementary Fig. 19).

cmh-2022-0316f7.jpg

cmh-2022-0316f8.jpg
Table 1.
Age-standardized DALY rate, age-standardized mortality rate, and cases of liver cancer based on GBD and SDI at the regional level in 1990 and 2019
Region DALYs
Deaths
1990
2019
Percentage change in Age-standardized rates between 1990 and 2019 1990
2019
Percentage change in Age- standardized rates between 1990 and 2019
Counts (95% UI) Rate (95% UI) Counts (95% UI) Rate (95% UI) Counts (95% UI) Rate (95% UI) Counts (95% UI) Rate (95% UI)
Global 11,278,630 (10,062,526, 12,677,403) 258.4 (230.9, 290.1) 12,528,422 (11,400,671, 13,687,675) 151.1 (137.5, 164.8) -0.4 (-0.5, -0.3) 365,215 (329,967, 405,774) 8.9 (8.1, 9.9) 484,577 (444,091, 525,798) 5.9 (5.4, 6.4) -0.3 (-0.4, -0.2)
High SDI 1,206,697 (1,173,184, 1,235,986) 122.2 (118.9, 125.3) 2,277,516 (2,140,287, 2,388,714) 133.1 (125.7, 139.3) 0.1 (0, 0.1) 48,130 (46,467, 49,302) 4.7 (4.5, 4.8) 112,240 (102,489, 118,738) 5.9 (5.4, 6.2) 0.3 (0.2, 0.3)
High-middle SDI 3,243,020 (2,790,860, 3,728,776) 289.9 (249.8, 332.6) 2,502,034 (2,214,723, 2,839,723) 127.3 (112.8, 144.4) -0.6 (-0.6, -0.5) 107,827 (94,484, 122,721) 10 (8.7, 11.3) 97,189 (87,228, 108,111) 4.8 (4.3, 5.4) -0.5 (-0.6, -0.4)
Middle SDI 5,333,641 (4,608,989, 6,183,319) 433.4 (376.3, 501.8) 5,463,765 (4,736,439, 6,221,172) 206.9 (180.2, 235) -0.5 (-0.6, -0.4) 163,806 (142,716, 189,464) 15 (13.1, 17.3) 196,959 (172,834, 223,210) 7.9 (7, 8.9) -0.5 (-0.6, -0.4)
Low-middle SDI 1,139,257 (1,019,675, 1,268,092) 154.5 (139.2, 170.4) 1,616,488 (1,469,159, 1,785,003) 109 (99.2, 120.3) -0.3 (-0.4, -0.2) 34,779 (31,450, 38,178) 5.6 (5.1, 6.1) 57,241 (52,130, 63,452) 4.2 (3.9, 4.7) -0.2 (-0.3, -0.1)
Low SDI 353,051 (309,468, 398,851) 113.1 (98.8, 127.7) 663,784 (570,133, 758,108) 101.2 (88.4, 114.3) -0.1 (-0.2, 0) 10,563 (9,243, 11,898) 4.4 (3.8, 5) 20,756 (18,217, 23,331) 3.9 (3.5, 4.4) -0.1 (-0.2, 0)
East Asia 7,723,663 (6,580,547, 9,129,280) 755.4 (644.7, 893.3) 5,491,479 (4,590,535, 6,534,290) 263.4 (221.3, 312.2) -0.7 (-0.7, -0.5) 237,005 (202,341, 279,889) 25.5 (22, 29.9) 193,864 (163,848, 228,758) 9.4 (8, 11) -0.6 (-0.7, -0.5)
Southeast Asia 551,810 (492,855, 604,067) 180.3 (161.2, 197.5) 1,149,098 (943,489, 1,384,243) 177.5 (146.6, 213.5) 0 (-0.2, 0.2) 17,574 (15,676, 19,279) 6.8 (6, 7.5) 42,862 (35,326, 51,520) 7.3 (6.1, 8.8) 0.1 (-0.1, 0.3)
Oceania 3,557 (3,003, 4,124) 98.3 (82.6, 114.2) 7,093 (5,872, 8,495) 85.4 (71.3, 101.6) -0.1 (-0.3, 0.1) 112 (94, 131) 3.8 (3.2, 4.5) 233 (195, 277) 3.5 (2.9, 4.1) -0.1 (-0.3, 0.1)
Central Asia 43,272 (38,393, 48,032) 85.3 (75.7, 95) 172,830 (148,859, 200,042) 213.5 (184.9, 244.5) 1.5 (1.1, 2) 1,507 (1,348, 1,663) 3.2 (2.9, 3.6) 6,191 (5,387, 7,076) 8.7 (7.6, 9.9) 1.7 (1.3, 2.1)
Central Europe 194,212 (188,478, 199,058) 131.7 (127.7, 135) 156,614 (133,681, 182,107) 79.1 (67.7, 92.3) -0.4 (-0.5, -0.3) 8,114 (7,830, 8,322) 5.6 (5.4, 5.7) 7,202 (6,218, 8,327) 3.4 (2.9, 3.9) -0.4 (-0.5, -0.3)
Eastern Europe 115,457 (110,529, 121,300) 43.5 (41.6, 45.8) 234,701 (205,032, 273,291) 74.9 (65.3, 86.6) 0.7 (0.5, 1) 4,224 (4,055, 4,412) 1.6 (1.5, 1.6) 9,676 (8,506, 11,122) 2.9 (2.5, 3.3) 0.9 (0.6, 1.1)
High-income Asia Pacific 614,780 (594,969, 637,246) 295.6 (285.8, 306.3) 920,379 (842,591, 983,716) 238.6 (220.6, 255.5) -0.2 (-0.3, -0.1) 23,589 (22,762, 24,374) 11.6 (11.2, 12) 49,685 (43,778, 53,504) 10.8 (9.8, 11.5) -0.1 (-0.1, 0)
Australasia 11,484 (11,085, 11,938) 50.3 (48.6, 52.3) 43,655 (40,249, 47,404) 98.1 (90.3, 106.4) 0.9 (0.8, 1.1) 464 (445, 481) 2 (1.9, 2.1) 2,006 (1,832, 2,174) 4.1 (3.8, 4.5) 1.1 (0.9, 1.2)
Western Europe 439,140 (426,685, 449,642) 80.7 (78.5, 82.6) 787,717 (738,440, 836,208) 98.5 (93, 104.5) 0.2 (0.2, 0.3) 19,883 (19,160, 20,419) 3.4 (3.3, 3.5) 40,296 (37,224, 42,876) 4.4 (4.1, 4.7) 0.3 (0.2, 0.4)
Southern Latin America 18,439 (16,686, 20,246) 39.1 (35.4, 42.9) 43,534 (40,967, 46,273) 53.6 (50.4, 57) 0.4 (0.2, 0.5) 755 (683, 829) 1.7 (1.5, 1.8) 2,027 (1,897, 2,152) 2.4 (2.3, 2.6) 0.5 (0.3, 0.6)
High-income North America 167,210 (163,014, 170,516) 51 (49.8, 51.9) 608,194 (543,851, 664,431) 105.5 (94.5, 115.2) 1.1 (0.8, 1.3) 7,074 (6,778, 7,245) 2 (1.9, 2.1) 26,479 (23,637, 28,913) 4.3 (3.8, 4.7) 1.1 (0.9, 1.3)
Caribbean 41,326 (38,233, 44,105) 151.5 (140.4, 161.1) 41,276 (33,562, 50,616) 80.7 (65.6, 99.2) -0.5 (-0.6, -0.4) 1,636 (1,521, 1,735) 6.3 (5.8, 6.7) 1,695 (1,418, 2,005) 3.3 (2.8, 3.9) -0.5 (-0.6, -0.4)
Andean Latin America 30,637 (27,050, 34,452) 129.8 (114, 146.3) 44,340 (35,812, 54,428) 77.3 (62.6, 94.7) -0.4 (-0.5, -0.2) 1,075 (946, 1,211) 5.2 (4.6, 5.9) 1,840 (1,510, 2,232) 3.3 (2.7, 4) -0.4 (-0.5, -0.2)
Central Latin America 84,956 (79,529, 89,037) 89.2 (83.1, 93.8) 197,475 (171,637, 231,238) 82.8 (72.1, 97) -0.1 (-0.2, 0.1) 3,074 (2,858, 3,233) 3.7 (3.5, 3.9) 8,416 (7,357, 9,750) 3.6 (3.2, 4.2) 0 (-0.1, 0.1)
Tropical Latin America 54,246 (52,380, 55,933) 52.2 (50, 53.8) 142,719 (135,353, 150,317) 58.6 (55.4, 61.7) 0.1 (0.1, 0.2) 1,885 (1,803, 1,949) 2.1 (2, 2.2) 5,939 (5,543, 6,239) 2.5 (2.3, 2.6) 0.2 (0.1, 0.3)
North Africa and Middle East 319,736 (284,681, 355,483) 161.1 (141.9, 179.7) 731,622 (578,678, 923,575) 153.3 (121.9, 189.8) 0 (-0.3, 0.3) 10,913 (9,575, 12,227) 6.4 (5.6, 7.2) 26,432 (21,211, 32,611) 6.2 (5.1, 7.6) 0 (-0.2, 0.3)
South Asia 512,899 (446,428, 575,148) 72.9 (61.8, 83) 1,085,515 (943,943, 1,244,802) 71.3 (62, 81.8) 0 (-0.2, 0.2) 15,854 (13,379, 18,088) 2.8 (2.3, 3.3) 38,650 (33,517, 44,561) 2.8 (2.4, 3.2) 0 (-0.2, 0.2)
Central Sub-Saharan Africa 28,800 (23,045, 36,322) 77.3 (64.8, 91.3) 51,448 (38,555, 67,260) 65.3 (51.7, 82.1) -0.2 (-0.4, 0.1) 717 (598, 854) 2.8 (2.4, 3.3) 1,394 (1,108, 1,753) 2.5 (2, 3.1) -0.1 (-0.3, 0.1)
Eastern Sub-Saharan Africa 91,016 (71,408, 113,690) 83 (68.1, 103) 187,944 (149,325, 232,670) 85.5 (70.2, 105.1) 0 (-0.2, 0.3) 2,537 (2,076, 3,145) 3.1 (2.6, 4) 5,677 (4,683, 6,919) 3.4 (2.9, 4.2) 0.1 (-0.1, 0.3)
Southern Sub-Saharan Africa 59,594 (42,648, 98,286) 181.7 (128.9, 300) 122,195 (108,238, 137,902) 188.8 (168.3, 213) 0 (-0.4, 0.6) 1,913 (1,349, 3,140) 6.7 (4.7, 11.1) 4,040 (3,618, 4,540) 7.1 (6.3, 7.9) 0 (-0.4, 0.6)
Western Sub-Saharan Africa 172,397 (145,973, 199,308) 151.3 (129.7, 176.3) 308,593 (252,949, 365,495) 130.8 (109.4, 152.3) -0.1 (-0.3, 0.1) 5,308 (4,553, 6,165) 5.8 (5, 6.8) 9,972 (8,360, 11,564) 5.3 (4.5, 6) -0.1 (-0.3, 0.1)

GBD, global burden of disease; SDI, sociodemographic index; UI, uncertainty index; DALY, disease-adjusted life year.

Individual country data is described in Supplementary Tables 2-7.

Table 2.
Age-standardized DALY rate in 2019 and percentage change in age-standardized DALY rate between 1990 and 2019 of liver cancer caused by specific aetiology based on GBD region
Region Hepatitis B
Hepatitis C
Alcohol
NASH/NAFLD
Age-standardized DALYs Rate in 2019 (95% UI) Percentage change between 1990 and 2019 Age-standardized DALYs Rate in 2019 (95% UI) Percentage change between 1990 and 2019 Age-standardized DALYs Rate in 2019 (95% UI) Percentage change between 1990 and 2019 Age-standardized DALYs Rate in 2019 (95% UI) Percentage change between 1990 and 2019
East Asia 69.1 (58.7, 80.6) -65.5 (-73.6, -54) 35.7 (29.2, 42.6) -66 (-72.9, -57.7) 21.3 (15.7, 27.5) -60 (-68.9, -48.3) 11.4 (9.2, 14) -57.7 (-66.1, -47)
Southeast Asia 176.4 (143.9, 215.6) -12.2 (-31.3, 10.6) 35 (26.2, 45.5) -4.7 (-21.5, 15.6) 44.1 (31.1, 61.3) 22.7 (-5.9, 57.2) 15.6 (11.2, 21.4) 28.8 (2.1, 62.9)
Oceania 73 (55.5, 94.8) -17.8 (-34.2, 1.2) 17.3 (11.6, 24.6) -11.8 (-27.7, 9.2) 10.8 (6.8, 16) -3.5 (-23.5, 20.5) 7.1 (4.9, 10.2) 3 (-15.5, 27.2)
Central Asia 44.8 (34.8, 57.7) 129.9 (89.5, 177.7) 64.3 (45.6, 84) 157.1 (116.6, 205.1) 63 (44.5, 84.4) 182.6 (134, 235.3) 14.6 (10.4, 20.5) 243.8 (188.1, 304.5)
Central Europe 60.6 (43.7, 80.9) -46.5 (-54.9, -37) 17.2 (12.1, 23.3) -43.8 (-52.5, -34.2) 33.3 (25.7, 41.6) -33.4 (-42.9, -21.9) 5.7 (4.1, 7.8) -34.4 (-44.3, -22.6)
Eastern Europe 19.1 (14.1, 25.9) 70.8 (48.1, 97.4) 15.8 (13, 19) 77.5 (57.8, 98.6) 26.6 (21.6, 32.6) 109.8 (82.5, 143.5) 5.4 (4.5, 6.5) 110.4 (86.4, 136.6)
High-income Asia Pacific 20.4 (16.5, 25.2) 11.8 (-5.8-30.1) 98.2 (87.1, 109) -37 (-41.5, -32.8) 32.9 (25.6, 41.9) -14.1 (-25.3, -1.8) 10 (7.9, 12.7) -9.4 (-20.3, 2.9)
Australasia 88.6 (75.8, 102.4) 73.2 (53, 93.8) 27.5 (20.4, 35.6) 117.9 (98.8, 140.2) 38.3 (29.3, 46.8) 83.6 (64.1, 104.2) 9.6 (7.1, 12.6) 175.7 (135.8, 216.3)
Western Europe 16.3 (12.1, 22) 15.2 (6.5, 25.6) 36 (29, 43.6) 19 (11.1, 26.8) 35.9 (28.7, 43.1) 26.4 (17.6, 36.4) 5.8 (4.4, 7.8) 47.4 (36.1, 59.2)
Southern Latin America 14.6 (11.1, 19) 27.2 (11.9, 46) 16.8 (12.1, 21.7) 44.6 (29.2, 63.9) 17.2 (12.5, 22.1) 38.1 (21.2, 59.8) 4.7 (3.3, 6.6) 76.7 (54.2, 103.2)
High-income North America 10.3 (7.2, 14.4) 81.7 (58.4, 103.4) 34.6 (29.3, 40.3) 117.1 (94.5, 136.9) 35.6 (29.2, 42.2) 125.7 (96.5, 151) 9.8 (8, 11.8) 128.5 (103.7, 148.8)
Caribbean 14.4 (11.7, 17.6) -48.6 (-58.3, -35.5) 14.7 (9.6, 21.4) -52.1 (-59.8, -43.4) 26.5 (18.9, 36.1) -44.1 (-54.1, -31.6) 6.8 (4.7, 9.7) -40.5 (-50.7, -28.3)
Andean Latin America 24.8 (17.3, 34.1) -46.1 (-58.6, -31) 5 (3, 7.7) -36.5 (-49.8, -19.7) 22.8 (15.4, 31.7) -36.7 (-51, -18.4) 7 (4.8, 9.9) -23 (-40.9, -1.2)
Central Latin America 34.5 (25.2, 44.9) -22.2 (-33.6, -7.5) 29.3 (23.4, 36.4) -8.7 (-20.4, 5.7) 25.2 (19.5, 31.9) 0.6 (-13.6, 17.9) 7.3 (5.7, 9.4) 19.7 (2.9, 38.7)
Tropical Latin America 13.4 (9.9, 18.2) -4.1 (-10.2, 3) 20.6 (17.9, 23.2) 15.8 (9.3, 23.2) 17.6 (15.2, 20.1) 26.2 (18.2, 35.3) 3.6 (3.1, 4.2) 29.4 (21.7, 37.3)
North Africa and Middle East 11.8 (10.1, 13.8) -16.1 (-32.6, 4.9) 70.9 (50.5, 96.5) -3.1 (-30.2, 38.3) 14.6 (9.3, 22.5) 4.8 (-19.8, 40.5) 15.2 (10.5, 22.2) 27.9 (-2.9, 76.4)
South Asia 41 (30.5, 53.6) -10.8 (-26.5, 7.2) 16.2 (13.2, 19.4) -2.8 (-21.7, 17.1) 17.4 (14, 21.1) 8.8 (-11.8, 34.4) 7.1 (5.7, 8.6) 12 (-8.3, 33)
Central Sub- Saharan Africa 24.3 (20.1, 29.3) -18.6 (-40.2, 10.6) 26.7 (18.8, 35.3) -12.8 (-33.3, 14.7) 8.8 (5.6, 12.8) -7.2 (-29.9, 24.4) 4.2 (2.8, 6.2) 0.6 (-25, 35.5)
Eastern Sub- Saharan Africa 16.9 (11.5, 24.7) 0.2 (-21.1, 28.1) 18.7 (13.9, 24.2) 4 (-18.5, 30.9) 21.1 (15, 29.5) 7.6 (-13.6, 34.3) 9.4 (6.7, 12.6) 17.6 (-5.9, 46.9)
Southern Sub- Saharan Africa 25.3 (18.5, 34) -0.2 (-46.9, 55.5) 45.3 (36.6, 54.6) 5 (-32.6, 51) 36.1 (28.3, 45.7) 6 (-46.1, 71.6) 19.1 (15.5, 23.2) 20.6 (-27.6, 79.7)
Western Sub- Saharan Africa 76.7 (64.3, 91.5) -17.2 (-35.4, 2.4) 24.1 (17.1, 31.5) -13.3 (-28.7, 4.3) 24.2 (17.1, 32.3) -1.8 (-24.3, 22.2) 10.7 (8, 14.4) 6.1 (-14, 30.4)

GBD, global burden of disease; UI, uncertainty index; DALY, disease-adjusted life year.

Abbreviations

GBD
Global Burden of Disease
HBV
hepatitis B virus
HCC
hepatocellular carcinoma
HCV
hepatitis C virus
NASH
non-alcoholic steatohepatitis
NAFLD
non-alcoholic fatty liver disease
SDI
sociodemographic index
SVR
sustained virological response
UI
uncertainty interval
DALY
disease-adjusted life year

REFERENCES

1. Bray F, Ferlay J, Soerjomataram I, Siegel RL, Torre LA, Jemal A. Global cancer statistics 2018: GLOBOCAN estimates of incidence and mortality worldwide for 36 cancers in 185 countries. CA Cancer J Clin 2018;68:394-424. Erratum in: CA Cancer J Clin 2020;70:313.

2. Yu S, Wang H, Hu T, Yu C, Liu H, Chen X, et al. Disease burden of liver cancer attributable to specific etiologies in China from 1990 to 2019: An age-period-cohort analysis. Sci Prog 2021;104:368504211018081.
crossref pmid pdf
3. McGlynn KA, London WT. The global epidemiology of hepatocellular carcinoma: present and future. Clin Liver Dis 2011;15:223-243.
crossref pmid pmc
4. Younossi Z, Anstee QM, Marietti M, Hardy T, Henry L, Eslam M, et al. Global burden of NAFLD and NASH: trends, predictions, risk factors and prevention. Nat Rev Gastroenterol Hepatol 2018;15:11-20.
crossref pmid pdf
5. GBD 2019 Diseases and Injuries Collaborators. Global burden of 369 diseases and injuries in 204 countries and territories, 1990-2019: a systematic analysis for the Global Burden of Disease Study 2019. Lancet 2020;396:1204-1222. Erratum in: Lancet 2020;396:1562.

6. GBD 2017 Colorectal Cancer Collaborators. The global, regional, and national burden of colorectal cancer and its attributable risk factors in 195 countries and territories, 1990-2017: a systematic analysis for the Global Burden of Disease Study 2017. Lancet Gastroenterol Hepatol 2019;4:913-933. Erratum in: Lancet Gastroenterol Hepatol 2020;5:e2.

7. Lee SW, Koo MJ. PRISMA 2020 statement and guidelines for systematic review and meta-analysis articles, and their underlying mathematics: Life Cycle Committee Recommendations. Life Cycle 2022;2:e9.
crossref pdf
8. GBD 2016 Mortality Collaborators. Global, regional, and national under-5 mortality, adult mortality, age-specific mortality, and life expectancy, 1970-2016: a systematic analysis for the Global Burden of Disease Study 2016. Lancet 2017;390:1084-1150. Erratum in: Lancet 2017;390:e38.

9. Global Burden of Disease Liver Cancer Collaboration, Akinyemiju T, Abera S, Ahmed M, Alam N, Alemayohu MA, Allen C, et al. The burden of primary liver cancer and underlying etiologies from 1990 to 2015 at the global, regional, and national level: results from the global burden of disease study 2015. JAMA Oncol 2017;3:1683-1691.
pmid pmc
10. Singal AG, Lampertico P, Nahon P. Epidemiology and surveillance for hepatocellular carcinoma: New trends. J Hepatol 2020;72:250-261.
crossref pmid pmc
11. Valery PC, Laversanne M, Clark PJ, Petrick JL, McGlynn KA, Bray F. Projections of primary liver cancer to 2030 in 30 countries worldwide. Hepatology 2018;67:600-611.
crossref pmid pmc pdf
12. Liu Z, Xu K, Jiang Y, Cai N, Fan J, Mao X, et al. Global trend of aetiology-based primary liver cancer incidence from 1990 to 2030: a modelling study. Int J Epidemiol 2021;50:128-142.
crossref pmid pdf
13. Foreman KJ, Marquez N, Dolgert A, Fukutaki K, Fullman N, Mc-Gaughey M, et al. Forecasting life expectancy, years of life lost, and all-cause and cause-specific mortality for 250 causes of death: reference and alternative scenarios for 2016-40 for 195 countries and territories. Lancet 2018;392:2052-2090.
crossref pmid pmc
14. Lin L, Yan L, Liu Y, Qu C, Ni J, Li H. The burden and trends of primary liver cancer caused by specific etiologies from 1990 to 2017 at the global, regional, national, age, and sex level results from the global burden of disease study 2017. Liver Cancer 2020;9:563-582.
crossref pmid pmc pdf
15. Li C, He WQ. The impact of universal hepatitis B vaccine on the trend of liver cancer from the Global Burden of Disease Study 2017. Liver Int 2021;41:1762-1774.
crossref pmid pdf
16. Dhanasekaran R, Kwo PY. Hepatitis C and hepatocellular cancer: to treat or not to treat. Clin Liver Dis (Hoboken) 2021;17:169-173.
crossref pmid pmc pdf
17. Llovet JM, Kelley RK, Villanueva A, Singal AG, Pikarsky E, Roayaie S, et al. Hepatocellular carcinoma. Nat Rev Dis Primers 2021;7:6.
crossref pmid pdf
18. MacLachlan JH, Cowie BC. Hepatitis B virus epidemiology. Cold Spring Harb Perspect Med 2015;5:a021410.
crossref pmid pmc
19. Spearman CW, Afihene M, Ally R, Apica B, Awuku Y, Cunha L, et al.; Gastroenterology and Hepatology Association of sub-Saharan Africa (GHASSA). Hepatitis B in sub-Saharan Africa: strategies to achieve the 2030 elimination targets. Lancet Gastroenterol Hepatol 2017;2:900-909.
crossref
20. Sarin SK, Kumar M, Eslam M, George J, Al Mahtab M, Akbar SMF, et al. Liver diseases in the Asia-Pacific region: a Lancet Gastroenterology & Hepatology Commission. Lancet Gastroenterol Hepatol 2020;5:167-228. Erratum in: Lancet Gastroenterol Hepatol 2020;5:e2.

21. Choi J, Han S, Kim N, Lim YS. Increasing burden of liver cancer despite extensive use of antiviral agents in a hepatitis B virus-endemic population. Hepatology 2017;66:1454-1463.
crossref pdf
22. Su TH, Tseng TC, Kao JH. HCC risk in patients with HBV-related cirrhosis receiving nucleos(t)ide analogues therapy: Is HCC prevented or delayed? Hepatology 2018;67:1634-1635.
crossref pdf
23. Dargan A, Wong SY, Coben R, Conn M, Dimarino AJ, Hann HW. Persistent risk for hepatocellular carcinoma after more than a decade of successful hepatitis B virus suppression. Minerva Gastroenterol Dietol 2017;63:74-76.
crossref
24. Shinn BJ, Martin A, Coben RM, Conn MI, Prieto J, Kroop H, et al. Persistent risk for new, subsequent new and recurrent hepatocellular carcinoma despite successful anti-hepatitis B virus therapy and tumor ablation: The need for hepatitis B virus cure. World J Hepatol 2019;11:65-73.
crossref
25. D’Ambrosio R, Degasperi E, Colombo M, Aghemo A. Direct-acting antivirals: the endgame for hepatitis C? Curr Opin Virol 2017;24:31-37.
crossref pmid
26. Kanwal F, Kramer J, Asch SM, Chayanupatkul M, Cao Y, El-Serag HB. Risk of hepatocellular cancer in HCV patients treated with direct-acting antiviral agents. Gastroenterology 2017;153:996-1005.e1.
crossref pmid
27. Janjua NZ, Wong S, Darvishian M, Butt ZA, Yu A, Binka M, et al. The impact of SVR from direct-acting antiviral- and interferon-based treatments for HCV on hepatocellular carcinoma risk. J Viral Hepat 2020;27:781-793.
crossref pmid pdf
28. Ioannou GN, Green PK, Berry K. HCV eradication induced by direct-acting antiviral agents reduces the risk of hepatocellular carcinoma. J Hepatol 2017 Sep 9;doi: 10.1016/j.jhep.2017.08.030.
crossref
29. Backus LI, Belperio PS, Shahoumian TA, Mole LA. Impact of sustained virologic response with direct-acting antiviral treatment on mortality in patients with advanced liver disease. Hepatology 2019;69:487-497.
crossref pdf
30. Carrat F, Fontaine H, Dorival C, Simony M, Diallo A, Hezode C, et al.; French ANRS CO22 Hepather cohort. Clinical outcomes in patients with chronic hepatitis C after direct-acting antiviral treatment: a prospective cohort study. Lancet 2019;393:1453-1464.
crossref pmid
31. Axley P, Ahmed Z, Ravi S, Singal AK. Hepatitis C virus and hepatocellular carcinoma: a narrative review. J Clin Transl Hepatol 2018;6:79-84.
crossref
32. Ryerson AB, Eheman CR, Altekruse SF, Ward JW, Jemal A, Sherman RL, et al. Annual Report to the Nation on the Status of Cancer, 1975-2012, featuring the increasing incidence of liver cancer. Cancer 2016;122:1312-1337.
crossref pmid pmc
33. Islami F, Ward EM, Sung H, Cronin KA, Tangka FKL, Sherman RL, et al. Annual Report to the Nation on the Status of Cancer, Part 1:national cancer statistics. J Natl Cancer Inst 2021;113:1648-1669.
crossref pmid pmc pdf
34. Dore GJ, Law M, MacDonald M, Kaldor JM. Epidemiology of hepatitis C virus infection in Australia. J Clin Virol 2003;26:171-184.
crossref pmid
35. Barber MJ, Gotham D, Khwairakpam G, Hill A. Price of a hepatitis C cure: Cost of production and current prices for direct-acting antivirals in 50 countries. J Virus Erad 2020;6:100001.
crossref pmid pmc
36. Graham CS. The current status of US and global access to direct-acting antiviral regimens for hepatitis C virus infection. Clin Liver Dis (Hoboken) 2020;16:16-19.
crossref pmid pmc pdf
37. World Health Organization. Hepatitis C. World Health Organization web site, <https://www.who.int/news-room/fact-sheets/detail/hepatitis-c >. Accessed 13 Dec 2021.

38. Lee JS, Choi HJ, Lee HW, Kim BK, Park JY, Kim DY, et al. Screening, confirmation, and treatment rates of hepatitis C virus infection in a tertiary academic medical center in South Korea. J Gastroenterol Hepatol 2021;36:2479-2485.
crossref pmid pdf
39. Kim HL, Kim KA, Choi GH, Jang ES, Ki M, Choi HY, et al. A costeffectiveness study of universal screening for hepatitis C virus infection in South Korea: A societal perspective. Clin Mol Hepatol 2022;28:91-104.
crossref pmid pmc pdf
40. Huang CF, Wu PF, Yeh ML, Huang CI, Liang PC, Hsu CT, et al. Scaling up the in-hospital hepatitis C virus care cascade in Taiwan. Clin Mol Hepatol 2021;27:136-143.
crossref pmid pmc pdf
41. Alshuwaykh O, Kwo PY. Current and future strategies for the treatment of chronic hepatitis C. Clin Mol Hepatol 2021;27:246-256.
crossref pmid pmc pdf
42. Bailey JR, Barnes E, Cox AL. Approaches, progress, and challenges to hepatitis C vaccine development. Gastroenterology 2019;156:418-430.
crossref pmid pmc
43. Cox AL. Challenges and promise of a hepatitis C virus vaccine. Cold Spring Harb Perspect Med 2020;10:a036947.
crossref pmid pmc
44. Rumgay H, Shield K, Charvat H, Ferrari P, Sornpaisarn B, Obot I, et al. Global burden of cancer in 2020 attributable to alcohol consumption: a population-based study. Lancet Oncol 2021;22:1071-1080.
crossref
45. Grundy A, Poirier AE, Khandwala F, McFadden A, Friedenreich CM, Brenner DR. Cancer incidence attributable to alcohol consumption in Alberta in 2012. CMAJ Open 2016;4:E507-E514.
crossref pmid pmc
46. World Health Organization. Global information system on alcohol and health - Alcohol, total per capita (15+) consumption (in litres of pure alcohol) (SDG Indicator 3.5.2). World Health Organization web site, <https://www.who.int/data/gho/data/indicators/indicator-details/GHO/total-(recorded-unrecorded)-alcohol-per-capita-(15-)-consumption>. Accessed 14 Dec 2021.

47. Paik JM, Golabi P, Younossi Y, Mishra A, Younossi ZM. Changes in the global burden of chronic liver diseases from 2012 to 2017: The growing impact of NAFLD. Hepatology 2020;72:1605-1616.
crossref pmid pdf
48. Paik JM, Golabi P, Biswas R, Alqahtani S, Venkatesan C, Younossi ZM. Nonalcoholic fatty liver disease and alcoholic liver disease are major drivers of liver mortality in the United States. Hepatol Commun 2020;4:890-903.
crossref pmid pmc pdf
49. Ge X, Zheng L, Wang M, Du Y, Jiang J. Prevalence trends in nonalcoholic fatty liver disease at the global, regional and national levels, 1990-2017: a population-based observational study. BMJ Open 2020;10:e036663.
crossref pmid pmc
50. Mitra S, De A, Chowdhury A. Epidemiology of non-alcoholic and alcoholic fatty liver diseases. Transl Gastroenterol Hepatol 2020;5:16.
crossref pmid pmc
51. Younossi ZM, Koenig AB, Abdelatif D, Fazel Y, Henry L, Wymer M. Global epidemiology of nonalcoholic fatty liver disease-Meta-analytic assessment of prevalence, incidence, and outcomes. Hepatology 2016;64:73-84.
crossref pmid
52. Kang SH, Lee HW, Yoo JJ, Cho Y, Kim SU, Lee TH, et al.; Korean Association for the Study of the Liver (KASL). KASL clinical practice guidelines: Management of nonalcoholic fatty liver disease. Clin Mol Hepatol 2021;27:363-401.
crossref pmid pmc pdf
53. Estes C, Razavi H, Loomba R, Younossi Z, Sanyal AJ. Modeling the epidemic of nonalcoholic fatty liver disease demonstrates an exponential increase in burden of disease. Hepatology 2018;67:123-133.
crossref pmid pmc pdf
54. Estes C, Anstee QM, Arias-Loste MT, Bantel H, Bellentani S, Caballeria J, et al. Modeling NAFLD disease burden in China, France, Germany, Italy, Japan, Spain, United Kingdom, and United States for the period 2016-2030. J Hepatol 2018;69:896-904.
crossref
55. Noureddin M, Rinella ME. Nonalcoholic fatty liver disease, diabetes, obesity, and hepatocellular carcinoma. Clin Liver Dis 2015;19:361-379.
crossref pmid pmc
56. Nishida N. Metabolic disease as a risk of hepatocellular carcinoma. Clin Mol Hepatol 2021;27:87-90.
crossref pdf
57. Huang DQ, El-Serag HB, Loomba R. Global epidemiology of NAFLD-related HCC: trends, predictions, risk factors and prevention. Nat Rev Gastroenterol Hepatol 2021;18:223-238.
crossref pmid pmc pdf
58. Sohn W, Lee HW, Lee S, Lim JH, Lee MW, Park CH, et al. Obesity and the risk of primary liver cancer: A systematic review and meta-analysis. Clin Mol Hepatol 2021;27:157-174.
crossref pmid pmc pdf
59. Hydes TJ, Ravi S, Loomba R, E Gray M. Evidence-based clinical advice for nutrition and dietary weight loss strategies for the management of NAFLD and NASH. Clin Mol Hepatol 2020;26:383-400.
crossref pmid pmc pdf
60. Lange NF, Radu P, Dufour JF. Prevention of NAFLD-associated HCC: Role of lifestyle and chemoprevention. J Hepatol 2021;75:1217-1227.
crossref pmid
61. Park SH, Plank LD, Suk KT, Park YE, Lee J, Choi JH, et al. Trends in the prevalence of chronic liver disease in the Korean adult population, 1998-2017. Clin Mol Hepatol 2020;26:209-215.
crossref pmid pmc pdf
62. Kim SY, Kim HJ. Trends in alcohol consumption for Korean adults from 1998 to 2018: Korea national health and nutritional examination survey. Nutrients 2021;13:609.
crossref pmid pmc
63. Li CL, Li CY, Lin YY, Ho MC, Chen DS, Chen PJ, et al. Androgen receptor enhances hepatic telomerase reverse transcriptase gene transcription after hepatitis B virus integration or point mutation in promoter region. Hepatology 2019;69:498-512.
crossref pmid pdf
64. Ruggieri A, Gagliardi MC, Anticoli S. Sex-dependent outcome of hepatitis B and C viruses infections: synergy of sex hormones and immune responses? Front Immunol 2018;9:2302.
crossref pmid pmc
65. Zhao P, Malik S, Xing S. Epigenetic mechanisms involved in HCV-induced hepatocellular carcinoma (HCC). Front Oncol 2021;11:677926.
crossref pmid pmc
66. Matsushita H, Takaki A. Alcohol and hepatocellular carcinoma. BMJ Open Gastroenterol 2019;6:e000260.
crossref pmid pmc
67. Li Y, Xu A, Jia S, Huang J. Recent advances in the molecular mechanism of sex disparity in hepatocellular carcinoma. Oncol Lett 2019;17:4222-4228.
pmid pmc
68. Garate-Carrillo A, Gonzalez J, Ceballos G, Ramirez-Sanchez I, Villarreal F. Sex related differences in the pathogenesis of organ fibrosis. Transl Res 2020;222:41-55.
crossref pmid pmc
69. McGlynn KA, Hagberg K, Chen J, Braunlin M, Graubard BI, Suneja N, et al. Menopausal hormone therapy use and risk of primary liver cancer in the clinical practice research datalink. Int J Cancer 2016;138:2146-2153.
crossref pmid pmc

Editorial Office
The Korean Association for the Study of the Liver
Room A1210, 53 Mapo-daero(MapoTrapalace, Dowha-dong), Mapo-gu, Seoul, 04158, Korea
TEL: +82-2-703-0051   FAX: +82-2-703-0071    E-mail: kasl@kams.or.kr
Copyright © The Korean Association for the Study of the Liver.         
COUNTER
TODAY : 1346
TOTAL : 1782970
Close layer