Clin Mol Hepatol > Volume 29(4); 2023 > Article
Kim, Bae, Lee, Kim, Park, Kim, Cho, Jung, Lee, and Choe: Association of Visceral Fat Obesity, Sarcopenia, and Myosteatosis with Non-Alcoholic Fatty Liver Disease without Obesity

ABSTRACT

Background/Aims

To investigate whether non-alcoholic fatty liver disease (NAFLD) in individuals without generalized obesity is associated with visceral fat obesity (VFO), sarcopenia, and/or myosteatosis.

Methods

This cross-sectional analysis included 14,400 individuals (7,470 men) who underwent abdominal computed tomography scans during routine health examinations. The total abdominal muscle area (TAMA) and skeletal muscle area (SMA) at the 3rd lumbar vertebral level were measured. The SMA was divided into the normal attenuation muscle area (NAMA) and low attenuation muscle area, and the NAMA/TAMA index was calculated. VFO was defined by visceral to subcutaneous fat ratio, sarcopenia by body mass index-adjusted SMA, and myosteatosis by the NAMA/TAMA index. NAFLD was diagnosed with ultrasonography.

Results

Of the 14,400 individuals, 4,748 (33.0%) had NAFLD, and the prevalence of NAFLD among non-obese individuals was 21.4%. In regression analysis, both sarcopenia (men: odds ratio [OR] 1.41, 95% confidence interval [CI] 1.19–1.67, P<0.001; women: OR=1.59, 95% CI 1.40–1.90, P<0.001) and myosteatosis (men: OR=1.24, 95% CI 1.02–1.50, P=0,028; women: OR=1.23, 95% CI 1.04–1.46, P=0.017) were significantly associated with non-obese NAFLD after considering for VFO and other various risk factors, whereas VFO (men: OR=3.97, 95% CI 3.43–4.59 [adjusted for sarcopenia], OR 3.98, 95% CI 3.44–4.60 [adjusted for myosteatosis]; women: OR=5.42, 95% CI 4.53–6.42 [adjusted for sarcopenia], OR=5.33, 95% CI 4.51–6.31 [adjusted for myosteatosis]; all P<0.001) was strongly associated with non-obese NAFLD after adjustment with various known risk factors.

Conclusions

In addition to VFO, sarcopenia and/or myosteatosis were significantly associated with non-obese NAFLD.

Graphical Abstract

INTRODUCTION

Non-alcoholic fatty liver disease (NAFLD) has long been a leading cause of morbidity due to chronic liver disease in Western countries [1,2], and the prevalence of NAFLD is also increasing in Asian countries [3]. Although NAFLD is commonly observed in individuals with obesity, many epidemiologic data showed that NAFLD may also be present in non-obese individuals [4], suggesting that factors other than obesity contribute to the development of NAFLD.
Several studies have reported that the contribution of visceral fat or visceral fat obesity (VFO) to NAFLD is more important than general measures of obesity represented by body mass index (BMI) or total body fat [5-7]. Individuals with NAFLD have more visceral [5,6] or visceral to subcutaneous fat ratio (VSR) [8] than individuals without NAFLD.
Sarcopenia has been shown to be associated with NAFLD and its complications such as non-alcoholic steatohepatitis (NASH) and liver fibrosis independent of obesity [9-11]. However, there have been only few studies about the association between sarcopenia and NAFLD, which reported inconsistent results according to body size adjustment such as height [12,13], weight [9,14], and BMI [10,15].
Myosteatosis refers to ectopic fat infiltration into skeletal muscles including intramyocellular lipid and intermuscular fat [16] and is known to be associated with insulin resistance [17] and muscle dysfunction [18]. We have previously observed that myosteatosis plays an important role in the association between skeletal muscle mass and cardiometabolic diseases [19-21] and studied various measurements of skeletal muscle mass and calculated the indices for myosteatosis obtained by computed tomography (CT) scan at the 3rd lumbar vertebral level [22,23].
These previous studies led us to investigate which body compositional characteristics are associated with non-obese NAFLD. Therefore, the purposes of this study were (1) to confirm that non-obese individuals with NAFLD have more visceral adipose tissue (VAT) and/or higher VSR than non-obese individuals without NAFLD, (2) to investigate whether low skeletal muscle mass and/or degree of myosteatosis is independently associated with non-obese NAFLD, and (3) to compare the prevalence of VFO, sarcopenia, and/or myosteatosis between non-obese individuals with NAFLD and those without.

MATERIALS AND METHODS

Study population

We performed a cross-sectional study on 23,311 individuals aged 20 years or older who underwent abdominal CT scans during routine health examinations at the Health Screening and Promotion Center of Asan Medical Center (Seoul, Korea) between January 2012 and December 2013. Detailed information about this study population, laboratory measurements, anthropometric and body composition measurements, and CT image acquisition, and statistical analysis are provided in Supplementary materials.
The study protocol was approved by the Institutional Review Board of Asan Medical Center (IRB No. 2018-0917), which provided an exemption of written informed consent because this is a retrospective analysis of pre-existing clinical data that were de-identified before the analysis and had therefore been performed in accordance with the ethical standards laid down in the 1964 Declaration of Helsinki and its later amendments.

Definitions of NAFLD and liver fibrosis

NAFLD was diagnosed with hepatic ultrasonography (Ultrasound Systems IU22; Philips, Best, The Netherlands) by expert radiologists. Fatty liver was diagnosed according to characteristic ultrasonographic findings, such as parenchymal brightness, liver-to-kidney contrast, blurring vessels, focal sparing, and narrowing of the lumen of the hepatic veins [24]. Fatty liver severity was classified as non-fatty liver, mild, moderate, or severe fatty liver according to the findings of the bright liver, hepatorenal echo contrast, blurring of vessels, and deep attenuation of the ultrasound signal. Hepatic steatosis was defined by the fatty liver index (FLI): FLI ≥30 [25]. The fibrosis-4 index (FIB-4) was calculated only in individuals with NAFLD, and significant liver fibrosis was defined as FIB-4 >2.67, which has shown good diagnostic performance for detecting significant liver fibrosis [26].

Assessment of skeletal muscle area and quality

Body composition was evaluated with abdominal CT using an automated artificial intelligence software developed using a fully convolutional network segmentation technique. The software automatically selects axial CT slices at the L3 vertebrae inferior endplate level. Then, the selected CT images are automatically segmented to generate boundaries of total abdominal muscle area (TAMA), visceral fat area (VFA), and subcutaneous fat area (SFA). For muscle quality evaluation, the TAMA was divided into three areas according to the CT density as follows: (1) inter/intra-muscular adipose tissue (IMAT, −190 to −30 Hounsfield units; HU), reflecting the apparent fat tissue between muscle groups and muscle fibers, (2) normal attenuation muscle area (NAMA, +30 to +150 HU), reflecting healthy muscle with little intramuscular fat, and (3) low attenuation muscle area (LAMA, −29 to +29 HU), reflecting unhealthy muscles with intramuscular lipid pool [27]. The skeletal muscle area (SMA, −29 to +150 HU) referred to the combined area of the NAMA and LAMA. All measurements were adjusted by the square of the height (m2), weight (kg), or BMI. The NAMA/TAMA index was calculated by dividing the NAMA by TAMA and multiplying by 100.

Definitions of generalized obesity, visceral fat obesity, sarcopenia, and myosteatosis

Obesity (BMI≥25 kg/m2) and non-obesity (BMI<25 kg/m2) were defined according to the Asia-Pacific criteria established by the World Health Organization Western Pacific Region [28]. VFO was defined by the visceral-to-subcutaneous ratio (VSR) (VSR≥1.0 in men; VSR≥0.5 in women) [29]. VSR was calculated by dividing VFA by SFA. Sarcopenia was defined as BMI-adjusted SMA below one standard deviation (SD) from the sex-specific mean value for the healthy young population (20–44 years) [22]. Additional analysis with sarcopenia defined by height-adjusted SMA is shown in the Supplementary data. Myosteatosis was defined by a T-score less than –1.0 of the NAMA/TAMA index (<73 in men; <72 in women) [23].

RESULTS

Clinical characteristics of study participants

A total of 14,400 individuals (7,470 men and 6,930 women) were included in the analysis. The mean age was 53.5±9.0 years. Supplementary Table 1 shows the summary of the clinical characteristics of the study individuals according to sex. Men and women were significantly different in all variables including anthropometric measurements, body composition parameters, lifestyle factors, and prevalence of diabetes and hypertension; therefore, statistical analyses were performed separately in each sex.

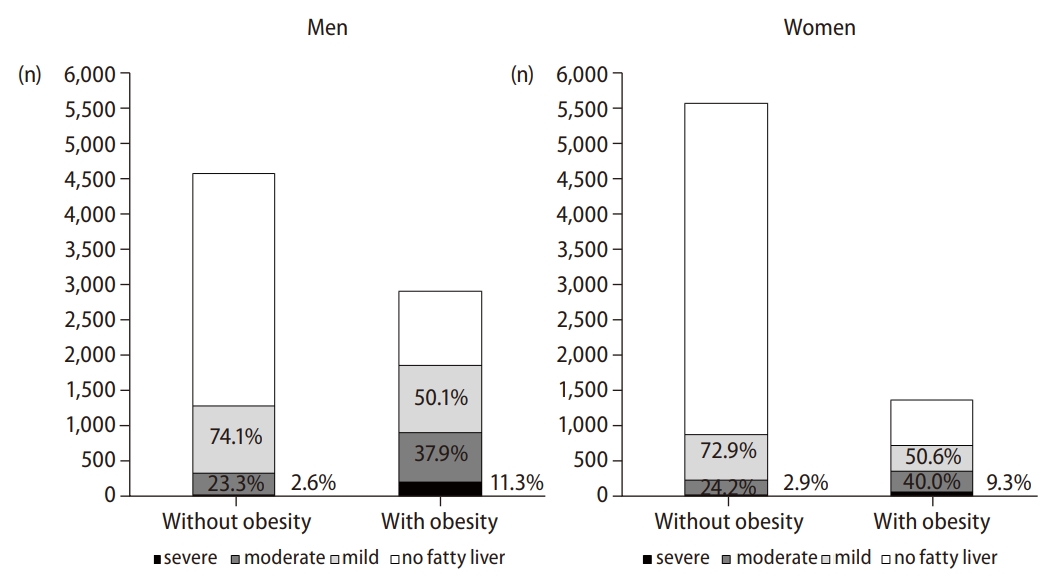
Prevalence of NAFLD according to the presence of obesity

Of the 14,400 individuals, 4,748 (33.0%) had NAFLD (42.0% in men and 23.2% in women). Among 4,748 individuals with NAFLD, 2,161 (45.5%) were non-obese (40.7% in men and 54.8% in women). The prevalence of NAFLD in non-obese and obese individuals was 21.4% (28.0% in men and 15.9% in women) and 60.4% (64.0% in men and 52.9% in women), respectively. When NAFLD was categorized into three subgroups based on the severity by the sonographic findings, 61.1% of cases in the individuals with NAFLD were categorized as mild, 31.7% as moderate, and 7.1% as severe. The number of individuals with NAFLD and the proportion of NAFLD severity according to the presence of obesity are shown in Figure 1.

Comparison of lifestyle factors and laboratory findings according to the presence of NAFLD and obesity

When individuals with NAFLD were compared with those without, those with NAFLD had less favorable lipid and inflammatory profiles, higher insulin resistance, and a higher prevalence of hypertension and diabetes regardless of sex (Supplementary Tables 2 and 3).

Comparison of anthropometric and CT measurements according to the presence of NAFLD and obesity

When individuals with NAFLD were compared with those without, those with NAFLD had higher fat measurements than those without, regardless of the presence of obesity or sex. Among non-obese individuals, the weight- and BMI-adjusted muscle measurements, NAMA (only in women), and NAMA/TAMA index were lower in those with NAFLD than in those without (Tables 1 and 2).

Comparison of hepatic steatosis among four groups and liver fibrosis between obese and non-obese individuals with NAFLD

The FLI was significantly higher in individuals with NAFLD than in those without, regardless of the presence of obesity or sex. Significant fibrosis (FIB-4>2.67) was higher in NAFLD with obesity than in those without obesity only in women, but median FIB-4 was not different between the two groups (Tables 1 and 2).

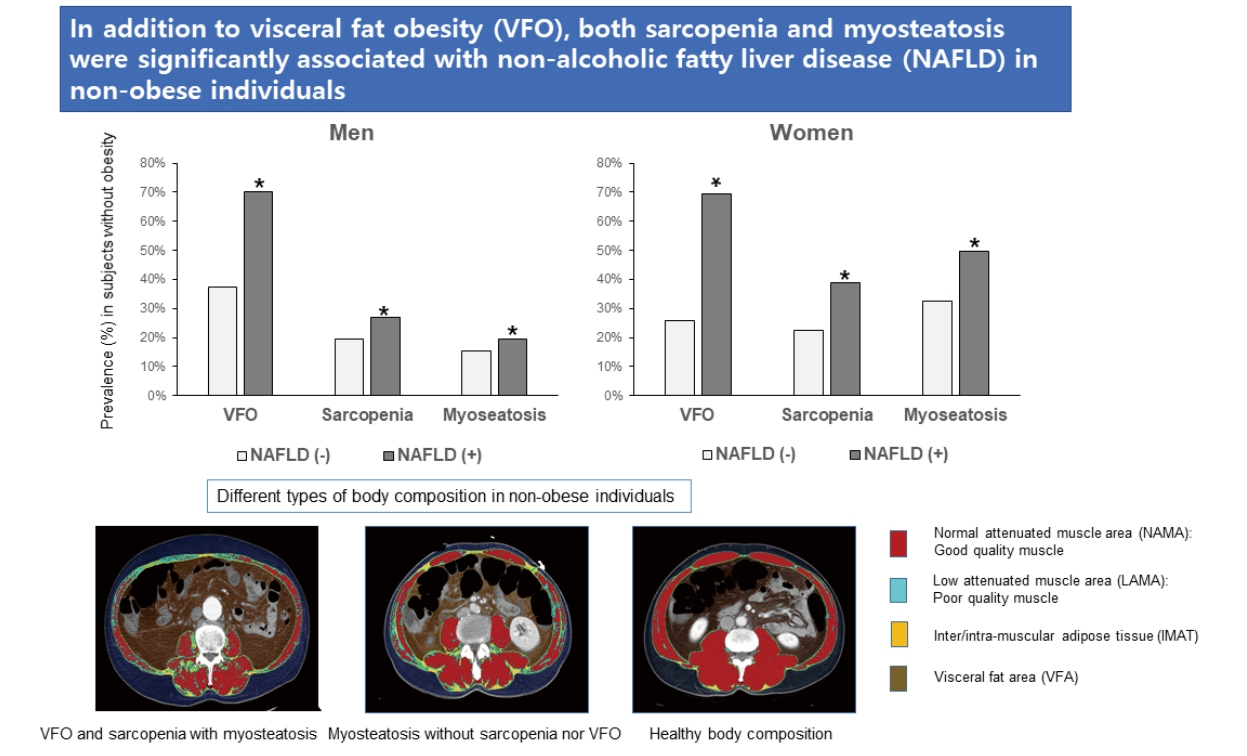
Prevalence of VFO and sarcopenia or myosteatosis in individuals with NAFLD without obesity

When non-obese individuals with NAFLD were compared with those without NAFLD, the prevalence of VFO (69.9% vs. 30.5% in total, P<0.001), sarcopenia (31.8 % vs. 21.3% in total, P<0.001), and myosteastosis (31.7% vs. 25.3% in total, P<0.001) were higher in those with NAFLD than in those without (Fig. 2). A prevalence analysis for each adverse body composition was performed and showed similar results in NAFLD defined by FLI≥30 (Supplementary Fig. 1). However, the prevalence of sarcopenia defined by height-adjusted SMA was lower in individuals with NAFLD than in those without (Supplementary Fig. 2).

Regression analysis according to the presence of NAFLD and obesity

To assess the roles of sarcopenia or myosteatosis and VFO on the risk of NAFLD, we performed a logistic regression analysis (Table 3). The effect of sarcopenia or myosteatosis was separately analyzed to elucidate the clinical significance of each variable. Sarcopenia or myosteatosis adjusted with age, regular exercise, VFO, diabetes, high C-reactive protein (CRP) level, and menopause (only in women) was significantly associated with NAFLD only in non-obese individuals (Table 3). However, after additional adjustment with triglyceride (TG) level, high-density lipoprotein (HDL)-cholesterol, and hypertension, these associations remained significant only in non-obese women (Supplementary Table 4). In all subgroups divided according to sex and the presence of obesity, VFO was significantly associated with NAFLD with the highest odds ratios (Table 3). In addition, we found that sarcopenia with myosteatosis was significantly associated with an increased risk for NAFLD, especially in non-obese women (Table 3). A regression analysis of NAFLD defined by FLI is also shown in Supplementary Table 5.

DISCUSSION

In this study involving 14,400 individuals who underwent abdominal CT scans during routine health examinations, we found that the prevalence of NAFLD was 21.4% in non-obese individuals. This prevalence is similar to the global prevalence of NAFLD in the non-obese population (20%) but higher than those reported in previous Korean studies (7.3–18.3%) [30]. Indeed, this prevalence is much lower than the 60.4% NAFLD prevalence in individuals with obesity; however, 45.5% of NAFLD cases were found in non-obese individuals because the proportion of non-obese individuals was 70.3% of the total study population.
When we analyzed the body composition such as different fat and muscle areas by abdominal CT scan, various fat measurements such as SFA, VFA, and its adjusted indices, VSR, and IMAT were higher in both obese and non-obese individuals with NAFLD than in those without NAFLD. The NAMA (only in women) and NAMA/TAMA index, which reflect good quality muscle without myosteatosis, were lower in non-obese individuals with NAFLD than in those without. Regression analysis showed that sarcopenia and/or myosteatosis was associated with NAFLD; however, VFO was associated with a much higher risk of NAFLD in non-obese individuals. We also found that VFO, sarcopenia, and/or myosteatosis were more prevalent in non-obese individuals with NAFLD than in those without NAFLD.
Although VAT accounts for only 7% to 15% of the total body fat, it plays a more important role than other adipose depots in the pathogenesis of insulin resistance [31]. Portal venous blood contains high levels of free fatty acids and cytokines secreted by VAT, which is thought to drive the development of NAFLD [32]. Therefore, many studies showed that VAT is closely related to NAFLD [5,33,34], even in non-obese individuals with NAFLD [5,6,33,35]. When the subcutaneous adipose tissue (SAT), which may act as a reservoir for metabolically neutral surplus lipid storage, becomes saturated, fat deposits occur in other areas such as VAT and hepatocytes [31,32]. Therefore, we used VSR in defining VFO in order to consider the different effects of VAT and SAT on NAFLD. This is consistent with a previous Korean study in which higher VSR was associated with an increased risk of NAFLD in both obese and non-obese individuals [8].
Sarcopenia has been shown to be associated with NAFLD and its complications such as NASH and liver fibrosis, independent of obesity [9,10,36]. Insulin resistance can be a major pathophysiologic link between sarcopenia and NAFLD because the muscle is the primary organ responsible for insulin-mediated glucose disposal; hence, a decreased muscle mass may cause impaired glucose metabolism [17,37]. Our current study also showed that the presence of sarcopenia was significantly associated with a higher risk for NAFLD [14]. This result is similar to previous studies in which sarcopenia defined by BMI-adjusted abdominal muscle area was significantly associated with the risk of NAFLD [15,38]. However, a recent study reported that there was no significant association between sarcopenia defined by height-adjusted abdominal muscle area and NASH [13,39]. This is similar to the longstanding disagreements about whether higher skeletal muscle mass is associated with metabolic healthy or unhealthy phenotype, and we suggested that this inconsistency was due to differences in the adjustments for muscle mass [19]. Determining the ideal method of adjustment for muscle mass among height, weight, and BMI has long been a matter of debate in the discussion about sarcopenia, especially in Asian populations, because adjustment with height could lead to an underestimation of sarcopenia, especially in women [40]. Previousstudies on age-related changes in muscle mass [22] or quality of lumbar skeletal muscle area [23] compared the prevalence of sarcopenia or myosteatosis with height-, weight-, or BMI-adjusted indices and showed that BMI-adjusted index may be a more reasonable index for diagnosing sarcopenia and myosteatosis. Furthermore, the Foundation for the National Institutes of Health Sarcopenia Project recommended using appendicular skeletal muscle (ASM)/BMI for the diagnosis of sarcopenia considering that BMI adjustment is most strongly and directly correlated with weakness and slowness based on large population-based studies [41].
We observed that myosteatosis, represented by a lower NAMA/TAMA index, was significantly associated with non-obese NAFLD; however, its contribution was relatively smaller than that of VFO. In our previous study, a higher NAMA/TAMA index, which is an index for good quality muscle, was negatively associated with NAFLD and fibrosis indices [42]. This finding is consistent with a previous study, which showed that among non-obese women, myosteatosis was more common in those with NAFLD than in those without NAFLD [12]. Other studies reported similar results in which muscle fat content, as measured by muscle attenuation, was associated with biopsy-proven NASH [13,39] and fibrosis [43] or its progression [39]. While height-adjusted muscle mass measured by CT scan was associated with fibrosis in one study [43], other studies did not find such an association [13,39].
While insulin resistance may be a major pathophysiologic link for the association between VFO, sarcopenia, or myosteatosis and NAFLD without obesity, oxidative stress occurring as the result of chronic low-grade inflammation could be another important factor [17]. We found that hsCRP was higher in non-obese individuals with NAFLD than in those without NAFLD regardless of sex, although hsCRP was not independently associated with NAFLD without obesity in regression analysis.
For the management of non-obese individuals with NAFLD, many clinical observations suggest that weight reduction or increased physical activity may lead to improvement of hepatic steatosis and fibrosis because weight gain, even within a non-obese range, was associated with the development of NAFLD [44-46]. However, our study suggests that improvement of body composition (e.g., reduction of VAT, increase of skeletal muscle mass, and improvement of myosteatosis) may be more important than simple weight reduction in managing NAFLD in non-obese individuals. Therefore, proper resistance exercise in addition to aerobic exercise or physical activity could be recommended as lifestyle modifications for non-obese individuals with NAFLD. To develop a standardized recommendation, prospective controlled studies for proper exercise protocol are needed.
Our study is limited in that the study population was composed of those who visited one health screening center for regular health examinations, which is prone to selection bias and limited generalizability. Nevertheless, a previous study [47] from this population showed that the patterns of body composition according to age and sex were similar to the nationally representative data from the Fourth Korean National Health and Nutrition Examination Surveys [48]. Second, the cross-sectional nature of this study did not allow us to investigate the causal relationships between these measurements and NAFLD. Third, we could only assess whether anti-diabetic medications were being taken through a questionnaire survey. In most cases, it is not possible to determine the type of medication being used. However, the proportion of patients using TZD is very low among those who can be identified. Therefore, the impact on the overall result is considered insignificant. Lastly, we diagnosed NAFLD with ultrasonographic examination instead of liver biopsy, which is the gold standard method. Therefore, we performed an additional analysis with the generally accepted surrogate markers of hepatic steatosis and fibrosis.
Nevertheless, our study has several strengths including large sample size, thorough measurements, and rigorously controlled data after the exclusion of health conditions that may affect body composition such as cancer or hyperthyroidism. In addition to measurements of VAT and SAT, measurements of skeletal muscle mass and myosteatosis could contribute to improving our understanding of the association between NAFLD and body compositional characteristics.
In conclusion, this study showed that VFO, sarcopenia, and/or myosteatosis were significantly associated with non-obese NAFLD. We also found that although VFO is the most important risk factor, both sarcopenia and myosteatosis may also be meaningful risk factors for non-obese NAFLD. These results suggest that improvement of body composition, including reducing VAT, increasing skeletal muscle mass, and improving myosteatosis, should be considered for managing NAFLD in non-obese individuals.

ACKNOWLEDGMENTS

We thank Dr. Joon Seo Lim from the Scientific Publications Team at Asan Medical Center for his editorial assistance in preparing this manuscript.

FOOTNOTES

Authors’ contribution
HK Kim: designed the research, performed the statistical analysis, interpreted the results, wrote the manuscript, and took primary responsibility for the final content; SJ Bae: interpreted the results and wrote the manuscript; MJ Lee, EH Kim, J Choe, YK Cho, CH Jung, and WJ Lee: discussed the results and reviewed the final manuscript; HS Kim: collected data and reviewed the final manuscript; HN Park: performed critical revision; all authorsread and approved the final version of the manuscript.
Conflicts of Interest
The authors have no conflictsto disclose.

Supplementary materials

Supplementary material is available at Clinical and Molecular Hepatology website (http://www.e-cmh.org).
Supplemental Materials
METHODS
cmh-2023-0035-Supplementary-Methods-1.pdf
Supplementary Table 1.
Baseline participant characteristics
cmh-2023-0035-Supplementary-Table-1.pdf
Supplementary Table 2.
Comparison of lifestyle factors and laboratory data according to the presence of NAFLD and obesity in men
cmh-2023-0035-Supplementary-Table-2.pdf
Supplementary Table 3.
Comparison of lifestyle factors and laboratory data according to the presence of NAFLD and obesity in women
cmh-2023-0035-Supplementary-Table-3.pdf
Supplementary Table 4.
Odds ratios (OR) with 95% confidence intervals (CIs) for NAFLD according to the presence of obesity (with additional adjustment)
cmh-2023-0035-Supplementary-Table-4.pdf
Supplementary Table 5.
Odds ratios (OR) with 95% confidence intervals (CIs) for NAFLD defined by the FLI according to the presence of obesity in men and women
cmh-2023-0035-Supplementary-Table-5.pdf
Supplementary Figure 1.
Prevalence of Visceral fat obesity (VFO), sarcopenia, and myosteatosis in NAFLD defined by ultrasonography (US) and the fatty liver index (FLI). Asterisk (*) denotes comparison between controls and NAFLD without obesity (**P<0.001 and *P<0.05 by chisquared test). NAFLD, non-alcoholic fatty liver disease.
cmh-2023-0035-Supplementary-Fig-1.pdf
Supplementary Figure 2.
Prevalence of Visceral fat obesity (VFO), sarcopenia (defined by BMI- or height-adjusted SMA), and myosteatosis in non-obese controls and individuals with NAFLD. Asterisk (*) denotes comparison between controls and NAFLD without obesity (**P<0.001 and *P<0.05 by chi-squared test). NAFLD, non-alcoholic fatty liver disease; SMA,skeletal muscle area; BMI, body massindex.
cmh-2023-0035-Supplementary-Fig-2.pdf

Figure 1.
Number of NAFLD cases according to the presence of obesity in men and women. Percentagesshow the prevalence of the different severities of NAFLD among individuals with NAFLD. NAFLD, non-alcoholic fatty liver disease.

cmh-2023-0035f1.jpg
Figure 2.
Prevalence of visceral fat obesity (VFO), sarcopenia, and myosteatosisin controls and non-alcoholic fatty liver disease (NAFLD) without obesity in men and women. Asterisk (*) denotes the comparison between controls and NAFLD without obesity (*P<0.001 by chi-squared test).

cmh-2023-0035f2.jpg

cmh-2023-0035f3.jpg
Table 1.
Comparison of CT measurements between those with NAFLD and those without according to the presence of obesity in men
Variable Without obesity
With obesity
No NAFLD NAFLD P-value No NAFLD NAFLD P-value
Number (%) 3,286 (44.0) 1,278 (17.1) 1,046 (14.0) 1,860 (24.8)
Age (yr) 54.2±9.4 54.1±8.4 0.650 54.0±9.4 52.3±9.0** <0.001
Height (cm) 170.4±5.7 170.3±5.5 0.660 170.4±5.9 170.9±5.8* 0.026
Weight (kg) 65.0±6.7 68.2±5.5 <0.001 76.9±7.0** 80.3±9.1** <0.001
BMI (kg/m2) 22.4±1.7 23.5±1.1 <0.001 26.5±1.4** 27.5±2.2** <0.001
Waist (cm) 81.6±5.7 85.9±4.2 <0.001 91.2±5.3** 94.6±6.3** <0.001
PBF (%) 18.5±4.2 21.6±3.5 <0.001 23.9±4.1* 25.9±4.5** <0.001
ASM (kg) 22.6±2.7 22.8±2.5 0.170 24.8±2.7** 25.2±3.0** <0.001
ASM/height (kg/m2) 7.77±0.59 7.82±0.49 0.005 8.53±0.51** 8.62±0.59** <0.001
ASM/weight (%) 34.8±2.4 33.4±1.9 <0.001 32.3±1.8** 31.5±2.0** <0.001
ASM/BMI 1.01±0.12 0.97±0.10 <0.001 0.94±0.10** 0.92±0.10** <0.001
Fat measurements by CT
Subcutaneous fat area (cm2) 97.6±34.1 113.9±26.8 <0.001 145.4±41.3** 161.6±53.8** <0.001
VFA (cm2) 89.5 (57.4, 119.6) 136.9 (112.2, 164.3) <0.001 149.8 (119.7, 184.5)** 182.6 (153.4, 221.8)** <0.001
VFA/height (cm2/m2) 30.5 (19.7, 41.8) 46.9 (38.5, 56.9) <0.001 51.6 (41.1, 63.8)** 63.2 (52.4, 76.0)** <0.001
VFA/weight (cm2/kg) 1.36 (0.91, 1.80) 1.99 (1.64, 2.41) <0.001 1.96 (1.56, 2.41) 2.31 (1.95, 2.76)** <0.001
VFA/BMI 3.95 (2.63, 5.19) 5.79 (4.80, 6.97) <0.001 5.67 (4.53, 7.02) 6.74 (5.70, 7.96)** <0.001
VSR 0.88 (0.65, 1.16) 1.19 (0.96, 1.53) <0.001 1.06 (0.81, 1.36)** 1.20 (0.93, 1.53) <0.001
Muscle measurements by CT
TAMA (cm2) 156.9±18.7 160.4±16.1 <0.001 178.9±19.8** 183.7±20.7** <0.001
TAMA/height (cm2/m2) 54.1±6.0 55.3±5.2 <0.001 61.6±6.0** 62.9±6.5** <0.001
TAMA/weight (cm2/kg) 2.42±0.22 2.38±0.19 <0.001 2.33±0.22* 2.30±0.19* <0.001
TAMA/BMI 7.02±0.69 6.83±0.62 <0.001 6.76±0.69* 6.70±0.66* 0.016
SMA (cm2) 152.4±18.5 155.3±16.1 <0.001 172.5±20.0** 176.8±20.2** <0.001
SMA/height (cm2/m2) 52.5±6.0 53.6±5.2 <0.001 59.4±6.2** 60.5±6.4** <0.001
SMA/weight (cm2/kg) 2.35±0.22 2.28±0.19 <0.001 2.25±0.23** 2.21±0.22* <0.001
SMA/BMI 6.82±0.71 6.62±0.62 <0.001 6.52±0.71* 2.22±0.22* 0.009
NAMA (cm2) 125.5±19.6 126.1±18.3 0.370 135.0±22.7** 138.3±22.1** <0.001
NAMA/height (cm2/m2) 43.2±6.5 43.5±6.1 0.250 46.5±7.6** 47.4±7.4** 0.003
NAMA/weight (cm2/kg) 1.94±0.28 1.85±0.25 <0.001 1.76±0.29** 1.73±0.29** 0.000
NAMA/BMI 5.62±0.86 5.37±0.76 <0.001 5.11±0.86** 5.06±0.84** 0.120
IMAT (cm2) 3.5 (2.2, 5.6) 4.0 (2.6, 6.4) <0.001 5.1 (3.3, 8.2)** 5.3 (3.5, 8.5)** 0.130
LAMA (cm2) 25.8 (20.6, 31.8) 28.0 (23.3, 34.0) <0.001 35.6 (29.1, 43.5)** 36.3 (29.7, 44.5)** 0.068
NAMA/TAMA index 79.6±7.1 78.4±6.8 <0.001 75.3±8.1** 75.2±8.3** 0.850
FLI 17.8±12.7 31.6±15.7 <0.001 41.3±18.2** 56.6±19.4** <0.001
FIB-4 - 1.18 (0.90, 1.50) - 1.15 (0.89, 1.48) 0.114
FIB-4 >2.67 (%) - 2.0 - 1.8 0.791

Values are presented as mean±standard deviation or median (interquartile range).

NAFLD, non-alcoholic fatty liver disease; BMI, body mass index; PBF, percent body fat; ASM, appendicular skeletal muscle mass; CT, computed tomography; VFA, visceral fat area; VSR, visceral to subcutaneous fat ratio; TAMA, total abdominal muscle area; SMA, skeletal muscle area; IMAT, inter/intra-muscular adipose tissue; LAMA, low attenuation muscle area; NAMA, normal attenuation muscle area; NAMA,TAMA index=(NAMA/TAMA)×100; FLI, fatty liver index; FIB-4, fibrosis-4 index.

P-values represent the comparison between the groups with and without NAFLD by paired t-test or Mann–Whitney U-test for continuous variables and by chi-square test for categorical variables. Asterisk (*) denotes comparison vs. NAFLD without obesity group (*P<0.05; **P<0.001).

Table 2.
Comparison of CT measurements between those with NAFLD and those without according to the presence of obesity in women
Variable Without obesity
With obesity
No NAFLD NAFLD P-value No NAFLD NAFLD P-value
Number (%) 4,673 (67.4) 883 (12.7) 647 (9.3) 727 (10.5)
Age (yr) 52.0±8.5 55.8±8.1 <0.001 55.8±9.4 56.5±8.5 0.170
Height (cm) 158.9±5.2 157.4±5.5 <0.001 156.7±5.4* 156.5±5.2* 0.900
Weight (kg) 53.9.±5.5 56.7±5.1 <0.001 65.7±6.1** 68.1±7.5** <0.001
BMI (kg/m2) 21.4±1.9 22.9±1.5 <0.001 26.7±1.6** 27.7±2.5** <0.001
Waist (cm) 75.3±6.2 80.6±5.1 <0.001 87.8±5.6** 91.2±6.6** <0.001
PBF (%) 27.0±5.3 30.6±4.3 <0.001 35.9±4.1** 37.4±4.5** <0.001
ASM (kg) 15.8±1.9 15.8±1.9 0.830 17.1±2.1** 17.3±2.2** 0.052
ASM/height (kg/m2) 6.24±0.51 6.33±0.48 <0.001 6.94±0.54** 7.04±0.57** 0.002
ASM/weight (%) 29.3±2.5 27.8±2.0 <0.001 26.0±2.0** 25.5±2.0** <0.001
ASM/BMI 0.74±0.10 0.69±0.08 <0.001 0.64±0.08** 0.63±0.08** 0.001
Fat measurements by CT
Subcutaneous fat area (cm2) 134.4±39.9 151.0±37.3 <0.001 208.1±48.6** 213.9±55.1** 0.041
VFA (cm2) 50.6 (32.1, 73.3) 94.6 (73.7, 118.9) <0.001 102.6 (81.0, 129.9)** 139.0 (114.5, 161.9)** <0.001
VFA/height (cm2/m2) 20.1 (12.6, 29.3) 38.2 (30.3, 47.5) <0.001 41.9 (32.7, 53.2)** 56.8 (46.0, 67.1)** <0.001
VFA/weight (cm2/kg) 0.93 (0.61, 1.32) 1.66 (1.32, 2.05) <0.001 1.57 (1.23, 2.01)* 2.04 (1.70, 2.41)** <0.001
VFA/BMI 2.35 (1.57, 3.29) 4.14 (3.28, 5.08) <0.001 3.86 (3.08, 4.86)* 4.95 (4.21, 5.87)** <0.001
VSR 0.37 (0.27, 0.50) 0.63 (0.47, 0.83) <0.001 0.51 (0.37, 0.68) ** 0.67 (0.52, 0.84)* <0.001
Muscle measurements by CT
TAMA (cm2) 109.3±12.2 111.6±12.1 <0.001 121.9±13.5** 126.1±14.5** <0.001
TAMA/height (cm2/m2) 43.3±4.7 45.0±4.6 <0.001 49.7±5.2** 51.4±5.6** <0.001
TAMA/weight (cm2/kg) 2.03±0.19 1.97±0.18 <0.001 1.86±0.18** 1.86±0.18** 0.890
TAMA/BMI 5.14±0.56 4.89±050 <0.001 4.56±0.48** 4.56±0.48** 0.870
SMA (cm2) 104.6±11.8 105.8±11.9 0.006 114.0±13.5** 117.8±14.1** <0.001
SMA/height (cm2/m2) 41.5±4.5 42.7±4.5 <0.001 46.4±5.2** 51.4±5.6** <0.001
SMA/weight (cm2/kg) 1.95±0.20 1.87±0.18 <0.001 1.74±0.90** 1.73±0.18** 0.810
SMA/BMI 4.92±0.58 4.64±0.51 <0.001 4.27±0.49** 4.26±0.50** 0.820
NAMA (cm2) 81.5±12.9 79.2±13.1 <0.001 80.0±15.9 82.5±16.4** 0.005
NAMA/height (cm2/m2) 32.3±4.9 31.9±5.1 0.070 32.6±6.3* 33.6±6.4* 0.004
NAMA/weight (cm2/kg) 1.52±0.25 1.40±0.23 <0.001 1.22±0.24** 1.22±0.24 ** 0.780
NAMA/BMI 3.84±0.69 3.47±0.59 <0.001 3.00±0.61** 2.99±0.63** 0.770
IMAT (cm2) 3.7 (2.3, 5.8) 4.6 (3.2, 7.1) <0.001 6.4 (4.2, 10.3)** 6.5 (4.3, 10.8)** 0.460
LAMA (cm2) 22.1 (17.8, 27.5) 25.4 (21.1, 31.2) <0.001 32.9 (26.9, 39.8)** 33.4 (28.1, 41.3)** 0.087
NAMA/TAMA index 74.6±8.5 71.0±8.7 <0.001 65.6±10.4** 65.4±10.7** 0.800
FLI 8.3±7.6 18.8±12.1 <0.001 28.3±15.4** 44.1±19.5** <0.001
FIB-4 - 1.16 (0.92, 1.44) - 1.14 (0.88, 1.50) 0.845
FIB-4 >2.67 (%) - 0.8 - 2.2 0.020

Values are presented as mean±standard deviation or median (interquartile range).

NAFLD, non-alcoholic fatty liver disease; BMI, body mass index; PBF, percent body fat; ASM, appendicular skeletal muscle mass; CT, computed tomography; VFA, visceral fat area; VSR, visceral to subcutaneous fat ratio; TAMA, total abdominal muscle area; SMA, skeletal muscle area; IMAT, inter/intra-muscular adipose tissue; LAMA, low attenuation muscle area; NAMA, normal attenuation muscle area; NAMA,TAMA index=(NAMA/TAMA)×100; FLI, fatty liver index; FIB-4, fibrosis-4 index.

P-values represent the comparison between the groups with and without NAFLD by paired t-test or Mann–Whitney U-test for continuous variables and by chi-square test for categorical variables. Asterisk (*) denotes comparison vs. NAFLD without obesity group (*P<0.05; **P<0.001).

Table 3.
Odds ratios (OR) with 95% confidence intervals (CIs) for NAFLD according to the presence of obesity
Model Without obesity
With obesity
OR 95% CI P-value OR 95% CI P-value
For sarcopenia
Men Sarcopenia 1.41 1.19–1.67 <0.001 1.16 0.97–1.38 0.100
VFO 3.97 3.43–4.59 <0.001 2.00 1.69–2.37 <0.001
Diabetes 2.14 1.74–2.64 <0.001 2.75 2.14–3.54 <0.001
High CRP 1.18 0.95–1.46 0.13 1.63 1.28–2.06 <0.001
Women Sarcopenia 1.59 1.40–1.90 <0.001 1.07 0.82–1.39 0.620
VFO 5.43 4.53–6.42 <0.001 3.33 2.58–4.30 <0.001
Diabetes 3.93 3.01–5.14 <0.001 3.51 2.39–5.15 <0.001
High CRP 1.04 0.79–1.39 0.770 2.11 1.55–2.88 <0.001
Menopause 1.73 1.28–2.33 <0.001 1.61 1.04–2.49 0.031
For myosteatosis
Men Myosteatosis 1.24 1.02–1.50 0.028 1.06 0.89–1.26 0.500
VFO 3.98 3.44–4.60 <0.001 1.99 1.68–2.35 <0.001
Diabetes 2.18 1.77–2.68 <0.001 2.75 2.14–3.54 <0.001
High CRP 1.18 0.95–1.46 0.130 1.64 1.29–2.08 <0.001
Women Myosteatosis 1.23 1.04–1.46 0.017 0.92 0.70–1.20 0.540
VFO 5.33 4.51–6.31 <0.001 3.30 2.56–4.26 <0.001
Diabetes 3.97 3.04–5.18 <0.001 3.48 2.37–5.10 <0.001
High CRP 1.06 0.80–1.41 0.690 2.13 1.57–2.91 <0.001
Menopause 1.70 1.26–2.29 <0.001 1.63 1.05–2.91 0.028
For sarcopenia with myosteatosis
Men Sarcopenia with myosteatosis 1.35 0.94–1.94 0.106 1.16 0.86–1.56 0.338
VFO 3.98 3.44–4.60 <0.001 1.99 1.68–2.36 <0.001
Diabetes 2.14 1.76–2.68 <0.001 2.75 2.13–3.54 <0.001
High CRP 1.18 0.95–1.46 0.129 1.63 1.29–2.07 <0.001
Women Sarcopenia with myosteatosis 1.44 1.05–1.90 0.028 1.02 0.72–1.44 0.926
VFO 5.36 4.52–6.34 <0.001 3.44 2.59–4.31 <0.001
Diabetes 3.99 3.05–5.21 <0.001 3.50 2.38–5.14 <0.001
High CRP 1.06 0.80–1.41 0.696 2.10 1.54–2.87 <0.001
Menopause 1.66 1.30–2.11 <0.001 1.70 1.18–2.46 0.005

NAFLD, non-alcoholic fatty liver disease; VFO, visceral fat obesity; hsCRP, high sensitive C-reactive protein.

Adjusted for age, regular aerobic exercise, regular resistance exercise, VFO, diabetes, high CRP, menopausal status (only in women), and sarcopenia or myosteatosis.

Abbreviations

ASM
appendicular skeletal muscle mass
BMI
body mass index
BP
blood pressure
CRP
C-reactive protein
CT
computed tomography
FNIH
Foundation for the National Institutes of Health
IMAT
inter/intra-muscular adipose tissue
LAMA
low attenuation muscle area
NAMA
normal attenuation muscle area
NAFLD
non-alcoholic fatty liver disease
NASH
non-alcoholic steatohepatitis
OR
odds ratio
PBF
percent body fat
SMA
skeletal muscle area
TAMA
total abdominal muscle area
VFA
visceral fat area
VFO
visceral fat obesity
VSR
visceral to subcutaneous fat ratio

REFERENCES

1. Younossi ZM, Koenig AB, Abdelatif D, Fazel Y, Henry L, Wymer M. Global epidemiology of nonalcoholic fatty liver disease-Meta-analytic assessment of prevalence, incidence, and outcomes. Hepatology 2016;64:73-84.
crossref pmid
2. Konyn P, Ahmed A, Kim D. Causes and risk profiles of mortality among individuals with nonalcoholic fatty liver disease. Clin Mol Hepatol 2023;29(Suppl):S43-S57.
crossref pmid pmc pdf
3. Li J, Zou B, Yeo YH, Feng Y, Xie X, Lee DH, et al. Prevalence, incidence, and outcome of non-alcoholic fatty liver disease in Asia, 1999-2019: a systematic review and meta-analysis. Lancet Gastroenterol Hepatol 2019;4:389-398.
crossref pmid
4. Kim D, Kim WR. Nonobese fatty liver disease. Clin Gastroenterol Hepatol 2017;15:474-485.
crossref pmid
5. Ha Y, Seo N, Shim JH, Kim SY, Park JA, Han S, et al. Intimate association of visceral obesity with non-alcoholic fatty liver disease in healthy Asians: A case-control study. J Gastroenterol Hepatol 2015;30:1666-1672.
crossref pmid pdf
6. Lee S, Kim KW, Lee J, Park T, Khang S, Jeong H, et al. Visceral adiposity as a risk factor for lean non-alcoholic fatty liver disease in potential living liver donors. J Gastroenterol Hepatol 2021;36:3212-3218.
crossref pmid pdf
7. Ko E, Yoon EL, Jun DW. Risk factors in nonalcoholic fatty liver disease. Clin Mol Hepatol 2023;29(Suppl):S79-S85.
crossref pmid pmc pdf
8. Jung CH, Rhee EJ, Kwon H, Chang Y, Ryu S, Lee WY. Visceral-to-subcutaneous abdominal fat ratio is associated with nonalcoholic fatty liver disease and liver fibrosis. Endocrinol Metab (Seoul) 2020;35:165-176.
crossref pmid pmc pdf
9. Koo BK, Kim D, Joo SK, Kim JH, Chang MS, Kim BG, et al. Sarcopenia is an independent risk factor for non-alcoholic steatohepatitis and significant fibrosis. J Hepatol 2017;66:123-131.
crossref pmid
10. Lee YH, Kim SU, Song K, Park JY, Kim DY, Ahn SH, et al. Sarcopenia is associated with significant liver fibrosis independently of obesity and insulin resistance in nonalcoholic fatty liver disease: Nationwide surveys(KNHANES 2008-2011). Hepatology 2016;63:776-786.
crossref pmid pdf
11. Chun HS, Lee M, Lee HA, Lee JY, Kim S, Jung YJ, et al. Risk stratification for sarcopenic obesity in subjects with nonalcoholic fatty liver disease. Clin Gastroenterol Hepatol 2022 Dec 1;doi:10.1016/j.cgh.2022.11.031.
crossref pmid
12. Shida T, Oshida N, Suzuki H, Okada K, Watahiki T, Oh S, et al. Clinical and anthropometric characteristics of non-obese non-alcoholic fatty liver disease subjects in Japan. Hepatol Res 2020;50:1032-1046.
crossref pmid pdf
13. Nachit M, Kwanten WJ, Thissen JP, Op De Beeck B, Van Gaal L, et al. Muscle fat content is strongly associated with NASH: A longitudinal study in patients with morbid obesity. J Hepatol 2021;75:292-301.
crossref pmid
14. Lee MJ, Kim EH, Bae SJ, Kim GA, Park SW, Choe J, et al. Age-related decrease in skeletal muscle mass is an independent risk factor for incident nonalcoholic fatty liver disease: A 10-year retrospective cohortstudy. Gut Liver 2019;13:67-76.
crossref pmid pmc
15. Choe EK, Kang HY, Park B, Yang JI, Kim JS. The association between nonalcoholic fatty liver disease and CT-measured skeletal muscle mass. J Clin Med 2018;7:310.
crossref pmid pmc
16. Addison O, Marcus RL, Lastayo PC, Ryan AS. Intermuscular fat: a review of the consequences and causes. Int J Endocrinol 2014;2014:309570.
crossref pmid pmc pdf
17. Shulman GI. Ectopic fat in insulin resistance, dyslipidemia, and cardiometabolic disease. N Engl J Med 2014;371:1131-1141.
crossref pmid
18. Addison O, Young P, Inacio M, Bair WN, Prettyman MG, Beamer BA, et al. Hip but not thigh intramuscular adipose tissue is associated with poor balance and increased temporal gait variability in older adults. Curr Aging Sci 2014;7:137-143.
crossref pmid pmc
19. Kim HK, Lee MJ, Kim EH, Bae SJ, Kim KW, Kim CH. Comparison of muscle mass and quality between metabolically healthy and unhealthy phenotypes. Obesity (Silver Spring) 2021;29:1375-1386.
crossref pmid pdf
20. Lee MJ, Kim HK, Kim EH, Bae SJ, Kim KW, Kim MJ, et al. Association between muscle quality measured by abdominal computed tomography and subclinical coronary atherosclerosis. Arterioscler Thromb Vasc Biol 2021;41:e128-e140.
crossref pmid
21. Kim HK, Kim CH. Quality matters as much as quantity of skeletal muscle: Clinical implications of myosteatosisin cardiometabolic health. Endocrinol Metab (Seoul) 2021;36:1161-1174.
crossref pmid pmc pdf
22. Kim EH, Kim KW, Shin Y, Lee J, Ko Y, Kim YJ, et al. Reference data and t-scores of lumbar skeletal muscle area and its skeletal muscle indices measured by CT scan in a healthy Korean population. J Gerontol A Biol Sci Med Sci 2021;76:265-271.
crossref pmid pdf
23. Kim HK, Kim KW, Kim EH, Lee MJ, Bae SJ, Ko Y, et al. Age-related changes in muscle quality and development of diagnostic cutoff points for myosteatosis in lumbar skeletal muscles measured by CT scan. Clin Nutr 2021;40:4022-4028.
crossref pmid
24. Angulo P. Nonalcoholic fatty liver disease. N Engl J Med 2002;346:1221-1231.
crossref
25. Bedogni G, Bellentani S, Miglioli L, Masutti F, Passalacqua M, Castiglione A, et al. The fatty liver index: a simple and accurate predictor of hepatic steatosis in the general population. BMC Gastroenterol 2006;6:33.
crossref pmid pmc pdf
26. Sterling RK, Lissen E, Clumeck N, Sola R, Correa MC, Montaner J, et al. Development of a simple noninvasive index to predict significant fibrosis in patients with HIV/HCV coinfection. Hepatology 2006;43:1317-1325.
crossref pmid
27. Aubrey J, Esfandiari N, Baracos VE, Buteau FA, Frenette J, Putman CT, et al. Measurement of skeletal muscle radiation attenuation and basis of its biological variation. Acta Physiol (Oxf) 2014;210:489-497.
crossref pmid pmc pdf
28. WHO Expert Consultation. Appropriate body-mass index for Asian populations and its implications for policy and intervention strategies. Lancet 2004;363:157-163.
crossref pmid
29. Kim EH, Kim HK, Lee MJ, Bae SJ, Choe J, Jung CH, et al. Sex differences of visceral fat area and visceral-to-subcutaneous fat ratio for the risk of incident type 2 diabetes mellitus. Diabetes Metab J 2022;46:486-498.
crossref pmid pmc pdf
30. Ye Q, Zou B, Yeo YH, Li J, Huang DQ, Wu Y, et al. Global prevalence, incidence, and outcomes of non-obese or lean non-alcoholic fatty liver disease: a systematic review and meta-analysis. Lancet Gastroenterol Hepatol 2020;5:739-752.
crossref pmid
31. Neeland IJ, Ross R, Després JP, Matsuzawa Y, Yamashita S, Shai I, et al. Visceral and ectopic fat, atherosclerosis, and cardiometabolic disease: a position statement. Lancet Diabetes Endocrinol 2019;7:715-725.
crossref pmid
32. Després JP. Body fat distribution and risk of cardiovascular disease: an update. Circulation 2012;126:1301-1313.
crossref pmid
33. Eguchi Y, Eguchi T, Mizuta T, Ide Y, Yasutake T, Iwakiri R, et al. Visceral fat accumulation and insulin resistance are important factors in nonalcoholic fatty liver disease. J Gastroenterol 2006;41:462-469.
crossref pmid pdf
34. Park BJ, Kim YJ, Kim DH, Kim W, Jung YJ, Yoon JH, et al. Visceral adipose tissue area is an independent risk factor for hepatic steatosis. J Gastroenterol Hepatol 2008;23:900-907.
crossref pmid
35. Kim D, Chung GE, Kwak MS, Seo HB, Kang JH, Kim W, et al. Body fat distribution and risk of incident and regressed nonalcoholic fatty liver disease. Clin Gastroenterol Hepatol 2016;14:132-138 e4.
crossref pmid
36. Cai C, Song X, Chen Y, Chen X, Yu C. Relationship between relative skeletal muscle mass and nonalcoholic fatty liver disease: a systematic review and meta-analysis. Hepatol Int 2020;14:115-126.
crossref pmid pmc pdf
37. Joo SK, Kim W. Interaction between sarcopenia and nonalcoholic fatty liver disease. Clin Mol Hepatol 2023;29(Suppl):S68-S78.
crossref pmid pmc pdf
38. Tanaka M, Okada H, Hashimoto Y, Kumagai M, Nishimura H, Oda Y, et al. Relationship between nonalcoholic fatty liver disease and muscle quality as well as quantity evaluated by computed tomography. Liver Int 2020;40:120-130.
crossref pmid pdf
39. Hsieh YC, Joo SK, Koo BK, Lin HC, Lee DH, Chang MS, et al. Myosteatosis, but not sarcopenia, predisposes NAFLD subjects to early steatohepatitis and fibrosis progression. Clin Gastroenterol Hepatol 2023;21:388-397.e10.
crossref pmid
40. Jang HC. How to diagnose sarcopenia in Korean older adults? Ann Geriatr Med Res 2018;22:73-79.
crossref pmid pmc
41. Cawthon PM, Peters KW, Shardell MD, McLean RR, Dam TT, Kenny AM, et al. Cutpoints for low appendicular lean mass that identify older adults with clinically significant weakness. J Gerontol A Biol Sci Med Sci 2014;69:567-575.
crossref pmid pmc
42. Kim HS, Lee J, Kim EH, Lee MJ, Bae IY, Lee WJ, et al. Association of myosteatosis with nonalcoholic fatty liver disease, severity, and liver fibrosis using visual muscular quality map in computed tomography. Diabetes Metab J 2023;47:104-117.
crossref pmid pmc pdf
43. Hsieh YC, Joo SK, Koo BK, Lin HC, Kim W. Muscle alterations are independently associated with significant fibrosis in patients with nonalcoholic fatty liver disease. Liver Int 2021;41:494-504.
crossref pmid pdf
44. Chang Y, Ryu S, Sung E, Woo HY, Cho SI, Yoo SH, et al. Weight gain within the normal weight range predicts ultrasonographically detected fatty liver in healthy Korean men. Gut 2009;58:1419-1425.
crossref pmid
45. Wong VW, Wong GL, Chan RS, Shu SS, Cheung BH, Li LS, et al. Beneficial effects of lifestyle intervention in non-obese patients with non-alcoholic fatty liver disease. J Hepatol 2018;69:1349-1356.
crossref pmid
46. Chun HS, Lee M, Lee HA, Oh SY, Baek HJ, Moon JW, et al. Association of physical activity with risk of liver fibrosis, sarcopenia, and cardiovascular disease in nonalcoholic fatty liver disease. Clin Gastroenterol Hepatol 2023;21:358-369.e12.
crossref pmid
47. Kim HK, Lee MJ, Kim EH, Bae SJ, Choe J, Kim CH, et al. Longitudinal changes of body composition phenotypes and their association with incident type 2 diabetes mellitus during a 5-year follow-up in Koreans. Diabetes Metab J 2019;43:627-639.
crossref pmid pmc pdf
48. Kim YS, Lee Y, Chung YS, Lee DJ, Joo NS, Hong D, et al. Prevalence of sarcopenia and sarcopenic obesity in the Korean population based on the Fourth Korean National Health and Nutritional Examination Surveys. J Gerontol A Biol Sci Med Sci 2012;67:1107-1113.
crossref pmid

Editorial Office
The Korean Association for the Study of the Liver
Room A1210, 53 Mapo-daero(MapoTrapalace, Dowha-dong), Mapo-gu, Seoul, 04158, Korea
TEL: +82-2-703-0051   FAX: +82-2-703-0071    E-mail: kasl@kams.or.kr
Copyright © The Korean Association for the Study of the Liver.         
COUNTER
TODAY : 478
TOTAL : 1797648
Close layer