


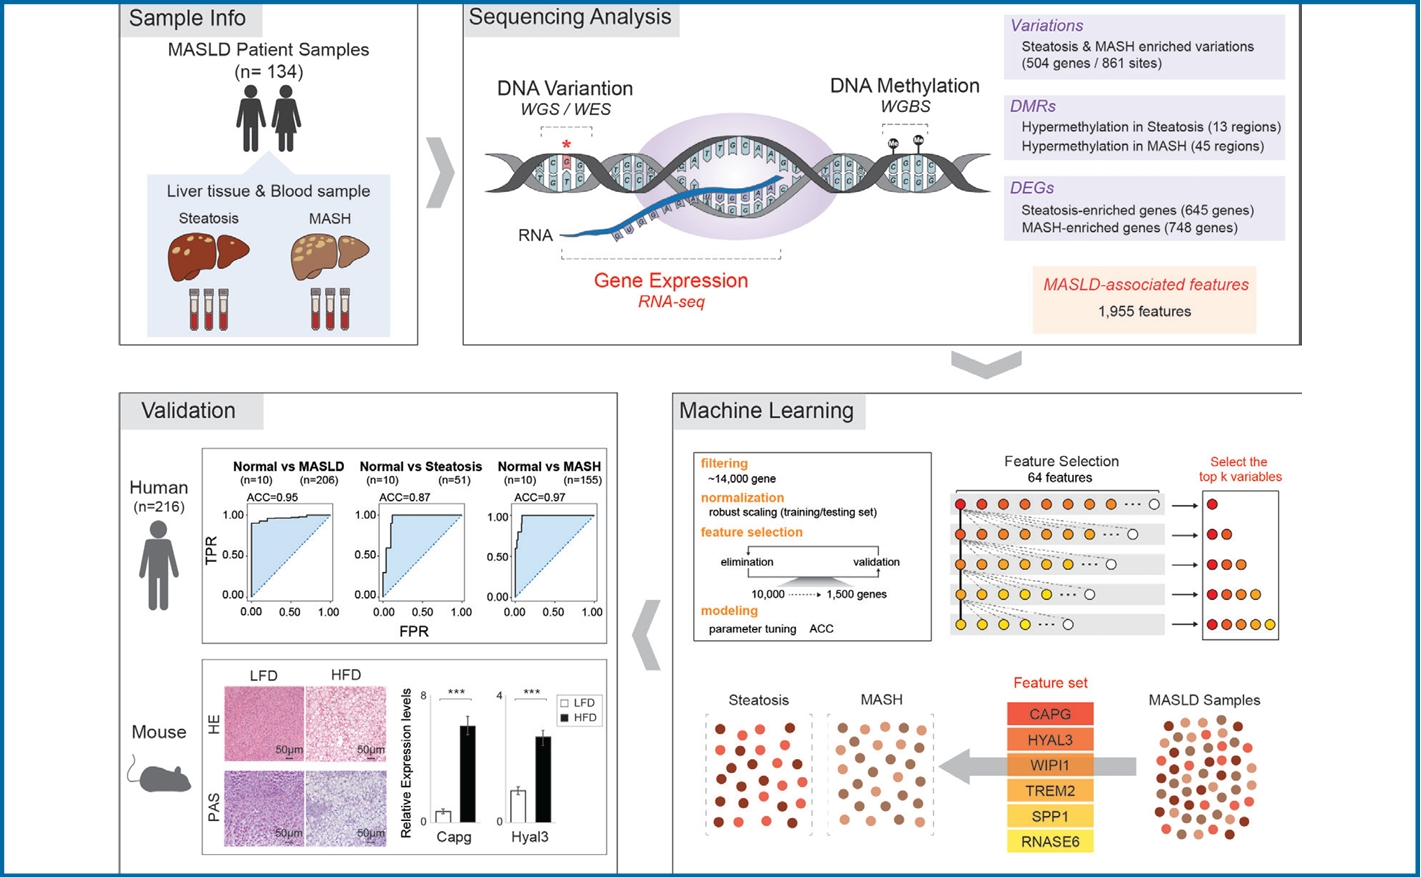
Graphical Abstract
INTRODUCTION
Metabolic dysfunction-associated steatotic liver disease (MASLD) is a metabolic disease characterized by fat accumulation in the liver [1-3]. MASLD includes simple steatosis, which is relatively early-stage and low risk, and metabolic dysfunction-associated steatohepatitis (MASH), which is late-stage disease characterized by serious liver inflammation and fibrosis [4-6]. Since MASH is often a precursor of cirrhosis, liver cancer, and liver failure, it is critical to discriminate between steatosis and MASH to guide patient treatment [7-9]. MASLD can be diagnosed using various non-invasive assessment methods, including imaging techniques, blood tests, and fibrosis assessment. However, a combination of these methods is required for a more accurate diagnosis and to assess the severity of MASLD [10-12]. This underscores the need to identify novel molecular markers that would facilitate a faster and more precise MASLD staging.
Genome, transcriptome, and epigenome sequencing have already suggested potential biomarkers of MASLD in previous studies [13]. Genetic variants, specifically single nucleotide polymorphism (SNPs) in PNPLA3, GCKR, TM6SF2, and AGXT2, have been associated with MASLD progression [14,15]. Comprehensive RNA-seq analyses have identified differentially expressed genes (DEGs) related to MASLD, providing insights into its severity involving processes such as the ablation of extracellular molecules, cytokine responses, and immune system functions [16,17]. In addition, epigenetic markers, particularly DNA methylation, have been explored. DNA methylation signatures related to age acceleration were correlated with MASLD severity, and hepatic fat-associated CpGs in peripheral blood samples of patients with type 2 diabetes revealed differentially methylated regions (DMRs), including ABCG1, CPT1A, and TMEM50B [18,19]. Despite these efforts uncovering significant markers associated with various stages of MASLD progression, securing the optimal gene set for accurately diagnosing a patientтАЩs specific stage of MASLD progression remains an ongoing challenge.
Therefore, we decided to collect and analyze genomic, epigenomic, and transcriptomic data from a single cohort of patients progressing from steatosis to MASH, aiming to identify features that would enable an accurate diagnosis of MASLD stages. By feeding the MASLD-associated into a series of machine learning models that used linear regression methods, we were able to identify a set of 6 MASLD signature genes accurate enough to discriminate MASLD stage. We verified the utility of this gene set by using them to distinguish an independent cohort of MASLD and liver cancer patients from controls. Thus, this gene set will likely prove useful for the early diagnosis of MASLD and in guiding MASLD patient treatment.
MATERIALS AND METHODS
Sample and sequencing library preparation
Pathologically proven biopsy-tissue and blood samples were obtained from a cohort of 134 MASLD patients, comprising 60 steatosis and 74 MASH patients in the study cohort who were recruited from the Dong-A University Hospital (Informed consent was obtained from all subjects, DAUHIRB-17-197) and Onhospital (Informed consent was obtained from all subjects, ONHIBR-19-001), Busan, Rep. of Korea. All fresh samples were frozen immediately after biopsy and stored at тАУ70тДГ according to the protocols approved by the institutional review board for the human subject guideline that is in accordance with the principles of the Declaration of Helsinki. Hospital medical records and pathology reports of patients were reviewed by internal pathologist. The clinical features and the information of samples used for NGS analysis were provided in Supplementary Table 1 and Supplementary Table 2. For whole genome sequencing (WGS) and whole exome sequencing (WES), DNA was extracted from tissues and blood from MASLD patients. WGS libraries were generated using TruSeq Nano DNA (350), and 150-bp paired-end reads were sequenced on the Illumina platform. WES libraries were prepared using the SureSelectXT Library Prep Kit, and 100-bp paired-end reads were sequenced on the Illumina platform. For whole genome bisulfite sequencing (WGBS), samples were prepared using the Accel-NGS Methyl-Seq DNA Library Kit and the EZ DNA Methylation-Gold Kit. Then, 150-bp paired-end reads from the resulting libraries were sequenced on the Illumina platform. For total RNA-seq, RNA was extracted from the tissues of MASLD patients. Libraries were generated using the TruSeq Stranded Total RNA LT Sample Prep Kit, and 100-bp paired-end reads were sequenced on the Illumina platform (All sequencing was carried out by Macrogen, Inc., Seoul, Korea).
Detailed experimental procedures for histological diagnosis, genomic and epigenomic analysis, transcriptome analysis, machine learning, open chromatin accessibility analysis, statistics, high-fat diet (HFD) mouse model, hematoxylin and eosin (H&E) and with periodic acid schiff (PAS) staining, hepatocyte organoid culture, free fatty acid (FFA) treatment and Oil Red O staining and qRT-PCR are provided in supplementary information.
RESULTS
Identification of MASLD-associated somatic variants
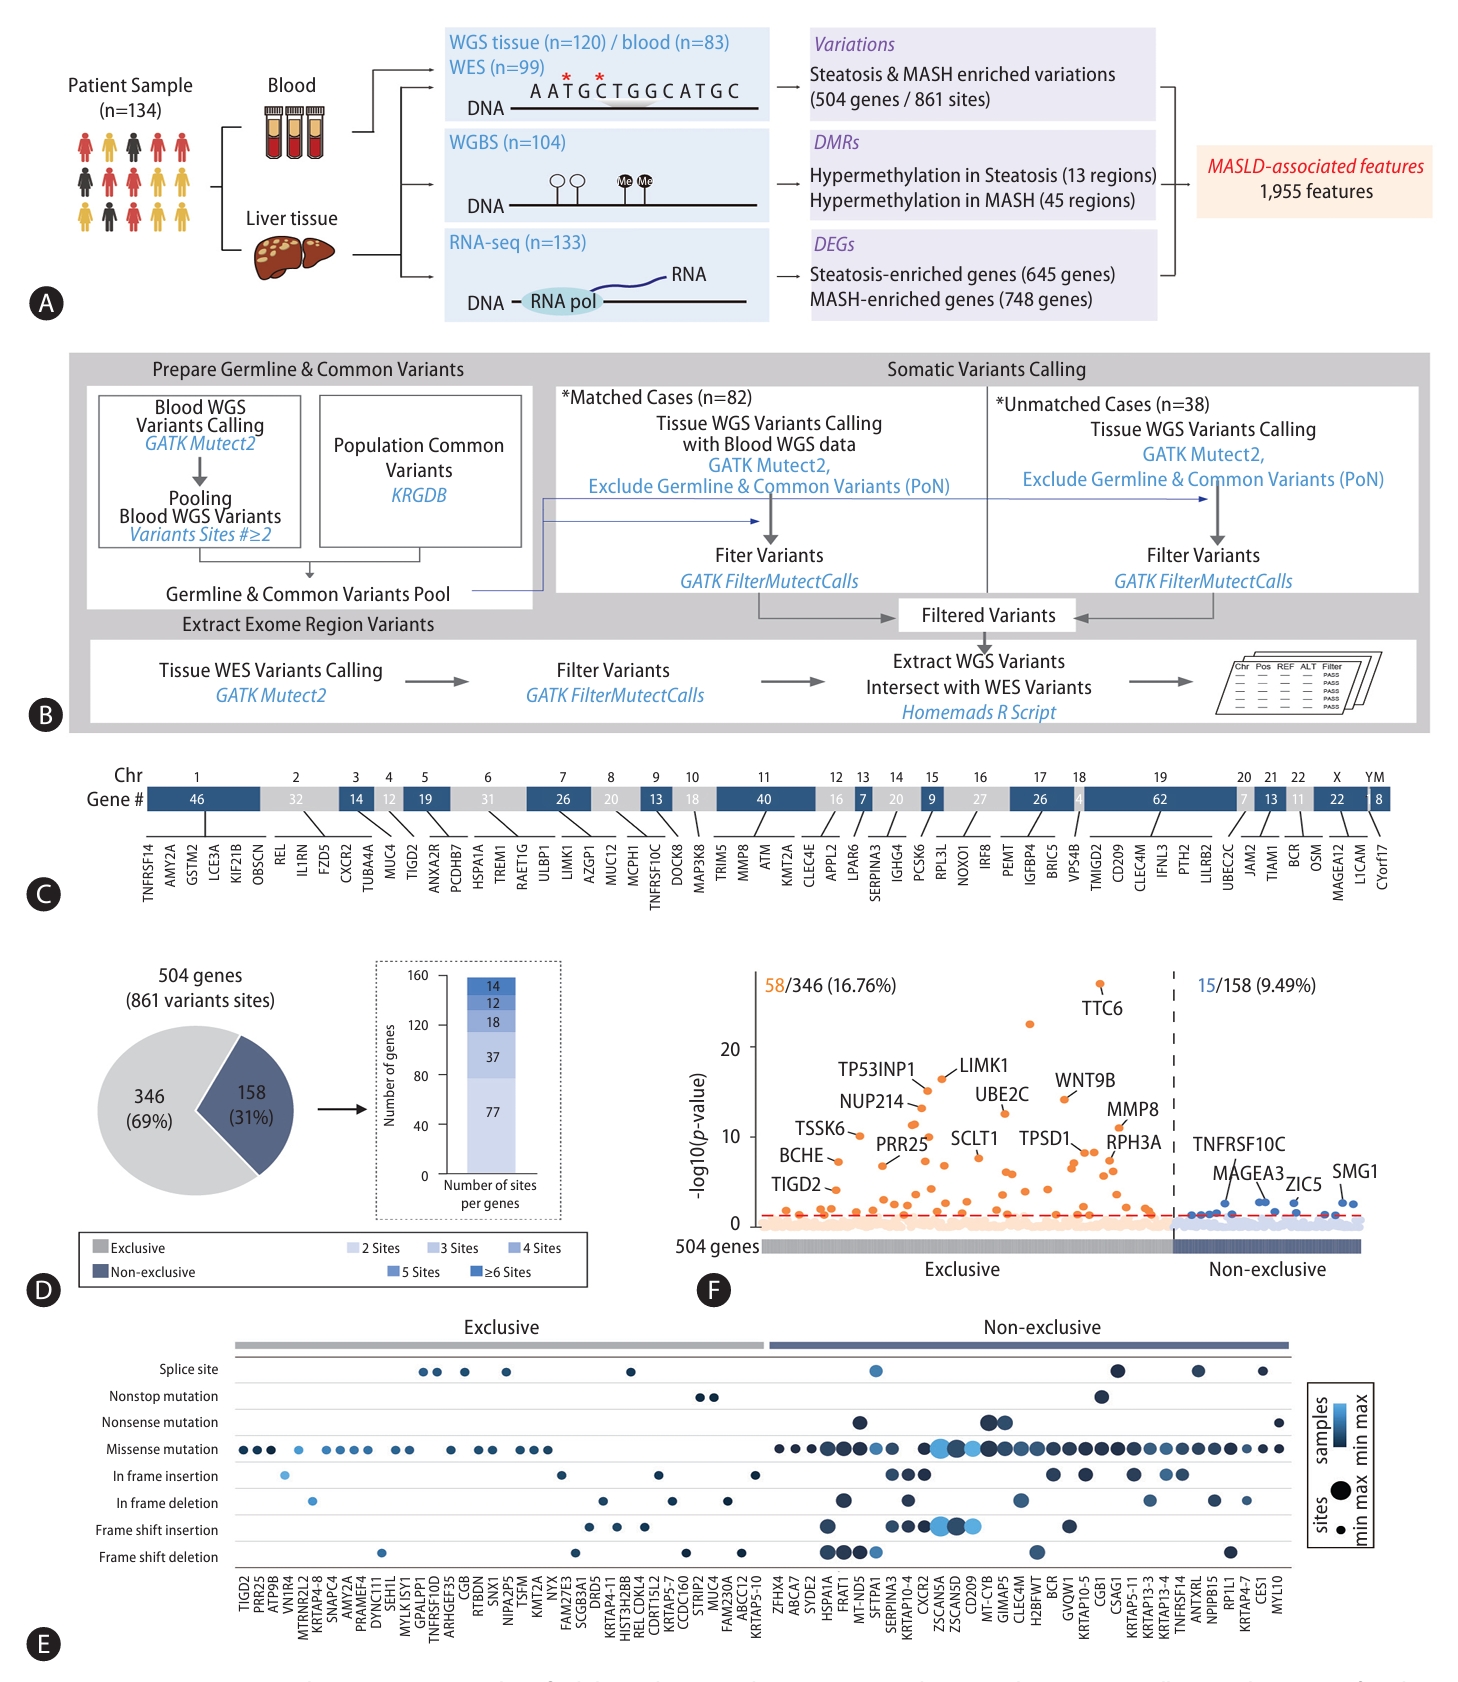
To discover MASLD-associated markers, we took a multiomics approach, looking at genomic, epigenomic, and transcriptomic data from WGS, WES, WGBS, and total RNA-seq using pathologically-proven biopsy tissue samples obtained from 134 MASLD patients (Fig. 1A). First, to limit our exploration to somatic markers that offer insights into genetic changes occurring in diseased cells, enhancing our understanding of the molecular basis of the disease, we eliminated any germline mutations by comparing WGS data obtained from liver biopsies with those obtained from blood samples (Fig. 1B). By integrating WES data screening for somatic variants in exon regions likely to affect the function of genes, we narrowed our search to 3,888 somatic variant callings. Of these, 79% (3,054) were classified as type of missense mutations. The most common type of somatic variant was the SNP, specifically the SNV in which a T nucleotide was altered to a C (Supplementary Fig. 1). Then, we focused on 504 different genes with 861 somatic variant sites detected in more than two of the 120 MASLD patient samples (Supplementary Table 3). These 504 genes with MASLD-associated somatic variants were broadly distributed throughout all chromosomes (Fig. 1C). Next, we asked whether the variants in these 504 genes were exclusive mutations (Fig. 1D). We found that 346 of 504 genes (69%) with the variants were exclusive, but the remaining 158 genes (31%) showed multiple, non-exclusive variants. Among them, genes mostly showed two variation sites. When we classified the various exclusive or nonexclusive variants in individual genes (Fig. 1E), we found missense mutations were the most common in both genes with exclusive and non-exclusive variants. In genes with non-exclusive variants, we observed cases in which two of the same type of variation appeared along with cases showing combinations of two or more different types. To determine the contribution of these MASLD-associated somatic variants to gene expression, we analyzed the expression levels of the 504 genes between their altered and non-altered groups (Fig. 1F). We found 16.76% (58) of the 346 genes with exclusive variations showed a statistically significant differences in their expression level, while only 9.49% (15) of the 158 genes with non-exclusive variants showed statistically significant expression changes.
Since variations of PNPLA3, TM6SF2, and AGXT2 have all been reported as genetic factors contributing to MASLD, we also examined the variations on these genes and detected in the WGS results from both liver tissues and in blood, suggesting they are instead germline mutations (Supplementary Fig. 2). In our cohort, a PNPLA3 variation (rs738409 C>G), a TM6SF2 variation (rs58542926 C>T), and an AGXT2 variation (rs2291702 T>C) were detected in 76.67%, 25.83%, and 67.50% of the samples, respectively (Supplementary Fig. 2A). We confirmed diminished expression levels of these genes in the steatosis and MASH altered groups, with remarkable reductions in homozygous variants (Supplementary Fig. 2B and 2C). Thus, these MASLD-related genetic variations were common in our cohort, but they were excluded because we were searching specifically for somatic mutations. From these results, we suggest MASLD-associated somatic variations in 504 genes.
Differentially methylated regions in MASLD
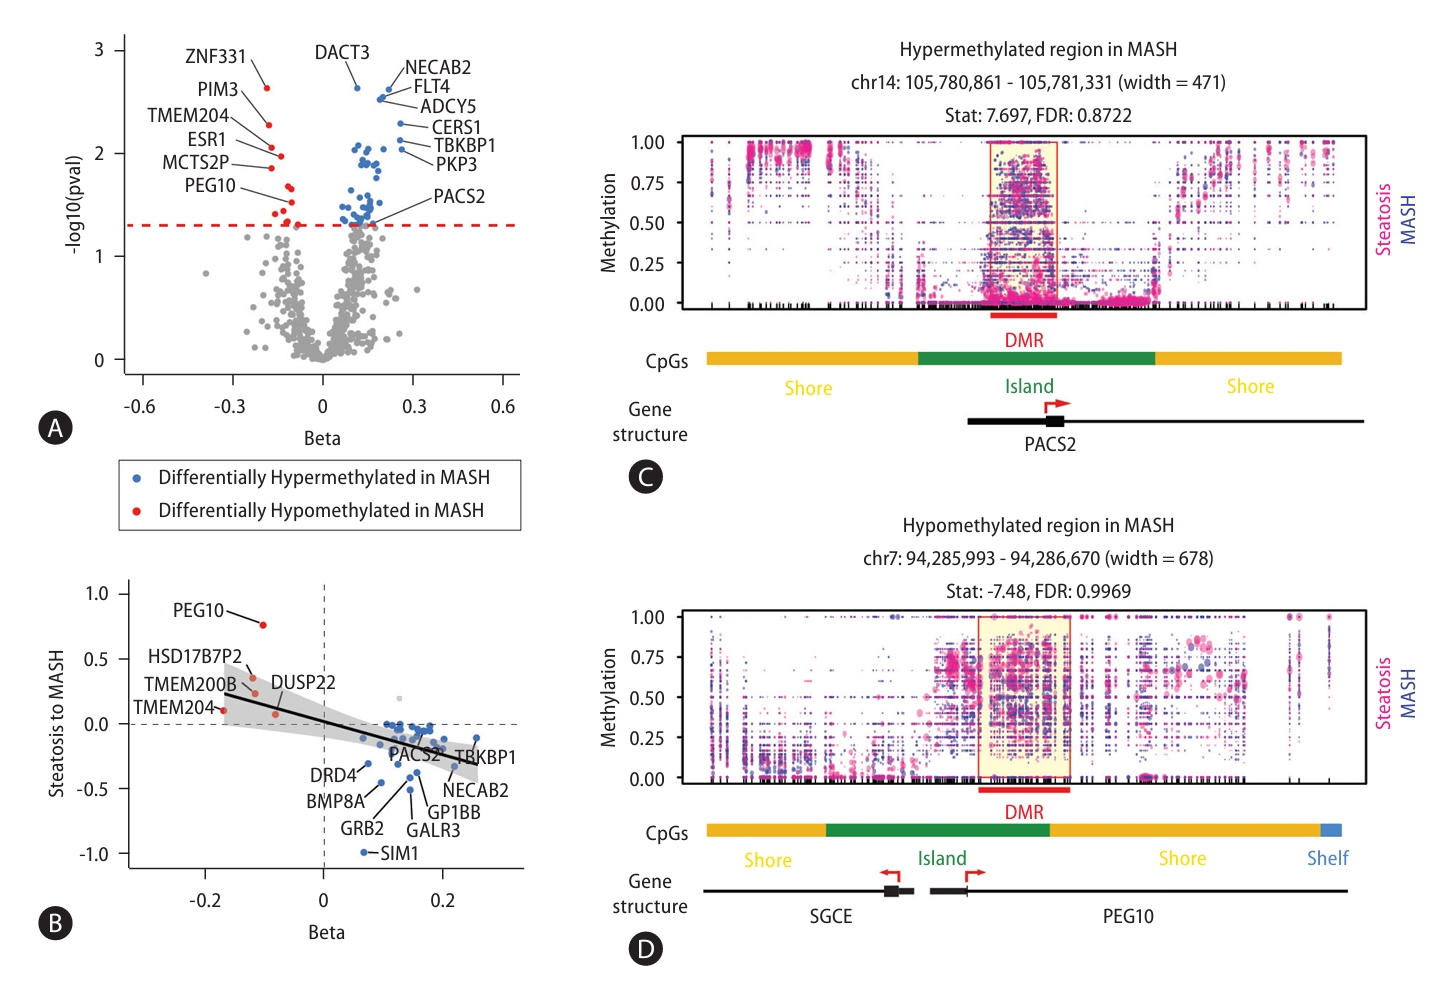
Next, to identify DMRs associated with MASLD, we performed WGBS in 104 MASLD patients (Fig. 2). We identified 87 DMRs with p-values less than 0.05 in the comparison between steatosis and MASH samples. 68 of 87 DMRs (78%) were located within known CpG regions and 58 of these DMRs (66.7%) were annotated to reference genes (Supplementary Table 4). Of these 58 DMRs, 13 DMRs were hypomethylated and 45 DMRs were hypermethylated in MASH (Fig. 2A). We next asked whether the differential methylation associated with MASLD progression also contributed to gene expressions (Fig. 2B). As results, of the 13 genes with hypomethylated CpGs and the 45 genes with hypermethylated CpGs, 38.4% (5) and 68.8% (31) showed inverse correlations with gene expression, respectively. Indeed, the correlation coefficients comparing methylation status and gene expression were statistically significant (P-value=3.07E-03). Figure 2C shows the hypermethylated promoter region of PACS2 and the hypomethylated promoter of PEG10 as examples of altered genes associated with MASH. Together, our results of epigenomic analysis provided MASLD-associated DMRs that could affect disease progression through the regulation of gene expression.
Genes related to MASLD progression
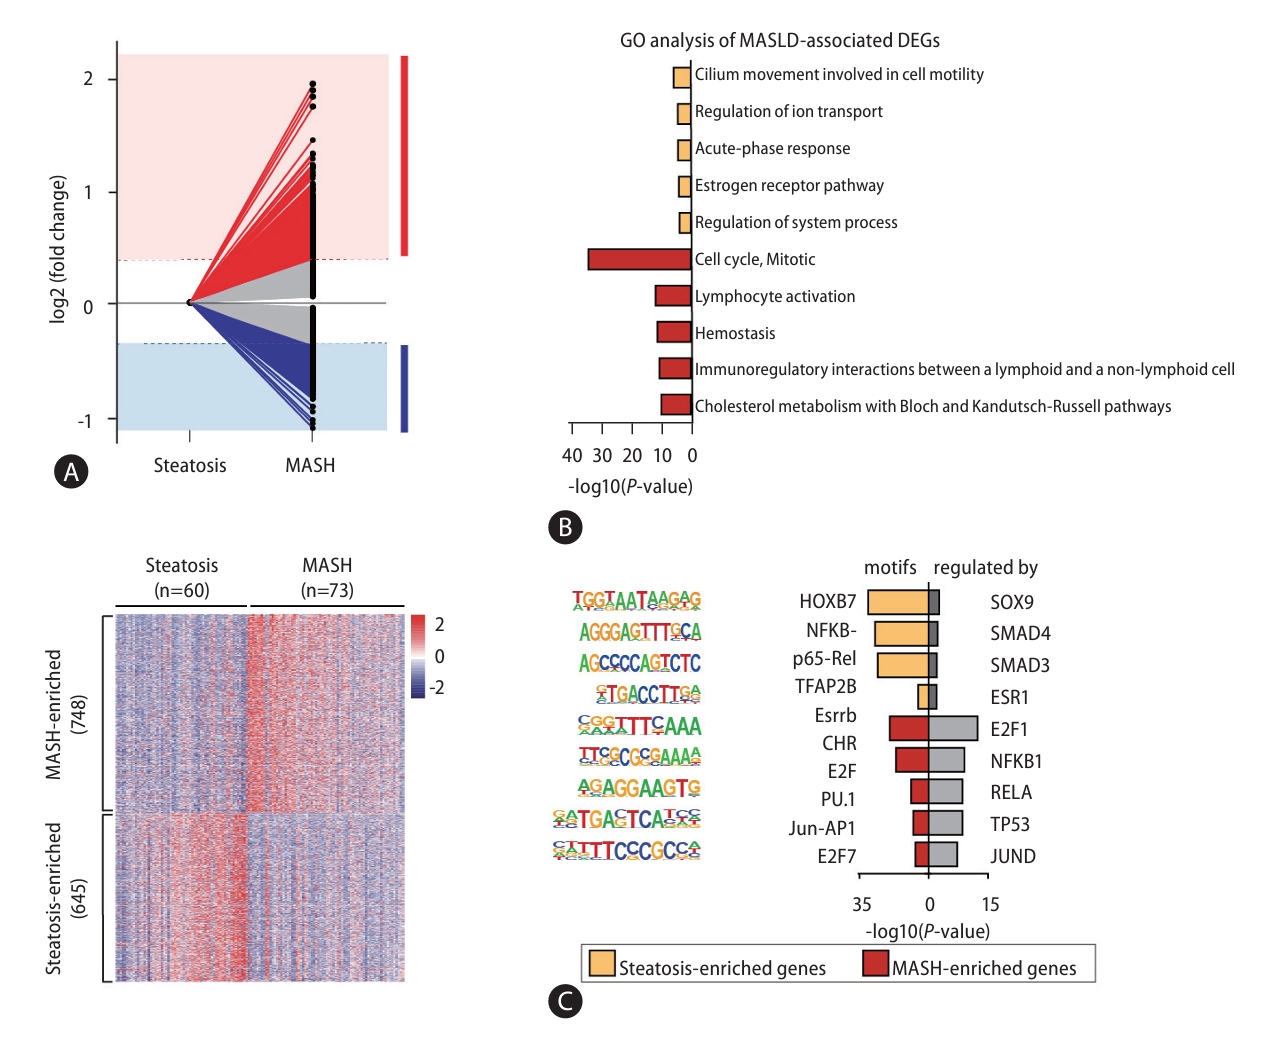
Next, to investigate genes related to MASLD progression, we performed a total RNA-seq analysis and found 1,393 DEGs in the comparison of steatosis and MASH (Supplementary Table 5). Among these, 645 steatosis- and 748 MASH-enriched genes were defined by a 1.3-fold or greater change in expression level between MASLD stages (Fig. 3A). To understand the function of steatosis- and MASH-enriched genes, we performed analysis of GO (Fig. 3B), motif search, and TRRUST enrichment (Fig. 3C). Results of these analysis showed DEGs were involved in terms of cell-cell adhesion, metabolic process, and cytokine signaling and were regulated by transcription factors such as NF╬║B, JUN, and SMAD3/4 have already been associated with MASLD progression.
Integrated networks of MASLD-associated features within functional modules
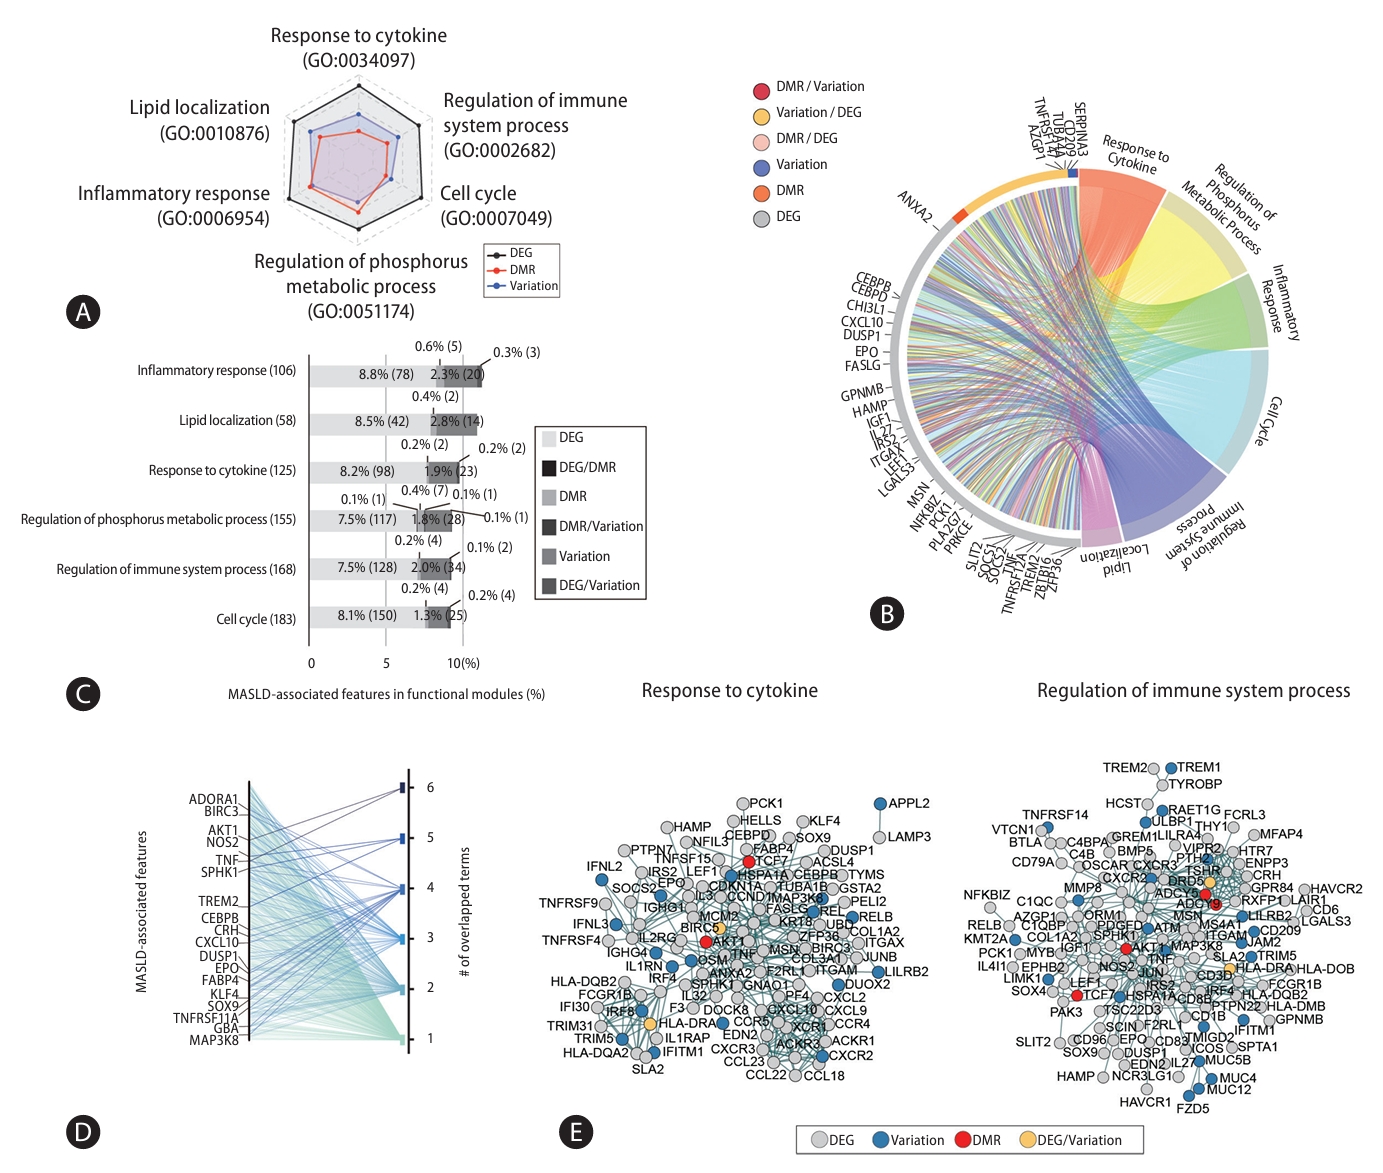
From MASLD-associated somatic variations, DMRs, and DEGs we identified, we designated 1,955 as MASLD-associated features. We next investigated whether these MASLD-associated features collaborate in functional modules (Fig. 4). Considering the proportion of MASLD-associated features in each module, frequency represented in terms for steatosis-or MASH-enriched genes, we found dominant 6 functional modules such as response to cytokine, regulation of immune system process, cell cycle, regulation of phosphorus metabolic process, inflammatory response, and lipid localization (Fig. 4A). MASLD-associated features accounted for about 10% of the list corresponding to genes annotated from the public database of functional modules. Since MASLD-associated features may simultaneously be MASLD-associated variations, DMRs, or DEGs, we categorized them in detail. Individual functional modules included genomic, epigenetic, and transcriptomic features (Fig. 4B). As an example, the 125 MASLD-associated features related to cytokine responses included 98 DEGs, 2 DMRs, 23 genes with variations, and 2 genes involved in DEGs/variations (Fig. 4C). We found MASLD-associated features appearing in one or more functional modules, both specifically and sometimes redundantly (Fig. 4D). They also showed strong cooperation within MASLD-associated functional modules (Fig. 4E and Supplementary Fig. 3). Thus, MASLD-associated features were connected primarily to representative functional modules related to MASLD, collaborating with one another within their functional modules. This suggests MASLD-associated variations, differential methylated regions, and expression changes have a close relationship with one another.
Identification of signature genes through feature selection
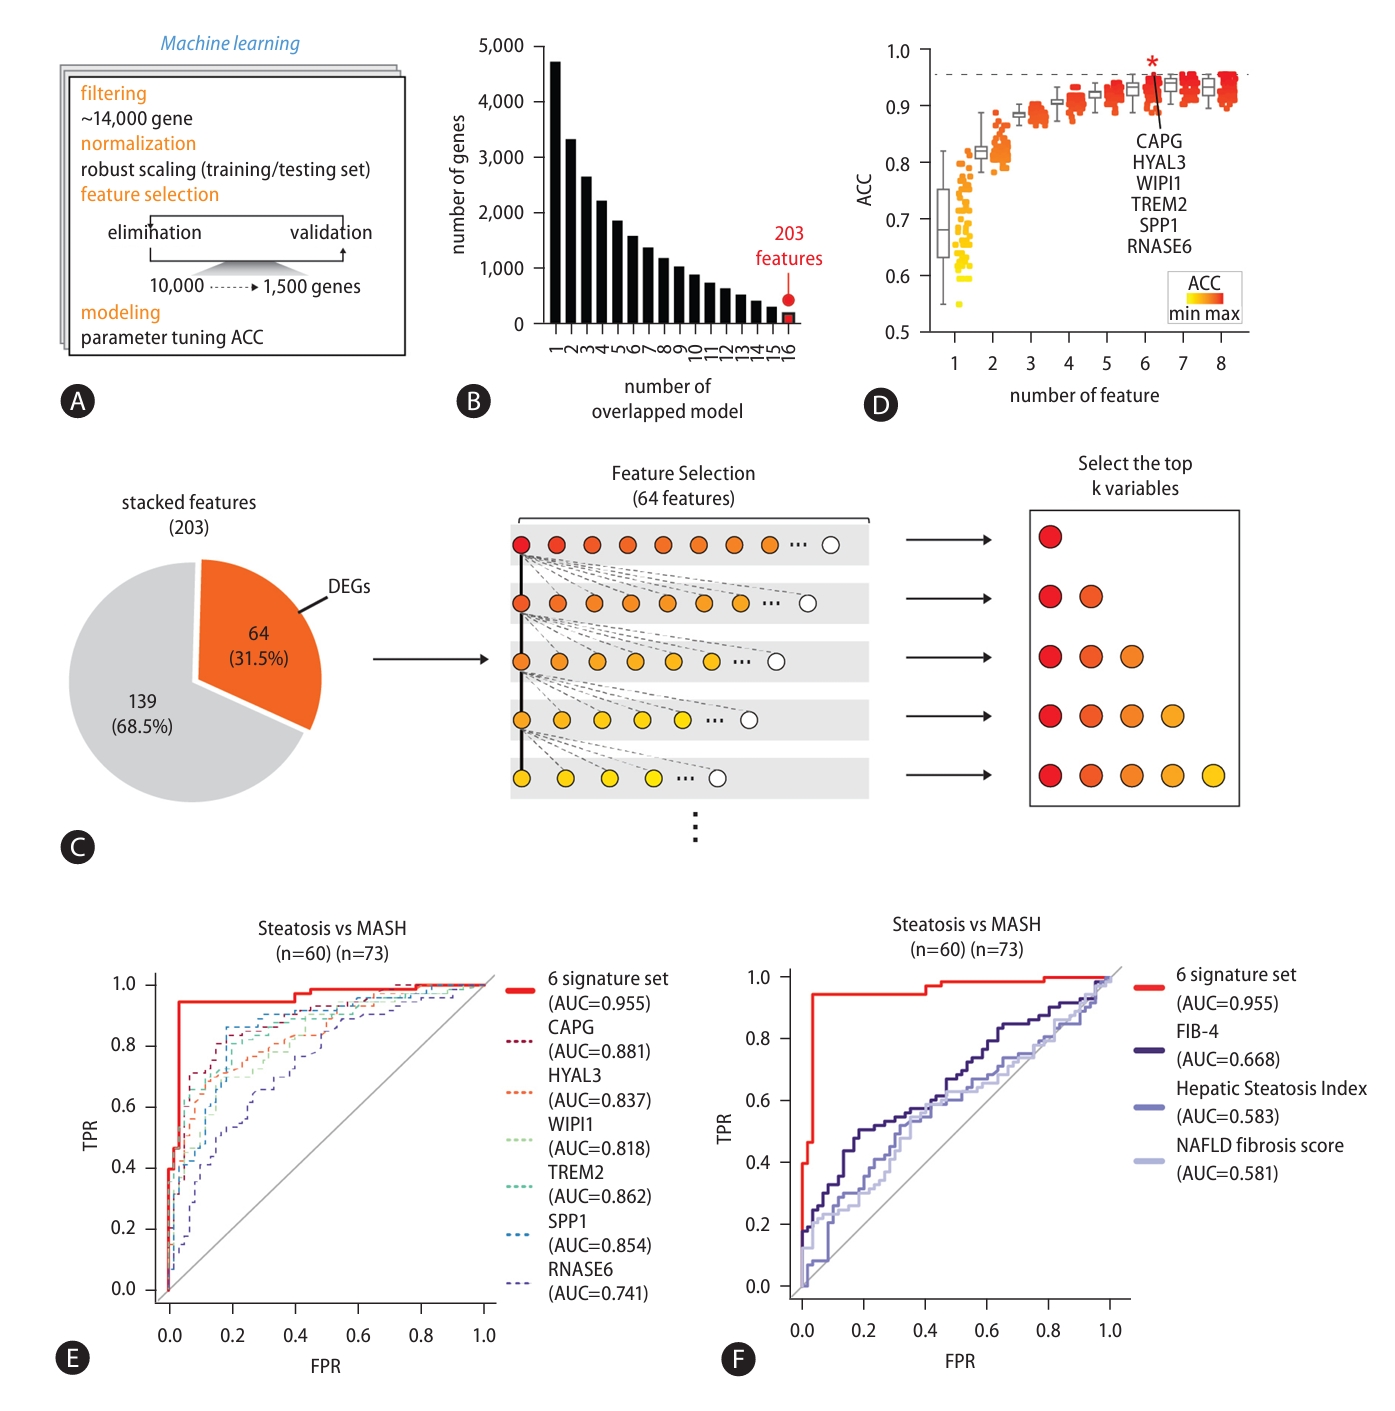
To ascertain the signature gene set for diagnosis of MASLD stages, we established machine learning modeling with feature selection (Fig. 5A). To prevent bias in the feature selection process, we randomly divided the samples in our cohort: 70% were assigned to a training set and 30% to a testing set. We started with 14,396 genes and robust scaling was processed to individually normalize the expressions (Supplementary Fig. 4). Then, redundant features were eliminated by repeating linear SVM modeling until less than 1,500 features with optimum coefficient scores remained. The ~1,500 selected features were placed in a testing set to evaluate their accuracy through RBF kernel model with optimal parameters. Finally, we established 20 machine learning models for MASLD-stage discrimination and found 16 models with over 80% accuracy (ACC) (Supplementary Fig. 5A).
Next, to identify signature genes from the selected features through machine learning modeling, we first asked whether there are similarities between the selected features (Fig. 5B). We found that 203 features were shared across 16 individual models, and we designated these тАЬstacked featuresтАЭ. Then, we looked at the features shared between the 203 stacked features and the 1,955 MASLD-associated features obtained from multi-omics analysis. We selected 64 features for further analysis and used them to discover an optimal combination of signature genes by generalized linear regression model (GLM) (Fig. 5C). First, after measuring the accuracy of the 64 features independently, we ranked them by an accuracy score. CAPG had the highest accuracy score (ACC=0.82) (Supplementary Fig. 5B and Supplementary Table 6). Then, we tried to identify the genes that gave the highest accuracy when paired with CAPG. This process was repeated with one feature after another, considering only those features that maintained a combined accuracy as high as the other models with more features (Fig. 5D and Supplementary Table 7). We found that the accuracy of combined gene set increased as features were added to it, but a combination of 6 genes saturated at the highest level of accuracy. In this way, we identified a set of 6 signature genesтАФCAPG, HYAL3, WIPI1, TREM2, SPP1, and RNASE6тАФthat yielded the highest accuracy in MASLD stage discrimination. We improved the discriminability of steatosis and MASH samples by applying only the 6 signature genes compared with either data from whole transcriptome or 1,393 DEGs (Supplementary Fig. 6). Moreover, we confirmed that utilizing a set of genes enhances the ability to distinguish MASLD stages compared to individual genes (Fig. 5E), as well as non-invasive markers, such as non-alcoholic fatty liver disease (NAFLD) fibrosis score, FIB-4, and Hepatic Steatosis Index (HSI) (Fig. 5F) [20-22]. Together, we propose that the 6 signature genes identified using machine learning modeling are essential molecular markers for assessing MASLD progression.
Application of the signature gene set to liver disease
To determine whether signature genes can be applied to the full spectrum of MASLD-associated disease and related histological features, we calculated its accuracy in diagnosing an independent cohort of 216 samples comprising 10 normal, 51 steatosis, and 155 MASH samples (Fig. 6A, GSE135251) and a cohort of 78 samples comprising 6 normal and 72 MASLD samples, providing information on steatosis, inflammation, ballooning hepatocyte, and liver fibrosis stage (Fig. 6B, GSE130970) [10,17]. When we plotted ROC curve plots, we found that the signature gene set discriminates between steatosis and MASH (F0-F4) with an AUC score of 0.795 (Fig. 6A). Since MASH samples were graded F0 to F4 according to disease progression, we further analyzed the early-stage MASH groups (F0-2) and the late-stage MASH groups (F3-4). When predicting the groups, steatosis samples from the early-stage MASH (F0-2) samples that were relatively close in disease progression, the performance was still high accuracy (AUC=0.767). Further, in distinguishing steatosis from latestage MASH (F3-4), which show significantly different levels of disease progression, the signature gene set predicted with high AUC score (AUC=0.863). Next, we were interested on the possibility to extend the coverage of signature gene set from normal to whole spectrum of MASLD. By applying the combination gene set of signature genes, it was possible to distinguish between normal and whole MASLD with very precisely (AUC=0.968). Also, normal and steatosis tissues (AUC=0.947), and normal and MASH tissues (AUC=0.979) showed highly accurate results. Furthermore, we confirmed that the signature gene set accurately distinguished the degree of lobular inflammation (AUC=0.931) and steatosis grade (AUC=0.943) (Fig. 6B). Although the AUC for distinguishing cytological ballooning was about 0.765, the accuracy between fibrosis stages was over 0.838, with an AUC value of 0.857 confirmed for the NAFLD activity score. The expression level of each signature genes was confirmed for normal, steatosis, and MASH and as expected, their expression levels significantly increased with progression through the various stages of MASLD (Fig. 6C) and subgroups based on histological features (Fig. 6D). These results suggest that the discriminatory capacity of the signature gene set for distinguishing different stages of MASLD is comparable to that of histological features.
We further examined the expression levels of the signature genes in an in vivo model fed a HFD (Fig. 6E) and in hepatic organoids treated with 1 mM FFA (Fig. 6F). In the in vivo model fed a HFD, signature gene levels were significantly increased, consistent with a remarkable accumulation of fat in the liver when compared to controls (Fig. 6E). Moreover, we observed a similar increase in signature gene expression in organoids induced to accumulate lipid by treatment with 1 mM FFAs (Fig. 6F and Supplementary Fig. 7). These results demonstrate that our signature gene set not only differentiates steatosis from MASH in MASLD progression, but also normal tissue from steatosis. This means it can be used in the early-stage detection of MASLD.
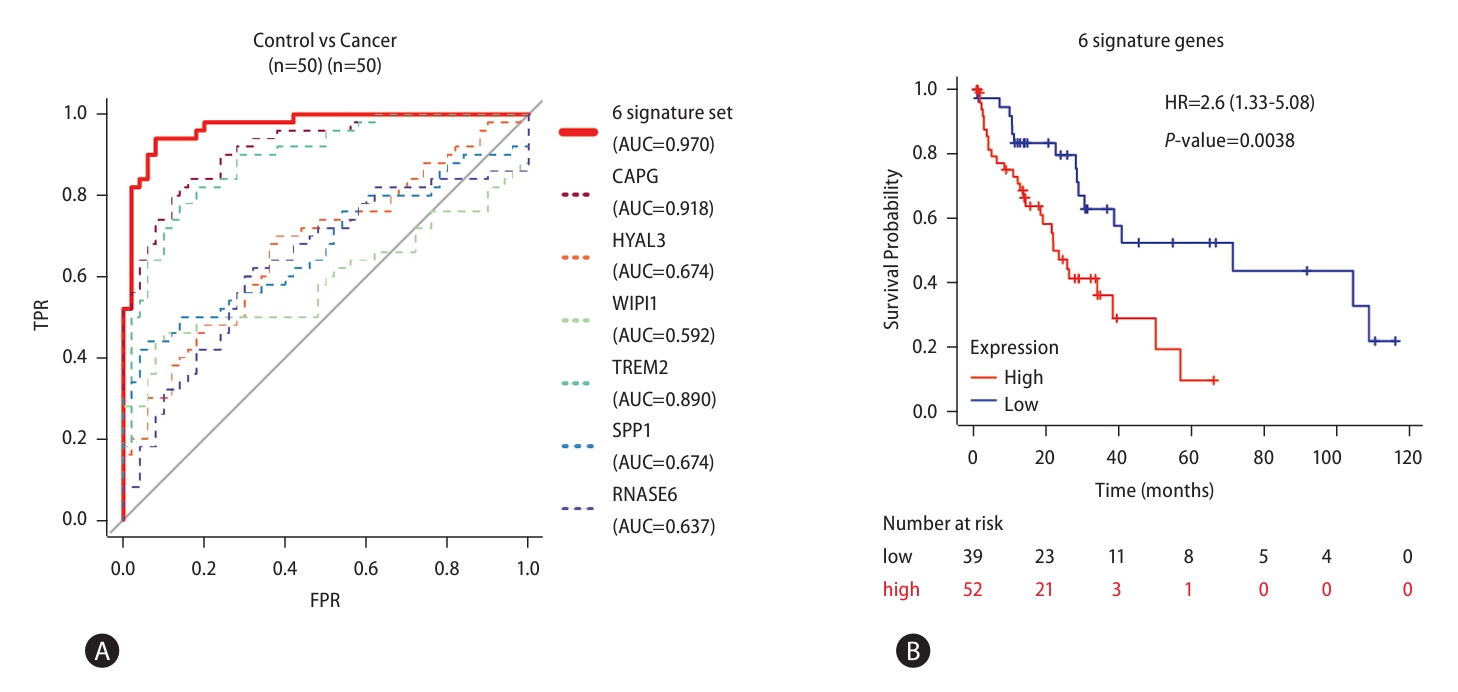
Next, we asked whether the signature gene set could be applied to the detection of liver cancerтАФwhich often follow MASLD (Fig. 7). RNA-seq data from liver cancer patients reported in a previous study (GSE77314) were re-analyzed to validate the combination set of signature genes [23]. The accuracy to distinguish between control and cancer was calculated by GLM. Soundingly, the accuracy between control and liver cancer was exceedingly high (ACC=0.970, Fig. 7A). In addition, we found high expression of signature genes showed correlation with poor overall liver cancer survival (Fig. 7B). Taken together, changes in signature gene expression can distinguish not only MASLD progression but also normal tissue from liver cancer. This indicates that our set of 6 signature genes can be used as biomarkers for the full spectrum of MASLD-associated disease.
Chromatin accessibility of signature genes
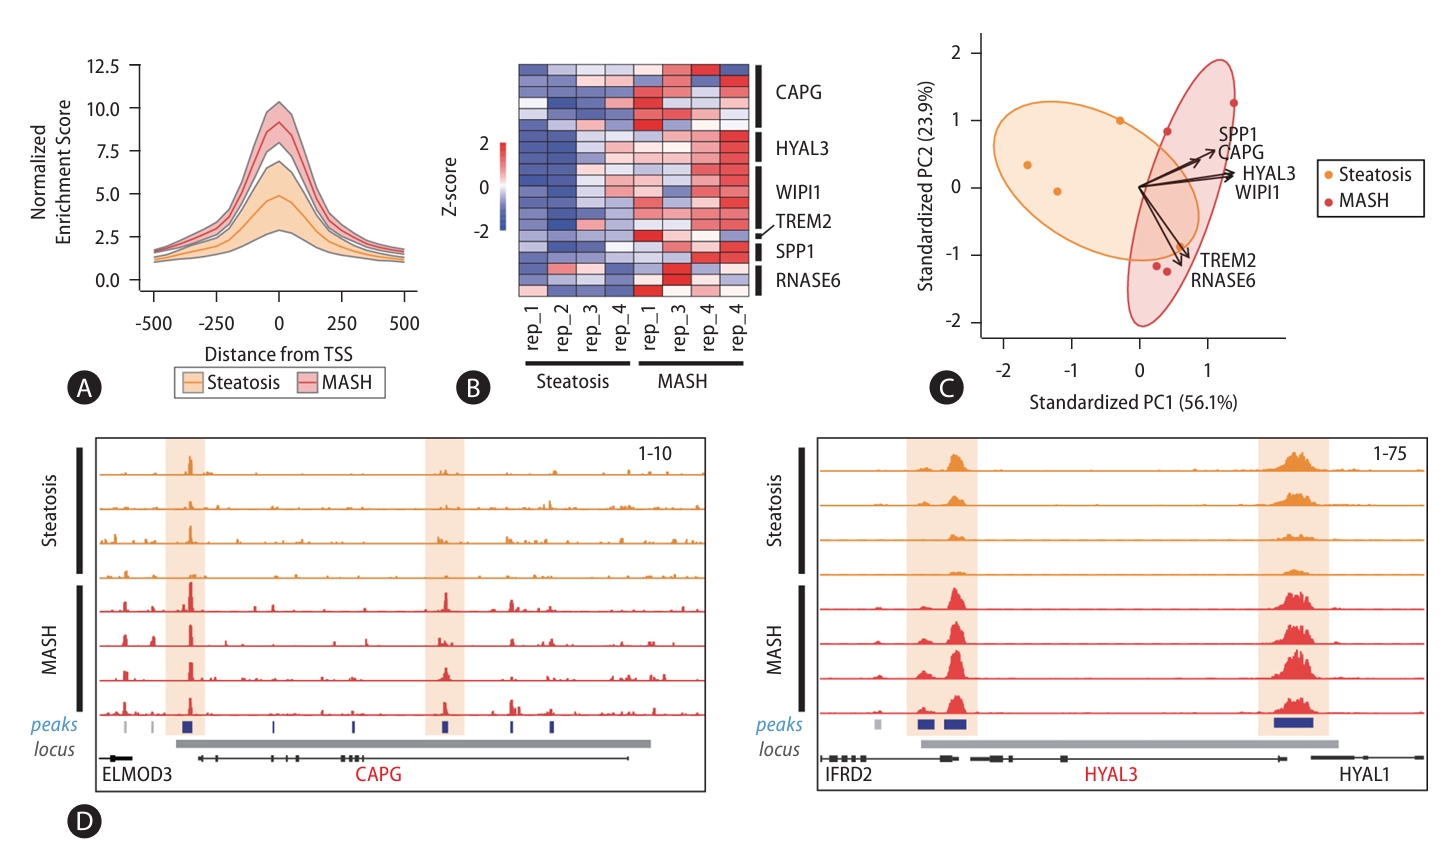
Since chromatin accessibility contributes strongly to gene expression, we further examined changes in chromatin accessibility at signature gene loci by analyzing ATAC-seq on representative steatosis (n=4) and MASH (n=4) samples (PRJNA725028, Fig. 8) [24]. Because the signature genes are also MASH-enriched genes, we first investigated the accessibility status for the promoters of MASH-enriched genes. We found accessibility enrichment at these promoters was significantly increased in MASH samples (Fig. 8A). Furthermore, we confirmed that the enrichment of open chromatin regions at signature gene loci was remarkably increased in MASH (Fig. 8B). We also estimated the combination of the chromatin accessibility scores for the signature genes using PCA and found that also could predict disease progression (Fig. 8C). Figure 8D illustrated the increased enrichment of open chromatin regions at CAPG and HYAL3 loci in MASH compared to steatosis samples. These results indicate both signature gene expression and chromatin accessibility can act as biomarkers for MASLD progression.
DISCUSSION
This study identified MASLD-associated features through integrative genomic, epigenomic, and transcriptomic analyses of samples from 134 MASLD patients. We used machine learning modeling to select from these MASLD-associated features those that could be used to accurately distinguish the stages of MASLD, and then we validated this signature gene set in independent cohorts of MASLD and liver cancer patients. Thus, our results provide diagnostic biomarkers that can accurately discriminate the various stages of MASLD-associated disease.
As big data technologies continue to emerge, machine learning and artificial intelligence (AI) are increasingly being applied to diagnose various human diseases and make decisions regarding their treatment [25]. In previous studies, histological images and/or clinical information have been used as inputs for deep learning or machine learning models designed to predict disease progression. In addition, MASLD researchers have used histological images to predict fibrosis scores in MASH patients and clinical information to distinguish healthy patients from those suffering from MASH [26,27]. Recently, the researchers tried to apply machine learning for MASLD study [28]. One study used lipidomics data and machine learning to detect MASLD and other study used public data (NIDDK NAFLD data and Optum data) to predict MASH [29,30]. Although they had delivered interesting results, the possibility of clinical application may be limited because of either limited data source (lipidomics only or no omics data) or poor AUC (model with AUC 0.82 or 0.76). In our machine learning modeling approach using molecular features, we identified a signature gene comprising CAPG, HYAL3, WIPI1, TREM2, SPP1, and RNASE6, which can discern the various stages of MASLD with high accuracy (Fig. 6A, normal vs MASLD AUC=0.968; normal vs. MASH AUC=0.979). Additionally, the signature gene set demonstrated high accuracy in discriminating between histological feature-based subgroups related to MASLD, achieving effective performance (Fig. 6B, AUC=0.931 for lobular inflammation; AUC=0.943 for steatosis grade; AUC=0.838 for fibrosis stage). We also confirmed that the diagnostic performance of the signature gene set could accurately distinguish disease stages with high accuracy across various subgroups associated with MASLD, including obesity, PNPLA3 mutation, and diabetes, which are known to have close connections with MASLD (Supplementary Fig. 8). These results indicate that the signature gene set identified in this study could be applied to various subgroups related to MASLD, demonstrating its potential as a diagnostic marker.
There is no uncertainty regarding the distinct functional roles of individual genes within the signature gene set in human diseases, as their expression escalates with the progression of MASLD. However, the degree of expression alterations for individual genes exhibits variability among different subgroups associated with MASLD (Fig. 6C and 6D), and the diagnostic capabilities of individual genes diverge (Fig. 5E). This emphasizes the need for a signature gene set, rather than relying on individual genes, to diagnose the stage of the disease. Using the signature gene set to assess disease stages in diverse subgroups of MASLD yielded the highest accuracy (Supplementary Fig. 9), surpassing that of non-invasive assessments (Fig. 5F). Furthermore, we explored the potential use of the signature genes as non-invasive markers and confirmed their ability to discriminate with an AUC of 0.76 between normal and MASLD in cell-free RNAs in blood (Supplementary Fig. 10). This highlights the superior precision achieved with the signature gene set in evaluating MASLD progression.
In summary, using a multi-omics approach coupled with feature selection via machine learning modeling, we identified a signature gene set that can accurately predict the stages of MASLD. We found this signature gene set can be applied to the full MASLD spectrum, from normal tissue to MASLD-related cancer. Our current understanding of this signature gene set has provided markers for the diagnosis of MASLD, but further study will be required for clinical application with larger patient cohort and functional analysis of signature genes.

 PDF Links
 PubReader
 ePub Link
 Full text via DOI
 Download Citation
 Supplement1
 Print
Print