Clin Mol Hepatol > Volume 29(Suppl); 2023 > Article
Yu, Lee, and Kim: Noninvasive imaging biomarkers for liver fibrosis in nonalcoholic fatty liver disease: current and future

ABSTRACT

Nonalcoholic fatty liver disease (NAFLD) is increasingly prevalent worldwide and becoming a major cause of liver disease-related morbidity and mortality. The presence of liver fibrosis in patients with NAFLD is closely related to prognosis, including the development of hepatocellular carcinoma and other complications of cirrhosis. Therefore, assessment of the presence of significant or advanced liver fibrosis is crucial. Although liver biopsy has been considered the “gold standard” method for evaluating the degree of liver fibrosis, it is not suitable for extensive use in all patients with NAFLD owing to its invasiveness and high cost. Therefore, noninvasive biochemical and imaging biomarkers have been developed to overcome the limitations of liver biopsy. Imaging biomarkers for the stratification of liver fibrosis have been evaluated in patients with NAFLD using different imaging techniques, such as transient elastography, shear wave elastography, and magnetic resonance elastography. Furthermore, artificial intelligence and deep learning methods are increasingly being applied to improve the diagnostic accuracy of imaging techniques and overcome the pitfalls of existing imaging biomarkers. In this review, we describe the usefulness and future prospects of noninvasive imaging biomarkers that have been studied and used to evaluate the degree of liver fibrosis in patients with NAFLD.

INTRODUCTION

The prevalence of nonalcoholic fatty liver disease (NAFLD) is increasing worldwide, with approximately 25% of the global population being affected by this condition [1]. Accordingly, the burden on the global healthcare system posed by the treatment of NAFLD is increasing and becoming a serious public health problem [2,3]. NAFLD comprises a spectrum of liver disorders ranging from isolated steatosis to nonalcoholic steatohepatitis (NASH), which can lead to serious conditions such as cirrhosis, hepatocellular carcinoma (HCC), and liverrelated death [4,5]. In particular, the progression of liver fibrosis in patients with NAFLD is considered one of the most important factors determining prognosis, with significant and advanced liver fibrosis being an independent risk factor for both hepatic and extrahepatic complications and liver-related and overall mortality [6,7]. Therefore, accurate assessment of the degree of liver fibrosis in patients with NAFLD is the main issue to be addressed in modern medicine.
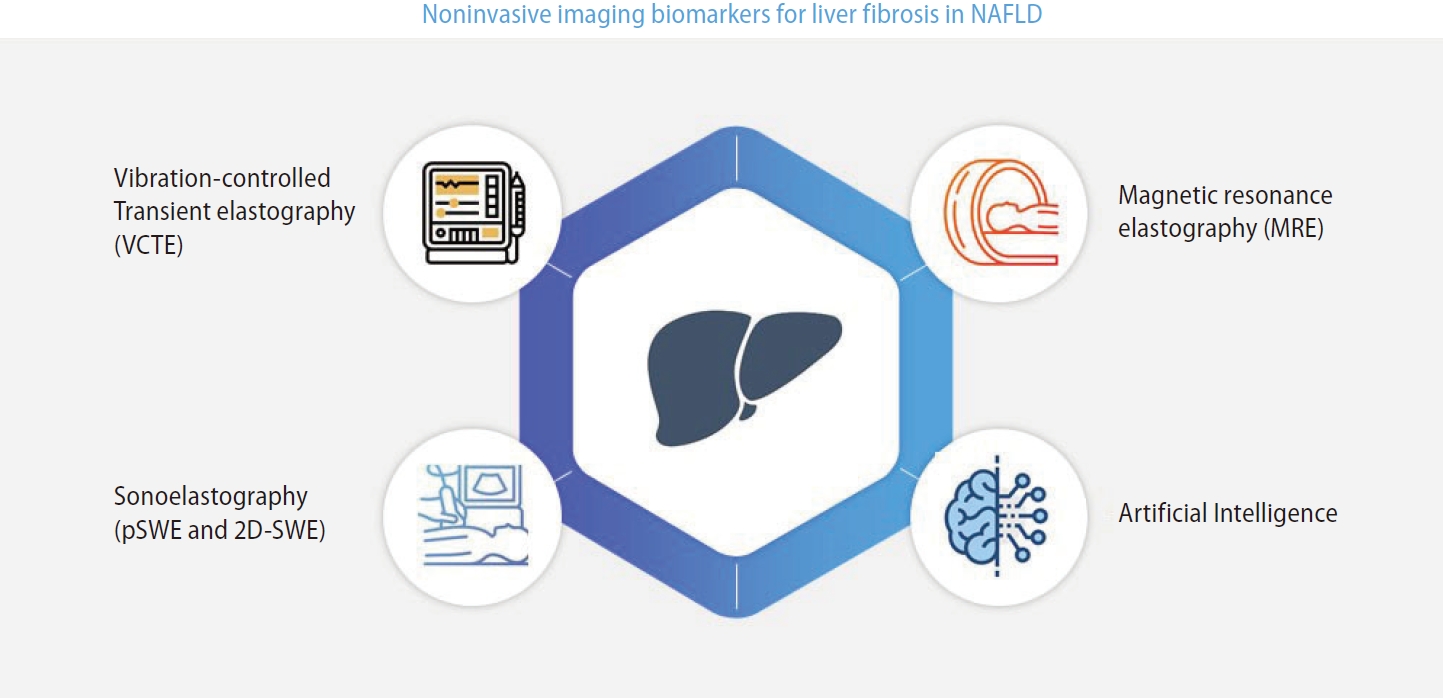
Although liver biopsy is the gold standard method for evaluating liver fibrosis in patients with NAFLD, its general clinical use is limited due to the high cost and potential complications [8]. Moreover, liver biopsy has a disadvantage in that it can sample only a limited portion (1/50,000) of the entire liver. Therefore, many noninvasive tests (NITs) have been developed to overcome the limitations of liver biopsy, and their use in clinical practice is gradually increasing [9]. Noninvasive imaging biomarkers can be broadly divided into ultrasoundbased tests, such as vibration-controlled transient elastography (VCTE) and shear wave elastography (SWE) or acoustic radiation force impulse imaging (ARFI), and magnetic resonance imaging (MRI)-based tests, such as magnetic resonance elastography (MRE) (Fig. 1) [10]. As each test has its strengths and limitations, understanding the characteristics of each test is essential to selecting the optimal modality for assessing the degree of liver fibrosis in patients with NAFLD.
As research on noninvasive imaging biomarkers continues, more efficient test equipment is expected to be developed and utilized in the future. In particular, methods that utilize artificial intelligence (AI), which have recently been in the spotlight, are expected to increase the accuracy and maximize the efficiency of existing inspection equipment [11]. Recent studies on the use of AI or deep learning methods in evaluating the degree of liver fibrosis showed promising results [12,13].
This review describes the application and advantages of noninvasive imaging biomarkers that have been studied and used to evaluate liver fibrosis in patients with NAFLD, as well as the future prospects of such biomarkers.

ELASTOGRAPHY

Elastography techniques are used to evaluate the stage of fibrosis by quantifying the shear wave velocity or tissue displacement generated by an ultrasonic or physical impulse, which represents liver stiffness (LS) [14]. VCTE and MRE systems have mechanical drivers that generate shear waves and assess shear wave velocities using sonographic Doppler and magnetic resonance techniques, respectively [15]. High-frequency sonographic impulses generate shear waves in point SWE (pSWE), ARFI, and two-dimensional SWE (2D-SWE). Because different elastography techniques are based on different methods and use different frequencies, their values are not identical, and caution is required when interpreting the results. Therefore, the strengths and limitations of each modality must be considered (Table 1).

ULTRASOUND-BASED ELASTOGRAPHY

Vibration-controlled transient elastography

Technique

Transient elastography (FibroScan®; EchoSens, Paris, France) is an ultrasound-based elastography technique that is now a well-established noninvasive method for diagnosing and staging liver fibrosis in patients with NAFLD [16]. VCTE consists of a 3.5-MHz ultrasound transducer installed on the axis of a low-amplitude vibrator and utilizes monodimensional ultrasound to determine LS by measuring the velocity of low-frequency elastic shear waves propagating through the liver [17]. For a VCTE result to be reliable, a minimum of 10 valid measurements are required, and the ratio of the median valid LS measurement to the interquartile range (IQR) should be ≤0.3 [18].

Strengths and limitations

A transient elastography test can be completed in a relatively short time (generally within 5 minutes), and many studies have validated the reliability of this test in assessing liver fibrosis in patients with NAFLD [19]. Transient elastography also has excellent intraobserver and interobserver variability [20]. However, transient elastography has the following limitations: the optimal cutoff point is unclear; measurements may be impossible in patients with obesity; the scan results may be unreliable in the hands of inexperienced operators; and the diagnostic accuracy is limited in the early stages of fibrosis [21].

Clinical applications

Detection and staging of liver fibrosis

Several recent studies have investigated the ideal cutoff value in VCTE to confirm significant liver fibrosis in patients with NAFLD [22-27]. In those studies, the average body mass index (BMI) of patients with NAFLD was 27.1–34.8 kg/m2, and the BMI of patients in Asian studies was relatively lower than that in Western studies. The LS value measured by VCTE indicating the presence of significant liver fibrosis (F2) in patients with NAFLD ranged from 7.7 to 9.8 kilopascals (kPa), and the proportion of patients with significant liver fibrosis ranged from 30.9% to 70.8% of the study population. In addition, the LS value indicating the presence of advanced liver fibrosis or cirrhosis (F3 or higher) ranged from 7.3 to 12.5 kPa, which showed an acceptable area under the receiver operating characteristic curve (AUROC) values (0.80–0.92) (Table 2).

Prediction of liver-related outcomes

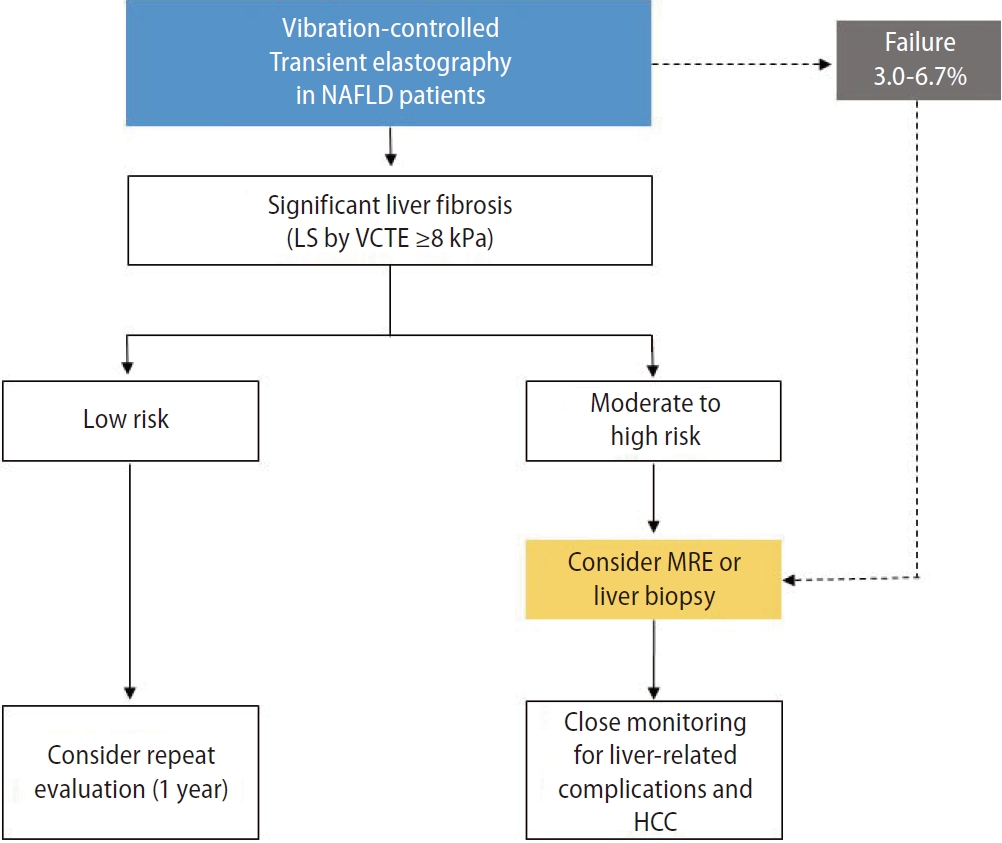
Recent studies have shown that baseline LS values measured by VCTE accurately predict the occurrence of liver decompensation, and higher baseline LS values can predict the development of liver-related events in patients with NAFLD [28,29]. In a multicenter cohort study that analyzed liver-related outcomes based on LS values measured by VCTE, baseline LS values were independently associated with the occurrence of hepatic decompensation (hazard ratio [HR]=1.03), HCC (HR=1.03), and liver-related death (HR=1.02) [29]. In addition, an increase of >20% in the LS value during a mean follow-up period of 35 months was strongly associated with the risk of liver-related events and death, thus showing that LS values measured by VCTE are useful in predicting liver-related outcomes [29]. However, owing to the limitations inherent in retrospective studies, the study did not follow a standardized protocol for VCTE follow-up and could not accurately identify the use of alcohol and other drugs. Therefore, future prospective and validation studies are needed to clarify the association between LS values measured by VCTE and liver-related outcomes (Fig. 2).

Point shear wave elastography/acoustic radiation force impulse imaging

Technique

pSWE and ARFI are ultrasound-based elastography methods that enable the quantitative assessment of tissue stiffness. LS measurement with pSWE and ARFI is performed in the right lobe of the liver through the intercostal space. After selecting a region of interest (ROI), the shear wave velocity is measured within the defined region using ultrasound tracking beams laterally adjacent to a single push beam [30]. For the results of pSWE and ARFI to be reliable, the IQR/liver spasticity should be <30% [31-33].

Strengths and limitations

Similar to VCTE, several meta-analysis studies have confirmed that pSWE and ARFI have good diagnostic accuracy for significant liver fibrosis, with a mean AUROC of 0.84–0.87, and excellent diagnostic accuracy for cirrhosis, with a mean AUROC of 0.91–0.94 [31,33]. In addition, pSWE and ARFI have good intraobserver and interobserver agreement, with an intraclass correlation coefficient of between 0.84 and 0.87 [34,35]. In addition, unlike VCTE, the accuracy of pSWE and ARFI is generally not limited by obesity or interfering structures such as blood vessels or the biliary tract, as the ROI can be manually positioned [30]. However, the disadvantages of pSWE and ARFI are that the size of the ROI is smaller than that in VCTE and the quality criteria are less evaluated.

Clinical applications

Detection and staging of liver fibrosis

Several studies have demonstrated the clinical application of pSWE and ARFI through noninvasive imaging biomarkers and the results showed that pSWE and ARFI are suitable diagnostic tools with higher diagnostic accuracy for advanced liver fibrosis (F3–4) than low-grade fibrosis (F1–2) [36,37]. However, studies on pSWE and ARFI have been mainly monocentric retrospective studies; therefore, longitudinal validation in chronic liver diseases, especially NAFLD, is required to develop standardized quality criteria.

Two-dimensional shear wave elastography

Technique

Real-time 2D-SWE is performed rather similarly to pSWE and ARFI. It combines the initiation of a radiation force in tissues using focused ultrasonic beams and the acquisition of transiently propagating resultant shear waves in real-time with a high-frequency ultrasound imaging sequence [38]. In 2D-SWE, a two-dimensional parametric color map is generated by combining several shear waves over time with rapid ultrasound acquisition. Similar to pSWE and ARFI, 2D-SWE allows the operator to select the size and location of the ROI. When the operator “samples” a specific area within a color map, the shear-wave velocity is measured to obtain a quantitative measure of tissue elasticity using proprietary software (Aixplorer®; Supersonic Imaging, Aix en Provence, France) [39].

Strengths and limitations

The advantage of 2D-SWE is that it allows the operator to select the size and location of the ROI, thereby permitting the evaluation of the elasticity profile of a larger tissue section in a single acquisition [40]. In addition, 2D-SWE has the following advantages over pSWE and ARFI: qualitative (color-coded) and quantitative measurement, easier and more manageable measurement, and stability of the measured value [41,42]. However, 2D-SWE has some limitations, including the subjective nature of the color scale, potential bias when selecting the ROI, and a lack of meta-analysis confirming its clinical applications.

Clinical applications

Detection and staging of liver fibrosis

Several recent studies have confirmed that LS measured by 2D-SWE strongly correlates with the stage of liver fibrosis on liver biopsy in patients with NAFLD [43]. According to a meta-analysis conducted in Europe, 2D-SWE has good diagnostic performance for significant liver fibrosis (≥F2, AUROC=0.86) and excellent diagnostic performance for severe fibrosis (≥F3, AUROC=0.93) and cirrhosis (F4, AUROC=0.92). The optimal cutoff values for diagnosing significant liver fibrosis and cirrhosis were reported to be 7.1 and 13.0 kPa, respectively. In addition, the AUROC for the diagnosis of significant liver fibrosis (P=0.001) and cirrhosis (P=0.022) with 2D-SWE was higher than that with VCTE [44]. However, as studies on the clinical application of 2D-SWE and comparative studies with other noninvasive methods are lacking, follow-up studies are needed.

MAGNETIC RESONANCE IMAGING-BASED ELASTOGRAPHY

Technique

Liver MRE can be performed using existing magnetic resonance scanners. The setup includes an active pneumatic mechanical driver located outside the scanning room and a connected passive driver placed on the liver [45]. The active driver generates continuous acoustic vibrations that are transmitted to the passive driver and subsequently to the abdomen, including the liver. These waves produce microscopic shear displacement of tissues, which is visualized using MRE sequences as propagating shear waves [46]. Subsequently, a magnitude image revealing the anatomy of the upper abdomen and a phase-contrast image showing shear waves at the same level are reconstructed, and grayscale and colored stiffness maps, also known as elastograms, are produced.
Thereafter, readers draw the ROI within the confidence map of the liver, avoiding the liver edge, artifacts, fissures, fossa, and regions of wave interference [45]. The mean LS value is calculated using ROIs on four slices. The LS value measured by MRE is expressed in kPa, representing both the elasticity and viscosity of the tissue.

Strengths and limitations

MRE can examine the entire liver, and technical failure occurs in <5% of the examinations [47-49]. MRE measurements are highly reproducible, with robust intraobserver and interobserver agreements [50-53]. The LS value measured by MRE is not significantly affected by hepatic steatosis, and MRE can measure LS in patients with obesity [54-57]. In addition, hepatic inflammation does not affect the accuracy of MRE in patients with NAFLD [55].
The most common cause of technical failure in MRI is iron overload [55]. Poor transmission of shear waves into the liver because of massive ascites increased subcutaneous fat thickness, and poor contact between the passive driver and the abdominal wall also led to a measurement failure. Inconsistent breath-holding and motion during the sequence are common causes of technical failure in patients with massive ascites [45]. The heterogeneity of fibrosis progression in different liver lesions may lead to inaccurate LS measurements, particularly in small ROIs [58]. MRE cannot differentiate LS caused by congestion from that caused by increased vascular pressure; thus, the LS value measured by MRE should be carefully interpreted [59]. Differences in MRI specifications and vendors among institutions and studies are another concern in the interpretation of LS values measured by MRE. Finally, considering its cost and limited availability, MRE cannot be generally used in clinical practice at present.

Clinical applications

Detection and staging of liver fibrosis

Multiple studies have demonstrated that MRE has excellent accuracy in diagnosing and stratifying liver fibrosis in patients with NAFLD, predicting significant or advanced liver fibrosis and cirrhosis with consistent AUROC values of >0.90 (Table 3) [60-63]. A recent meta-analysis showed the excellent accuracy of MRE, with an AUROC of 0.96 for advanced liver fibrosis and 0.92 for cirrhosis and LS cutoff values of 3.62–4.8 and 4.15–6.7 kPa, respectively [58]. A meta-analysis of nine studies that included 232 patients with NAFLD suggested reliable LS cutoff values of 2.88, 3.54, 3.77, and 4.09 kPa for detecting fibrosis stages 1, 2, 3, and 4, respectively [55].
In a recent meta-analysis with individual data of 230 patients with biopsy-proven NAFLD, MRE outperformed VCTE in detecting all stages of fibrosis (AUROC for fibrosis stage ≥1, 0.87 vs. 0.82 [P=0.04]; stage ≥2, 0.92 vs. 0.87 [P=0.03]; stage ≥3, 0.93 vs. 0.84 [P=0.001]; and stage ≥4, 0.94 vs. 0.84 [P=0.005]) [64]. Comparative studies between MRE and pSWE are limited; however, one study demonstrated that MRE was more accurate than pSWE in diagnosing any fibrosis stage in patients with NAFLD, especially in those with obesity [56]. A recent study demonstrated that MRE was more accurate than 2D-SWE in diagnosing stage ≥1 and ≥2 fibrosis but not stages ≥3 or 4 fibrosis [27]. Other MRI techniques, including diffusion-weighted imaging or contrast-enhanced MRI, were also reported to be less accurate than MRE in assessing liver fibrosis [65,66]. Consequently, the LS value measured by MRE can be considered the most accurate noninvasive imaging biomarker for detecting all stages of fibrosis (Table 4).
Recently, noninvasive LS-based models combining two different biomarkers have shown promising results in identifying patients with significant liver fibrosis, with increased positive predictive value (PPV), thereby reducing screening failure rates in clinical trials and reducing unnecessary liver biopsies [67-69]. In previous studies, MEFIB (MRE plus fibrosis-4 [FIB-4]) had a significantly higher diagnostic accuracy than MRE alone and the FIB-4 index alone [67]. Notably, a recent study compared MEFIB, MAST (MRI–aspartate aminotransferase), and FAST (FibroScan–aspartate aminotransferase) in detecting stage ≥2 fibrosis among patients with NAFLD and demonstrated the superiority of MEFIB (PPV, 95%; negative predictive value, 90%) over MAST and FAST (both P<0.001) [69].

Prediction of liver-related outcomes

Multiple retrospective studies have suggested that MRE can play a role in predicting the long-term prognosis of patients with NAFLD [70-72]. A recent meta-analysis of six cohorts, including 1,707 patients with a median follow-up of 3 years, investigated the association between the LS value measured by MRE and liver-related outcomes [67]. The HR for liver-related outcomes in patients with an LS value of 5–8 kPa was 11.0 (P<0.001) and that in patients with an LS value of ≥8 kPa was 15.9 (P<0.001), compared with those with an LS value of <5 kPa. Furthermore, the MEFIB index was developed using the identified best cutoff values for LS and the FIB-4 index (defined as positive when the LS value measured by MRE was ≥3.3 kPa and the FIB-4 index was ≥1.6). A positive MEFIB index had a robust association with liver-related outcomes (HR=20.6; P<0.001), and a negative MEFIB had a high negative predictive value for liver-related outcomes (99.1% at 5 years).
However, few retrospective studies have described the association of MRE with the clinical outcomes of patients with NAFLD. Therefore, future multicenter prospective studies are required to clarify the association between LS measured by MRE and liver-related clinical outcomes.

Emerging magnetic resonance imaging-based techniques

Advances in MRE techniques, including automated liver elasticity calculations and improvements in shear-wave delivery, are promising to provide a faster and more reliable evaluation of the liver. Three-dimensional (3D)-MRE is a newly developed imaging technique that assesses shear-wave propagation in multiple planes to avoid mathematical assumptions [63]. For the 3D-MRE examination, a separate motion-sensitized, multislice, spin-echo echo-planar imaging sequence is performed to assess shear-wave displacements along the x-, y-, and z-directions.
Although 3D-MRE is more accurate than 2D-MRE in predicting advanced liver fibrosis in patients with NAFLD, further validation is required to prove the benefits of this technique [63]. Multiparametric MRI measures shear stiffness, loss modulus, and MRI-derived fat fraction in a single scan. 3D-MRE incorporates a damping ratio at a lower frequency, which may further help in the detection of NASH and NASH-related fibrosis [73].

ARTIFICIAL INTELLIGENCE

Recently, AI and deep learning methods have been incorporated into MRE and shown encouraging results. AI can make quantitative assessments objective, reproducible, and less ambiguous. Traditional (supervised) machine learning and deep learning algorithms use approaches that are dependent on predefined information or ROIs determined by experts [11].
Deep learning does not rely on predefined features and does not always require a focus on ROIs. Convolutional neural networks (CNNs) are the most commonly applied deep learning methods in imaging analysis. In a retrospective study, LS measurements using an automated CNN-based method strongly agreed with manual ROI-based analysis across MRE systems (intraclass correlation coefficient, 0.98–0.99) and showed excellent discriminative performance for histology-determined stages of liver fibrosis (AUROC=0.89–0.93) in patients with NAFLD [74]. Considering the high incidence of NAFLD, CNN-based analysis may reduce reliance on expert image analysts.
Radiomic texture analysis is an evolving translational tool used to extract imaging information, which is prone to subjective and variable interpretation. A recent study applied texture analysis–derived parameters combined with machine learning to MRI-based techniques for the quantification of liver fibrosis [12]. Texture analysis and machine learning techniques were tested on T1- and T2-weighted MRI and MRE images of 62 participants with histologic evidence of chronic liver disease. The diagnostic accuracy for advanced liver fibrosis in T1-weighted MRI and MRE images was excellent (AUROC=0.82 vs. 0.92, P=0.41); however, T2-weighted MRI had a lower accuracy (AUROC=0.57).
Integrating AI into conventional noninvasive tools can provide an optimal balance between sensitivity and specificity in assessing liver fibrosis. Thus far, few studies have investigated the application of AI in the assessment of imaging biomarkers in NAFLD; however, studies evaluating liver fibrosis in patients with NAFLD are expected to gradually increase in the future.

ROLE OF NONINVASIVE TESTS IN DISEASE MONITORING

Repeated measurements using NITs can stratify the risk of liver-related events in patients with NAFLD. Currently, limited data are available on the impact of dynamic changes in LS values measured using NITs on the long-term outcomes of patients with NAFLD.
VCTE is useful for monitoring the severity of liver fibrosis not only in patients with NAFLD but also in patients with NASH-related cirrhosis, and LS can be a useful biomarker for predicting varices, HCC, and liver-related death [75]. According to a multinational study conducted in Europe in 790 patients with NAFLD-related compensated cirrhosis, the LS value measured by VCTE can effectively identify varices requiring treatment and reduce unnecessary endoscopies [76]. In addition, some studies have indicated that VCTE can be used to monitor fibrosis changes after treatment, although this should be confirmed by further studies using paired liver biopsies [77,78].
In a prospective cohort study, 102 patients with biopsy-proven NAFLD underwent contemporaneous MRE and liver biopsy at baseline, followed by repeat paired liver biopsy and MRE assessment [79]. A 15% increase in the LS value measured by MRE was associated with histologic fibrosis progression and progression from early to advanced liver fibrosis. A retrospective study of 128 patients with NAFLD who underwent at least two serial MRE examinations showed a significantly higher risk of the development of cirrhosis and decompensation or death in patients with a ≥19% increase in LS value from baseline than in those without [80].
Further studies are warranted to assess the implication of changes in LS measured using NITs over time on the risk of future liver-related events and mortality. Furthermore, although evidence is lacking and the optimal time interval remains to be determined, repeating NITs every 3 years in patients with early-stage NAFLD and every year in patients with advanced-stage disease seems reasonable.

CONCLUSION

Currently, the main utility of noninvasive imaging biomarkers in NAFLD is discriminating patients with significant or advanced liver fibrosis from those with mild or no fibrosis for prognosis prediction and clinical decision-making. VCTE is the most widely validated test; pSWE and 2D-SWE have comparable performance to VCTE; and MRE is currently considered the most accurate noninvasive tool for the detection and staging of liver fibrosis. However, the clinical use of these tests is usually determined by the availability of the technology and the local expertise at each institution.
A major limitation of NITs is their suboptimal accuracy in diagnosing fibrosis in the early stages and in adequately discriminating between adjacent fibrosis stages. Differentiating other processes that cause increased LS values, such as inflammation, biliary obstruction, cholestasis, passive congestion, and increased portal venous pressure, from liver fibrosis is another challenge. Research on noninvasive imaging biomarkers in NAFLD, especially concerning their use in screening and risk prediction, will continue as the prevalence of the disease increases and as newer treatment methods emerge. Finally, noninvasive imaging biomarkers, liver biopsies, and clinical parameters must be used in combination for the accurate assessment of the fibrosis stage and risk stratification in patients with NAFLD.

ACKNOWLEDGMENTS

This research was supported in part by a National Research Foundation of Korea (NRF) grant funded by the Ministry of Science and ICT (grant no. 2018R1A5A2025286 and 2022R1I- 1A1A01065244), the Technology Innovation Program (or Industrial Strategic Technology Development Program-Bioindustry Strategic Technology Development Program, grant no. 20013712) funded by the Ministry of Trade, Industry & Energy (MOTIE, Korea).

FOOTNOTES

Authors’ contribution
Conception and design of the study: J.H. Yu, H.A. Lee, and S.U. Kim; Drafting or revision of the manuscript: J.H. Yu, H.A. Lee, and S.U. Kim; Approval of the final version of the manuscript: J.H. Yu, H.A. Lee, and S.U. Kim.
Conflicts of Interest
Seung Up Kim served as an advisory committee member for Gilead Sciences, GSK, Bayer, and Eisai. He is a speaker for Gilead Sciences, GSK, Bayer, Eisai, Abbive, EchoSens, MSD, and Bristol-Myers Squibb. He also received a research grant from Abbive and Bristol-Myers Squibb. The other authors declare that they have no conflicts of interest.

Figure 1.
Currently used noninvasive imaging biomarkers in NAFLD. NAFLD, nonalcoholic fatty liver disease; SWE, shear wave elastography.

cmh-2022-0436f1.jpg
Figure 2.
Algorithm for risk discrimination in patients with NAFLD using noninvasive imaging biomarkers. NAFLD, nonalcoholic fatty liver disease; LS, liver stiffness; VCTE, vibration-controlled transient elastography; MRE, magnetic resonance elastography; HCC, hepatocellular carcinoma.

cmh-2022-0436f2.jpg
Table 1.
Strengths and limitations of noninvasive imaging tests for liver fibrosis in NAFLD
Methods Validation Reliability Reliability criteria Indeterminate cases Failure rate Factors related to failure Invalid result rate Confounders
TE Fibrosis stage, liver-related outcomes 0.99 Yes 30–40% 3–14% Obesity (less with XL probe), ascites 1–9% Acute hepatitis, cholestasis, food ingestion, obesity, congestion
pSWE Fibrosis stage 0.98 Yes NA 0–1% Obesity 16–24% Acute hepatitis, food ingestion, obesity,
2D-SWE Fibrosis stage 0.98–1.0 No NA 1–13% Obesity 0% Acute hepatitis, food ingestion
MRE Fibrosis stage, liver-related outcomes 0.99 Yes NA <5% Massive ascites, poor contact between the passive driver and the abdominal wall, inconsistent breath holding and motion, claustrophobia, inability to fit in the MRI machine Negligible Iron overload, acute hepatitis, massive ascites

NAFLD, nonalcoholic fatty liver disease; TE, transient elastography; pSWE, point shear wave elastography; 2D-SWE, two-dimensional shear wave elastography; MRE, magnetic resonance elastography; NA, not available; MRI, magnetic resonance imaging.

Table 2.
Performance of transient elastography in patients with NAFLD
Study Number Country Mean BMI (kg/m2) Patients with advanced fibrosis (F≥2), n (%) AUROC for F≥2 (95% CI) Cut off for F≥2 Sensitivity/specificity AUROC for F≥3 (95% CI) Cut off for F≥3 Sensitivity/specificity
Cassinotto et al. [23] (2016) 291 France 32.1 206, 70.8% 0.82 9.8 0.60/0.90 0.86 12.5 0.57/0.90
Lee et al. [25] (2017) 94 Korea 27.1 46, 47.9% 0.76 7.4 0.62/0.92 0.87 8 0.82/0.85
Park et al. [24] (2017) 94 United States 30.4 29, 30.9% 0.86 6.9 0.79/0.85 0.80 7.3 0.78/0.78
Furlan et al. [26] (2020) 62 United States 34.8 44, 70.1% 0.77 8.8 0.51/0.94 0.86 10.5 0.50/0.92
Eddowes et al. [22] (2019) 450 United Kingdom 33.8 225, 60% 0.77 8.2 0.71/0.70 0.80 9.7 0.71/0.75
Imajo et al. [27] (2022) 201 Japan 27.1 - 0.89 8.4 0.86/0.74 0.92 9.7 0.84/0.85

NAFLD, nonalcoholic fatty liver disease; AUROC, area under the receiver operating characteristics curve; CI, confidence interval; BMI, body mass index.

Table 3.
Performance of magnetic resonance elastography in assessing liver fibrosis in patients with NAFLD
Study Number Country Mean BMI (kg/m2) Patients with advanced fibrosis (F≥2), n (%) AUROC for F≥2 (95% CI) Cut off for F≥2 Sensitivity/specificity AUROC for F≥3 (95% CI) Cut off for F≥3 Sensitivity/specificity
Imajo et al. [27] (2022) 201 Japan 27.1 - 0.927 3.19 0.90/0.81 0.929 3.90 0.83/0.92
Cui et al. [56] (2016) 125 United States 31.8 26.4 0.885 3.62 0.67/0.96 0.934 3.62 0.91/0.93
Loomba et al. [61] (2014) 117 United States 32.4 29.9 0.856 3.58 0.66/0.92 0.894 4.67 0.8/0.94
Costa-Silva et al. [62] (2018) 90 Brazil 32.2 24.4 0.932 4.14 0.92/0.97 0.928 4.39 0.91/0.97
Loomba et al. [63] (2016) 100 United States 32.1 27.0 0.878 3.65 - 0.921 3.80 0.87/0.94

NAFLD, nonalcoholic fatty liver disease; AUROC, area under the receiver operating characteristics curve; CI, confidence interval; BMI, body mass index.

Table 4.
Diagnostic accuracy of noninvasive imaging biomarkers for each stage of fibrosis in NAFLD
Method TE pSWE 2D-SWE MRE
Stage ≥2 fibrosis
 AUROC 0.77 0.87 0.86 0.92
 Sensitivity (%) 71.0 79.0 94.0 84.9
 Specificity (%) 70.0 85.0 52.0 85.4
 PPV (%) 78.0 91.0 65.1 79.8
 NPV (%) 61.0 66.0 86.7 89.3
Stage ≥3 fibrosis
 AUROC 0.80 0.91 0.93 0.93
 Sensitivity (%) 71.0 92.0 93.0 82.5
 Specificity (%) 75.0 86.0 81.0 83.2
 PPV (%) 63.0 82.0 77.0 61.8
 NPV (%) 81.0 89.0 97.4 93.5

NAFLD, nonalcoholic fatty liver disease; TE, transient elastography; pSWE, point shear-wave elastography; 2D-SWE, two-dimensional shear-wave elastography; MRE, magnetic resonance elastography; AUROC, area under the receiver operating characteristic curve; PPV, positive predictive value; NPV, negative predictive value.

Abbreviations

NAFLD
nonalcoholic fatty liver disease
NASH
nonalcoholic steatohepatitis
HCC
hepatocellular carcinoma
NIT
noninvasive tes t
VCTE
vibration- controlled transient elastography
IQR
interquartile range
SWE
shear wave elastography
ARFI
acoustic radiation force impulse imaging
MRE
magnetic resonance elastography
AI
artificial intelligence
pSWE
point shear wave elastography
2D-SWE
two-dimensional shear wave elastography
BMI
body mass index
LS
liver stiffness
kPa
kilopascals
AUROC
area under the receiver operating characteristic curve
ROI
region of interest
PPV
positive predictive value
HR
hazard ratio
FIB-4 index
fibrosis-4 index
CNN
convolutional neural networks
3D
three-dimensional
MRI
magnetic resonance imaging

REFERENCES

1. Kang SH, Lee HW, Yoo JJ, Cho Y, Kim SU, Lee TH, et al. KASL clinical practice guidelines: management of nonalcoholic fatty liver disease. Clin Mol Hepatol 2021;27:363-401.
crossref pmid pmc pdf
2. Dulai PS, Singh S, Patel J, Soni M, Prokop LJ, Younossi Z, et al. Increased risk of mortality by fibrosis stage in nonalcoholic fatty liver disease: systematic review and meta-analysis. Hepatology 2017;65:1557-1565.
crossref pmid pmc pdf
3. Jun DW. An analysis of polygenic risk scores for non-alcoholic fatty liver disease. Clin Mol Hepatol 2021;27:446-447.
crossref pmid pmc pdf
4. Kim HY. Recent advances in nonalcoholic fatty liver disease metabolomics. Clin Mol Hepatol 2021;27:553-559.
crossref pmid pmc pdf
5. Wijarnpreecha K, Aby ES, Ahmed A, Kim D. Evaluation and management of extrahepatic manifestations of nonalcoholic fatty liver disease. Clin Mol Hepatol 2021;27:221-235.
crossref pmid pmc pdf
6. Taylor RS, Taylor RJ, Bayliss S, Hagström H, Nasr P, Schattenberg JM, et al. Association between fibrosis stage and outcomes of patients with nonalcoholic fatty liver disease: a systematic review and meta-analysis. Gastroenterology 2020;158:1611-1625 e12.
crossref pmid
7. Kanwal F, Shubrook JH, Adams LA, Pfotenhauer K, Wai-Sun Wong V, Wright E, et al. Clinical care pathway for the risk stratification and management of patients with nonalcoholic fatty liver disease. Gastroenterology 2021;161:1657-1669.
crossref pmid pmc
8. Soon G, Wee A. Updates in the quantitative assessment of liver fibrosis for nonalcoholic fatty liver disease: histological perspective. Clin Mol Hepatol 2021;27:44-57.
crossref pmid pmc pdf
9. European Association for the Study of the Liver; Clinical Practice Guideline Panel, Chair; EASL Governing Board representative, Panel members. EASL clinical practice guidelines on non-invasive tests for evaluation of liver disease severity and prognosis - 2021 update. J Hepatol 2021;75:659-689.
crossref pmid
10. Anstee QM, Castera L, Loomba R. Impact of non-invasive biomarkers on hepatology practice: past, present and future. J Hepatol 2022;76:1362-1378.
crossref pmid
11. Dinani AM, Kowdley KV, Noureddin M. Application of artificial intelligence for diagnosis and risk stratification in NAFLD and NASH: the state of the art. Hepatology 2021;74:2233-2240.
crossref pmid pdf
12. Schawkat K, Ciritsis A, von Ulmenstein S, Honcharova-Biletska H, Jüngst C, Weber A, et al. Diagnostic accuracy of texture analysis and machine learning for quantification of liver fibrosis in MRI: correlation with MR elastography and histopathology. Eur Radiol 2020;30:4675-4685.
crossref pmid pdf
13. Nam D, Chapiro J, Paradis V, Seraphin TP, Kather JN. Artificial intelligence in liver diseases: Improving diagnostics, prognostics and response prediction. JHEP Rep 2022;4:100443.
crossref pmid pmc
14. Loomba R, Adams LA. Advances in non-invasive assessment of hepatic fibrosis. Gut 2020;69:1343-1352.
crossref pmid pmc
15. Yin M, Venkatesh SK. Ultrasound or MR elastography of liver: which one shall I use? Abdom Radiol (NY) 2018;43:1546-1551.
crossref pmid pmc pdf
16. Siddiqui MS, Vuppalanchi R, Van Natta ML, Hallinan E, Kowdley KV, Abdelmalek M, et al. Vibration-controlled transient elastography to assess fibrosis and steatosis in patients with nonalcoholic fatty liver disease. Clin Gastroenterol Hepatol 2019;17:156-163 e2.
crossref pmid pmc
17. de Lédinghen V, Vergniol J. Transient elastography (FibroScan). Gastroenterol Clin Biol 2008;32(6 Suppl 1):58-67.
crossref pmid
18. Lucidarme D, Foucher J, Le Bail B, Vergniol J, Castera L, Duburque C, et al. Factors of accuracy of transient elastography (fibroscan) for the diagnosis of liver fibrosis in chronic hepatitis C. Hepatology 2009;49:1083-1089.
crossref pmid
19. Jung KS, Kim SU. Clinical applications of transient elastography. Clin Mol Hepatol 2012;18:163-173.
crossref pmid pmc
20. Wong VW, Chan HL. Transient elastography. J Gastroenterol Hepatol 2010;25:1726-1731.
crossref pmid
21. Lee HA, Kim SS, Choi JY, Seo YS, Park BJ, Sim KC, et al. Magnetic resonance imaging improves stratification of fibrosis and steatosis in patients with chronic liver disease. Abdom Radiol (NY) 2022;47:3733-3745.
crossref pmid pdf
22. Eddowes PJ, Sasso M, Allison M, Tsochatzis E, Anstee QM, Sheridan D, et al. Accuracy of FibroScan controlled attenuation parameter and liver stiffness measurement in assessing steatosis and fibrosis in patients with nonalcoholic fatty liver disease. Gastroenterology 2019;156:1717-1730.
crossref pmid
23. Cassinotto C, Boursier J, de Lédinghen V, Lebigot J, Lapuyade B, Cales P, et al. Liver stiffness in nonalcoholic fatty liver disease: a comparison of supersonic shear imaging, FibroScan, and ARFI with liver biopsy. Hepatology 2016;63:1817-1827.
crossref pmid
24. Park CC, Nguyen P, Hernandez C, Bettencourt R, Ramirez K, Fortney L, et al. Magnetic resonance elastography vs transient elastography in detection of fibrosis and noninvasive measurement of steatosis in patients with biopsy-proven nonalcoholic fatty liver disease. Gastroenterology 2017;152:598-607 e2.
crossref pmid pmc
25. Lee MS, Bae JM, Joo SK, Woo H, Lee DH, Jung YJ, et al. Prospective comparison among transient elastography, supersonic shear imaging, and ARFI imaging for predicting fibrosis in nonalcoholic fatty liver disease. PLoS One 2017;12:e0188321.
crossref pmid pmc
26. Furlan A, Tublin ME, Yu L, Chopra KB, Lippello A, Behari J. Comparison of 2D Shear wave elastography, transient elastography, and MR elastography for the diagnosis of fibrosis in patients with nonalcoholic fatty liver disease. AJR Am J Roentgenol 2020;214:W20-W26.
crossref pmid
27. Imajo K, Honda Y, Kobayashi T, Nagai K, Ozaki A, Iwaki M, et al. Direct comparison of US and MR elastography for staging liver fibrosis in patients with nonalcoholic fatty liver disease. Clin Gastroenterol Hepatol 2022;20:908-917 e11.
crossref pmid
28. Shili-Masmoudi S, Wong GL, Hiriart JB, Liu K, Chermak F, Shu SS, et al. Liver stiffness measurement predicts long-term survival and complications in non-alcoholic fatty liver disease. Liver Int 2020;40:581-589.
crossref pmid pdf
29. Petta S, Sebastiani G, Viganò M, Ampuero J, Wai-Sun Wong V, Boursier J, et al. Monitoring occurrence of liver-related events and survival by transient elastography in patients with nonalcoholic fatty liver disease and compensated advanced chronic liver disease. Clin Gastroenterol Hepatol 2021;19:806-815 e5.
crossref pmid
30. Ferraioli G, Tinelli C, Dal Bello B, Zicchetti M, Filice G, Filice C, et al. Accuracy of real-time shear wave elastography for assessing liver fibrosis in chronic hepatitis C: a pilot study. Hepatology 2012;56:2125-2133.
crossref pmid
31. Friedrich-Rust M, Nierhoff J, Lupsor M, Sporea I, FierbinteanuBraticevici C, Strobel D, et al. Performance of acoustic radiation force impulse imaging for the staging of liver fibrosis: a pooled meta-analysis. J Viral Hepat 2012;19:e212-e219.
crossref pmid
32. Fraquelli M, Baccarin A, Casazza G, Conti CB, Giunta M, Massironi S, et al. Liver stiffness measurement reliability and main determinants of point shear-wave elastography in patients with chronic liver disease. Aliment Pharmacol Ther 2016;44:356-365.
crossref pmid
33. Nierhoff J, Chávez Ortiz AA, Herrmann E, Zeuzem S, FriedrichRust M. The efficiency of acoustic radiation force impulse imaging for the staging of liver fibrosis: a meta-analysis. Eur Radiol 2013;23:3040-3053.
crossref pmid pdf
34. Myers RP, Crotty P, Pomier-Layrargues G, Ma M, Urbanski SJ, Elkashab M. Prevalence, risk factors and causes of discordance in fibrosis staging by transient elastography and liver biopsy. Liver Int 2010;30:1471-1480.
crossref pmid
35. Bota S, Sporea I, Sirli R, Popescu A, Danila M, Costachescu D. Intra- and interoperator reproducibility of acoustic radiation force impulse (ARFI) elastography--preliminary results. Ultrasound Med Biol 2012;38:1103-1108.
crossref pmid
36. Argalia G, Ventura C, Tosi N, Campioni D, Tagliati C, Tufillaro M, et al. Comparison of point shear wave elastography and transient elastography in the evaluation of patients with NAFLD. Radiol Med 2022;127:571-576.
crossref pmid pdf
37. Jiang W, Huang S, Teng H, Wang P, Wu M, Zhou X, et al. Diagnostic accuracy of point shear wave elastography and transient elastography for staging hepatic fibrosis in patients with non-alcoholic fatty liver disease: a meta-analysis. BMJ Open 2018;8:e021787.
crossref pmid pmc
38. Barr RG. Shear wave liver elastography. Abdom Radiol (NY) 2018;43:800-807.
crossref pmid pdf
39. Lupșor-Platon M, Badea R, Gersak M, Maniu A, Rusu I, Suciu A, et al. Noninvasive assessment of liver diseases using 2D shear wave elastography. J Gastrointestin Liver Dis 2016;25:525-532.
crossref pmid pdf
40. Karagiannakis DS, Voulgaris T, Angelopoulos T, Ioannidou P, Cholongitas E, Vlachogiannakos J, et al. Comparative utility of transient and 2D shear wave elastography for the assessment of liver fibrosis in clinical practice. J Digit Imaging 2021;34:1342-1348.
crossref pmid pmc pdf
41. Ronot M, Ferraioli G, Müller HP, Friedrich-Rust M, Filice C, Vilgrain V, et al. Comparison of liver stiffness measurements by a 2D-shear wave technique and transient elastography: results from a European prospective multi-centre study. Eur Radiol 2021;31:1578-1587.
crossref pmid pdf
42. Kumada T, Toyoda H, Yasuda S, Ogawa S, Gotoh T, Ito T, et al. Liver stiffness measurements by 2D shear-wave elastography: effect of steatosis on fibrosis evaluation. AJR Am J Roentgenol 2022;219:604-612.
crossref pmid
43. Chimoriya R, Piya MK, Simmons D, Ahlenstiel G, Ho V. The use of two-dimensional shear wave elastography in people with obesity for the assessment of liver fibrosis in non-alcoholic fatty liver disease. J Clin Med 2020;10:95.
crossref pmid pmc
44. Herrmann E, de Lédinghen V, Cassinotto C, Chu WC, Leung VY, Ferraioli G, et al. Assessment of biopsy-proven liver fibrosis by two-dimensional shear wave elastography: an individual patient data-based meta-analysis. Hepatology 2018;67:260-272.
crossref pmid pmc pdf
45. Idilman IS, Li J, Yin M, Venkatesh SK. MR elastography of liver: current status and future perspectives. Abdom Radiol (NY) 2020;45:3444-3462.
crossref pmid pmc pdf
46. Guglielmo FF, Venkatesh SK, Mitchell DG. Liver MR elastography technique and image interpretation: pearls and pitfalls. Radiographics 2019;39:1983-2002.
crossref pmid
47. Wagner M, Corcuera-Solano I, Lo G, Esses S, Liao J, Besa C, et al. Technical failure of MR elastography examinations of the liver: experience from a large single-center study. Radiology 2017;284:401-412.
crossref pmid pmc
48. Singh S, Venkatesh SK, Wang Z, Miller FH, Motosugi U, Low RN, et al. Diagnostic performance of magnetic resonance elastography in staging liver fibrosis: a systematic review and metaanalysis of individual participant data. Clin Gastroenterol Hepatol 2015;13:440-451 e6.
crossref pmid pmc
49. Singh S, Venkatesh SK, Keaveny A, Adam S, Miller FH, Asbach P, et al. Diagnostic accuracy of magnetic resonance elastography in liver transplant recipients: a pooled analysis. Ann Hepatol 2016;15:363-376.
crossref pmc
50. Venkatesh SK, Wang G, Teo LL, Ang BW. Magnetic resonance elastography of liver in healthy Asians: normal liver stiffness quantification and reproducibility assessment. J Magn Reson Imaging 2014;39:1-8.
crossref pmid
51. Shire NJ, Yin M, Chen J, Railkar RA, Fox-Bosetti S, Johnson SM, et al. Test-retest repeatability of MR elastography for noninvasive liver fibrosis assessment in hepatitis C. J Magn Reson Imaging 2011;34:947-955.
crossref pmid pmc
52. Lee Yj, Lee JM, Lee JE, Lee KB, Lee ES, Yoon JH, et al. MR elastography for noninvasive assessment of hepatic fibrosis: reproducibility of the examination and reproducibility and repeatability of the liver stiffness value measurement. J Magn Reson Imaging 2014;39:326-331.
crossref pmid
53. Serai SD, Obuchowski NA, Venkatesh SK, Sirlin CB, Miller FH, Ashton E, et al. Repeatability of MR elastography of liver: a meta-analysis. Radiology 2017;285:92-100.
crossref pmid pmc
54. Yin M, Talwalkar JA, Glaser KJ, Manduca A, Grimm RC, Rossman PJ, et al. Assessment of hepatic fibrosis with magnetic resonance elastography. Clin Gastroenterol Hepatol 2007;5:1207-1213 e2.
crossref pmid pmc
55. Singh S, Venkatesh SK, Loomba R, Wang Z, Sirlin C, Chen J, et al. Magnetic resonance elastography for staging liver fibrosis in non-alcoholic fatty liver disease: a diagnostic accuracy systematic review and individual participant data pooled analysis. Eur Radiol 2016;26:1431-1440.
crossref pmid pmc pdf
56. Cui J, Heba E, Hernandez C, Haufe W, Hooker J, Andre MP, et al. Magnetic resonance elastography is superior to acoustic radiation force impulse for the diagnosis of fibrosis in patients with biopsy-proven nonalcoholic fatty liver disease: a prospective study. Hepatology 2016;63:453-461.
crossref pmid pmc pdf
57. Patel K, Sebastiani G. Limitations of non-invasive tests for assessment of liver fibrosis. JHEP Rep 2020;2:100067.
crossref pmid pmc
58. Xiao G, Zhu S, Xiao X, Yan L, Yang J, Wu G. Comparison of laboratory tests, ultrasound, or magnetic resonance elastography to detect fibrosis in patients with nonalcoholic fatty liver disease: a meta-analysis. Hepatology 2017;66:1486-1501.
crossref pmid pdf
59. Venkatesh SK, Yin M, Ehman RL. Magnetic resonance elastography of liver: technique, analysis, and clinical applications. J Magn Reson Imaging 2013;37:544-555.
crossref pmid pmc
60. Kim D, Kim WR, Talwalkar JA, Kim HJ, Ehman RL. Advanced fibrosis in nonalcoholic fatty liver disease: noninvasive assessment with MR elastography. Radiology 2013;268:411-419.
crossref pmid pmc
61. Loomba R, Wolfson T, Ang B, Hooker J, Behling C, Peterson M, et al. Magnetic resonance elastography predicts advanced fibrosis in patients with nonalcoholic fatty liver disease: a prospective study. Hepatology 2014;60:1920-1928.
crossref pmid pmc pdf
62. Costa-Silva L, Ferolla SM, Lima AS, Vidigal PVT, Ferrari TCA. MR elastography is effective for the non-invasive evaluation of fibrosis and necroinflammatory activity in patients with nonalcoholic fatty liver disease. Eur J Radiol 2018;98:82-89.
crossref pmid
63. Loomba R, Cui J, Wolfson T, Haufe W, Hooker J, Szeverenyi N, et al. Novel 3D magnetic resonance elastography for the noninvasive diagnosis of advanced fibrosis in NAFLD: a prospective study. Am J Gastroenterol 2016;111:986-994.
crossref pmid pmc pdf
64. Hsu C, Caussy C, Imajo K, Chen J, Singh S, Kaulback K, et al. Magnetic resonance vs transient elastography analysis of patients with nonalcoholic fatty liver disease: a systematic review and pooled analysis of individual participants. Clin Gastroenterol Hepatol 2019;17:630-637 e8.
crossref pmid pmc
65. Wu WP, Hoi CI, Chen RC, Lin CP, Chou CT. Comparison of the efficacy of Gd-EOB-DTPA-enhanced magnetic resonance imaging and magnetic resonance elastography in the detection and staging of hepatic fibrosis. Medicine (Baltimore) 2017;96:e8339.
crossref pmid pmc
66. Wang QB, Zhu H, Liu HL, Zhang B. Performance of magnetic resonance elastography and diffusion-weighted imaging for the staging of hepatic fibrosis: a meta-analysis. Hepatology 2012;56:239-247.
crossref pmid
67. Ajmera V, Kim BK, Yang K, Majzoub AM, Nayfeh T, Tamaki N, et al. Liver stiffness on magnetic resonance elastography and the MEFIB index and liver-related outcomes in nonalcoholic fatty liver disease: a systematic review and meta-analysis of individual participants. Gastroenterology 2022;163:1079-1089 e5.
crossref pmid
68. Noureddin M, Truong E, Gornbein JA, Saouaf R, Guindi M, Todo T, et al. MRI-based (MAST) score accurately identifies patients with NASH and significant fibrosis. J Hepatol 2022;76:781-787.
crossref pmid
69. Kim BK, Tamaki N, Imajo K, Yoneda M, Sutter N, Jung J, et al. Head-to-head comparison between MEFIB, MAST, and FAST for detecting stage 2 fibrosis or higher among patients with NAFLD. J Hepatol 2022;77:1482-1490.
crossref pmid
70. Gidener T, Ahmed OT, Larson JJ, Mara KC, Therneau TM, Venkatesh SK, et al. Liver stiffness by magnetic resonance elastography predicts future cirrhosis, decompensation, and death in NAFLD. Clin Gastroenterol Hepatol 2021;19:1915-1924 e6.
crossref pmid pmc
71. Han MAT, Vipani A, Noureddin N, Ramirez K, Gornbein J, Saouaf R, et al. MR elastography-based liver fibrosis correlates with liver events in nonalcoholic fatty liver patients: a multicenter study. Liver Int 2020;40:2242-2251.
crossref pmid pdf
72. Tamaki N, Kurosaki M, Takahashi Y, Itakura Y, Inada K, Kirino S, et al. Liver fibrosis and fatty liver as independent risk factors for cardiovascular disease. J Gastroenterol Hepatol 2021;36:2960-2966.
crossref pmid pdf
73. Yin Z, Murphy MC, Li J, Glaser KJ, Mauer AS, Mounajjed T, et al. Prediction of nonalcoholic fatty liver disease (NAFLD) activity score (NAS) with multiparametric hepatic magnetic resonance imaging and elastography. Eur Radiol 2019;29:5823-5831.
crossref pmid pmc pdf
74. Cunha GM, Delgado TI, Middleton MS, Liew S, Henderson WC, Batakis D, et al. Automated CNN-based analysis versus manual analysis for mr elastography in nonalcoholic fatty liver disease: intermethod agreement and fibrosis stage discriminative performance. AJR Am J Roentgenol 2022;219:224-232.
crossref pmid
75. Stafylidou M, Paschos P, Katsoula A, Malandris K, Ioakim K, Bekiari E, et al. Performance of Baveno VI and expanded Baveno VI criteria for excluding high-risk varices in patients with chronic liver diseases: a systematic review and meta-analysis. Clin Gastroenterol Hepatol 2019;17:1744-1755 e11.
crossref pmid
76. Petta S, Sebastiani G, Bugianesi E, Viganò M, Wong VW, Berzigotti A, et al. Non-invasive prediction of esophageal varices by stiffness and platelet in non-alcoholic fatty liver disease cirrhosis. J Hepatol 2018;69:878-885.
crossref pmid
77. Zeng J, Cai S, Liu J, Xue X, Wu X, Zheng C. Dynamic changes in liver stiffness measured by transient elastography predict clinical outcomes among patients with chronic hepatitis B. J Ultrasound Med 2017;36:261-268.
crossref pmid pdf
78. Elsharkawy A, Alem SA, Fouad R, El Raziky M, El Akel W, Abdo M, et al. Changes in liver stiffness measurements and fibrosis scores following sofosbuvir based treatment regimens without interferon. J Gastroenterol Hepatol 2017;32:1624-1630.
crossref pmid pdf
79. Ajmera VH, Liu A, Singh S, Yachoa G, Ramey M, Bhargava M, et al. Clinical utility of an increase in magnetic resonance elastography in predicting fibrosis progression in nonalcoholic fatty liver disease. Hepatology 2020;71:849-860.
crossref pmid pmc pdf
80. Gidener T, Dierkhising RA, Mara KC, Therneau TM, Venkatesh SK, Ehman RL, et al. Change in serial liver stiffness measurement by magnetic resonance elastography and outcomes in NAFLD. Hepatology 2023;77:268-274.
crossref pmid pdf

Editorial Office
The Korean Association for the Study of the Liver
Room A1210, 53 Mapo-daero(MapoTrapalace, Dowha-dong), Mapo-gu, Seoul, 04158, Korea
TEL: +82-2-703-0051   FAX: +82-2-703-0071    E-mail: kasl@kams.or.kr
Copyright © The Korean Association for the Study of the Liver.         
COUNTER
TODAY : 1792
TOTAL : 1735687
Close layer