


Humans have been consuming fermented alcoholic beverages for more than 10,000 years, primarily to obtain safe drinking water and avoid bacterial contamination [1]. Alcoholic beverages are consumed widely throughout the world, and the health effect of alcohol use can have substantial public health implications [2]. Alcohol is responsible for tremendous perturbations in social and physical well-being worldwide and has been estimated to be the seventh leading risk factor for both morbidity and mortality [3].
A world leading medical journal has been publishing articles describing the ŌĆśsuperhumanŌĆÖ efforts to address the Global Burden of Disease (GBD) since 2010 [4]. This brief communication highlights that alcohol use is a major contributor to injuries, mortality, and the burden of disease, especially among the population aged 15ŌĆō49 years [5-8]. These findings provide a complementary picture to that obtained from the ŌĆśGlobal Status Report on Alcohol and Health 2018ŌĆÖ [9], published by the World Health Organization (WHO). Throughout the manuscript, we mainly use data from the WHO and the GBD.
In this review, we summarize previous efforts to investigate alcohol-attributable disease burden based on deaths and disability-adjusted life-years (DALYs) and the best ways to protect against harmful use of alcohol and promote health.
NO SAFE LEVEL OF ALCOHOL CONSUMPTION
The total burden attributable to alcohol use is larger than previous evidence has shown and increases with consumption [6]. Alcohol has a monotonic association with some cancers (oropharynx, larynx, esophagus, liver, etc.) but is reportedly associated with protection against diabetes, ischemic stroke, or coronary heart disease when consumed at a moderate level [10,11]. A shortage of estimates from observational studies identifying appropriate reference categories, adequately accounting for survival bias and other residual confounders, may lead to potential overestimation of the protective effects from light or moderate alcohol intake (Ōēż14 standard drinks/week for male and Ōēż7 standard drinks/week for female) [12]. Emerging research with methodological enhancements, including Mendelian randomization, pooled cohort studies, and multivariable adjusted meta-analyses, has shown no beneficial effect of alcohol consumption on mortality or cardiovascular outcomes [13,14]. In line with recent literature, a GBD study presents empirical evidence that there is no safe level of alcohol consumption [6]. Based on weighted relative risk curves for each health outcome associated with alcohol use, the level of consumption that minimizes health loss due to alcohol use is zero [6]. These new findings strongly suggest that alcohol policies aimed at total population-level consumption are needed to reduce the burden attributable to alcohol in a population [6].
ALCOHOL CONSUMPTION
In 2016, 32.5% of people worldwide were current drinkers [6]. Twenty-five percent of women are current drinkers, as are 39% of men in the previous 12 months (Table 1) [6]. The per capita alcohol consumption in the worldŌĆÖs population rose from 5.5 L of alcohol in 2005 to 6.4 L in 2010 [9], and it is expected to reach 7.6 L by 2030 [15]. The amount of alcohol consumed varies considerably by region and socio-demographic index (SDI), which reflects overall development [6]. The countries with the highest level of alcohol consumption are in the Eastern European region and have high SDI locations [6]. While alcohol consumption has been decreasing in the Western European region, it is increasing in the Western Pacific and South-East Asian regions, including the highly populated countries of China and India, which account for the increases (China: 4.1 L and 7.2 L in 2005 and 2016, respectively; India: 2.4 L and 5.7 L in 2005 and 2016, respectively) [9].
The prevalence of heavy episodic drinking (HED) has decreased globally from 22.6% in 2000 to 18.2% in 2016, but it is expected to increase to 23% in 2030 [15]. HED remains high at over 60%, especially in parts of Eastern Europe and in sub-Saharan African countries [9]. HED among young people (15ŌĆō19 years of age) is particularly prevalent (Ōēź20%) in Europe and high-income countries, including the USA, Canada, Australia, and New Zealand and in some South American countries, such as Chile and Argentina, where per capita alcohol consumption is relatively high [6].
THE ALCOHOL-ATTRIBUTABLE BURDEN OF DISEASE AND MORTALITY
Alcohol-attributable deaths and DALYs declined from 2000 to 2016 by 17.9% and 14.5%, respectively [8]. This decrease is less than the relative decreases in the rates of all deaths of 23.7% and all DALYs of 25.2% during the same period [8]. In 2016, 3.0 million death worldwide (2.3 million among men and 0.7 million among women) and 132 million DALYs (106 million among men and 26 million among women) were attributable to alcohol, representing 5.3% of all deaths and 5.0% of all DALYs [8,9]. This made alcohol the seventh major risk factor for death and disability globally in 2016 [8]. At the regional level, alcohol-attributable rates for death and DALYs are highest in the Eastern European and sub-Saharan African regions [8]. The proportions of alcohol-attributable deaths and DALYs are highest in the European region (10.1% of all deaths and 10.8% of all DALYs) and the Americas (5.5% of deaths and 6.7% of DALYs) [9].
THE ALCOHOL-ATTRIBUTABLE BURDEN OF PREMATURE MORTALITY
The alcohol-attributable burden is particularly borne among young adults, for whom alcohol ranks as the leading cause of premature deaths [8,9]. Alcohol use accounted for 7.2% of all premature mortality globally in 2016 [9]. Young persons are more disproportionately affected by alcohol than older persons, and the proportion of alcohol-attributable deaths is highest among the population aged 20ŌĆō39 years, representing 13.5% of all deaths in this age group [9]. More than 50% of all alcohol-attributable deaths occur in people younger than 60 years [8].
THE ALCOHOL-ATTRIBUTABLE BURDEN OF INJURIES
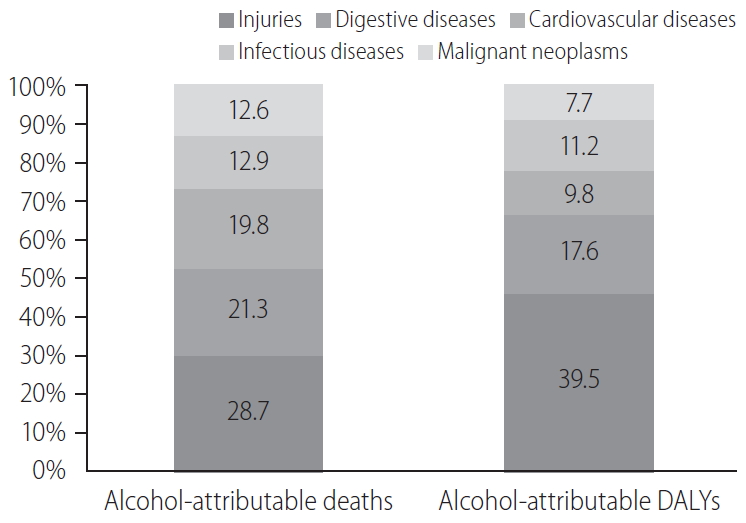
Acute alcohol intoxication negatively affects a number of cognitive functions, including memory, planning and complex motor control [16,17] and this loss can lead to unexpected behavior and injury. In 2016, injury was the leading cause of all deaths attributable to alcohol worldwide, accounting for 28.7% (Fig. 1) [9]. Similarly, injury is the leading contributor to the burden of disease caused by alcohol and accounts for approximately 40% of all alcohol-attributable DALYs [9]. Globally, 0.9 million injury deaths are attributable to alcohol [9], including road injuries (approximately 370,000 deaths), self-harm (approximately 150,000 deaths), interpersonal violence (approximately 90,000 deaths), and falls (approximately 80,000 deaths). Of the road traffic injuries, half of the deaths are among people other than drivers [9]. Geographically, the most alcohol-attributable injury deaths are in the African region and in the European region [9].
THE ALCOHOL-ATTRIBUTABLE BURDEN OF DIGESTIVE DISEASES
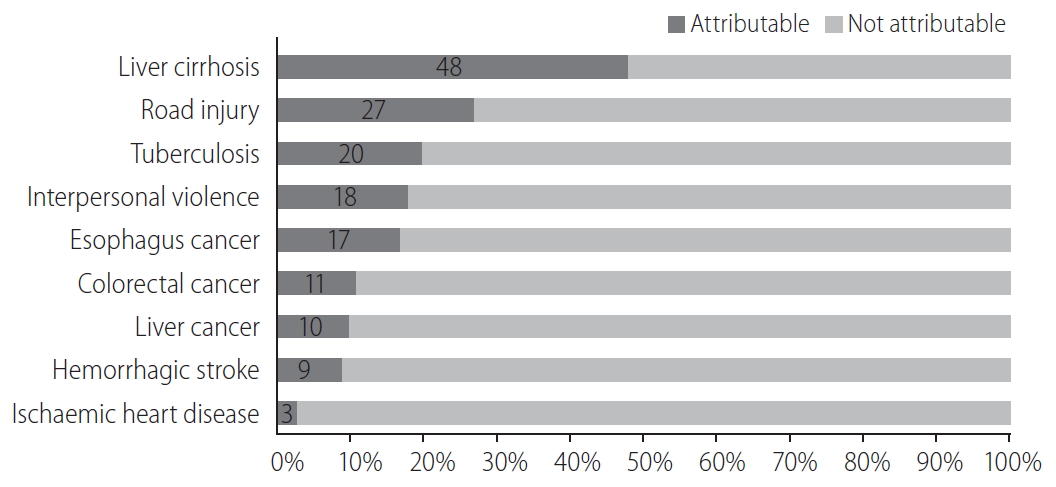
Digestive diseases, particularly liver cirrhosis, are the second leading contributors to alcohol-attributable deaths, representing 21.3% of these deaths (Fig. 1) [9]. Most deaths from alcohol-attributable digestive diseases concern liver cirrhosis (approximately 610,000 deaths) and pancreatitis (30,000 deaths) [9]. Alcohol is the cause of 60% of all liver cirrhosis in developed countries (Europe and North America), and the mortality and morbidity due to alcohol-related liver cirrhosis presents an increasing trend [18]. In the Asia-Pacific region, one-quarter of deaths due to cirrhosis and other chronic liver diseases are attributable to alcohol use [19]. Digestive disease deaths due to alcohol are highest in Africa (16.9 deaths per 100,000 people) and the Western Pacific regions (10.8 deaths per 100,000 people) [9]. Moreover, the contribution of alcohol to digestive diseases is highest in the European region, accounting for approximately 30% of all digestive disease deaths [9]. The contribution of alcohol to deaths from cirrhosis is approximately 50%; this figure would disappear in the absence of alcohol use at the global level (Fig. 2) [9].
It is worth mentioning that if the liver is already damaged by hepatitis B or C virus infection, even relatively low amounts of alcohol consumption can lead to death [9]. Consequently, tabulation by etiological coding of liver cirrhosis according to the artificially defined amount of alcohol is apt to underestimate the effects of alcohol [9].
THE ALCOHOL-ATTRIBUTABLE BURDEN OF CARDIOVASCULAR DISEASES (CVDS)
CVDs are the number 1 cause of death globally, causing an estimated 17.8 million or 31% of all deaths and 413.2 million or 16% of all DALYs worldwide in 2017 [20]. Alcohol causes an estimated net CVD burden of approximately 600,000 deaths (3.3% of all CVD deaths) and 13 million CVD DALYs (3.2% of all CVD DALYs) [9]. CVDs account for 19.8% and 9.8% of alcohol deaths and DALYs, respectively (Fig. 1) [9]. At the regional level, alcohol-attributable CVD deaths and DALYs are highest in the European region and the African region [9]. In a similar fashion, the contribution of alcohol as a cause of CVD is highest in the European region, where alcohol accounts for 10.5% of all CVD deaths and 11.0% of CVD DALYs [9].
When described precisely by cause of CVD, alcohol has a net detrimental effect on hemorrhagic strokes, hypertensive heart disease, cardiomyopathy, and ischemic heart disease [9]. The leading contributors to the alcohol-attributable CVD burden are hemorrhagic strokes and ischemic heart disease, accounting for 47.5% and 42.5% of all alcohol-attributable CVD deaths, respectively [9]. Although alcohol has a net protective effect on ischemic stroke (preventing 33,000 ischemic stroke deaths), these preventive effects may have been overestimated by a potential confounding by the ADH1B genotype [21]. Genetic polymorphism of ADH1B (A-allele variant) has a protective effect against the development of alcohol dependence [22]. A-allele carriers again drink less and have lower risk of cardiovascular disease [21]. Furthermore, alcohol, even at light or moderate intake, increases the risk of atrial fibrillation and flutter [23].
THE ALCOHOL-ATTRIBUTABLE BURDEN OF INFECTIOUS DISEASES
Alcohol is a major contributor to the burden of communicable, maternal, perinatal and nutritional conditions, with 0.4 million alcohol-attributable deaths (3.3% of the total) and 13.9 million alcohol-attributable DALYs (1.9% of the total) [8]. The leading cause of attributable deaths from these conditions is tuberculosis, responsible for approximately 250,000 or 19.6% of all tuberculosis deaths [9]. Geographically, alcohol-attributable infectious disease deaths are highest in Africa and South-East Asian regions, accounting for 33% and 14%, respectively, of all alcohol-attributable deaths [9]. Furthermore, alcohol has multiple effects on the risk of communicable diseases, including vulnerability to infection, the likelihood of unprotected sex, and poor adherence to a medication regimen [24].
THE ALCOHOL-ATTRIBUTABLE BURDEN OF MALIGNANT NEOPLASMS
Globally, the burden of cancer is estimated to have risen to 18.1 million new cases and 9.6 million deaths in 2018 [25]. One in five men and one in six women develop cancer during their lifetime, and one in eight men and one in 11 women die from the cancer [25]. The International Agency for Research on Cancer (IARC), a specialized WHO agency, has determined a causal link between alcohol consumption and cancers, including oral cavity, pharynx, larynx, esophagus, liver, colorectal and female breast cancer [26].
It is estimated that approximately 0.4 million or 4.2% of all cancer deaths worldwide were attributed to alcohol use in 2016 [9]. The three leading causes of the alcohol-attributable cancer burden are colorectal, liver, and esophageal cancers [9]. Regionally, the burden of alcohol-attributable cancers was highest in the European (8.4 deaths per 100,000 people) and American regions (5.1 deaths per 100,000 people) [9].
DETERMINANTS OF ALCOHOL USE IN A POPULATION
Although the global burden caused by the harmful use of alcohol is enormous, alcohol consumption is not homogenous and varies widely across the world [9]. More than half (57%) of the worldŌĆÖs adults (Ōēź15 years) have not consumed alcohol in the previous 12 months [9].
Alcohol consumption is deeply affected by many factors at the individual and population levels [15,18]. Identifying those factors is important. Of those factors, three stand out as the most important: religion (especially Islam), economic development, and the implementation of alcohol policies [15,18].
The wealth of a country is associated with higher alcohol consumption and a higher prevalence of current drinkers across all WHO regions [9]. Historically, in many European countries, industrialization of alcoholic beverages was an early aspect of the industrial revolution, and the rates of heavy alcohol drinking and alcohol-related harm rose steeply as the relative alcohol price dropped and alcoholic beverages became more widely available in many European empires and their colonies [9]. As societies become more affluent, there is a strong tendency in general for the amount of alcohol consumption to increase up to a certain level, after which no further increases in alcohol consumption occur [15]. Usually, the lowest percentages of abstainers (<40%) are found in high-income countries [9]. In low-income countries, most people simply do not have enough money to buy alcoholic beverages, and consequently, the percentage of abstainers is high, with alcohol consumption mainly restricted to the more affluent individuals in the country [15]. In most low- and middle-income countries, industrialization offers more people disposable income for alcoholic beverages, and the commercialization of alcohol increases [15]. A dramatic example can be found in Eastern European countries [9]. With the commercialization of the alcohol markets after the dissolution of the Soviet Union, the level of alcohol consumption and alcoholrelated harm increased markedly [9].
Although economic factors play a large part, Islam plays a more dominant role [15]. For example, in countries such as Saudi Arabia or Brunei, alcohol consumption is apparently low despite the high gross domestic product per capita at purchasing power parity (GDP-PPP) due to the presence of Islamic alcohol policies [15]. The highest percentages (more than 80%) of past 12-month abstainers are found in Muslim-majority countries [9].
In addition to religious and economic factors, alcohol policies can have an impact [9,15]. One of the prime examples is Russia, where the WHOŌĆÖs ŌĆśBest BuysŌĆÖ interventions and minimum alcohol pricing were implemented, resulting in dramatic changes in both alcohol consumption and the alcohol-attributable burden of disease (see below) [15]. In contrast, the USA, a high-income country, is another example where life expectancies are stagnant or not increased primarily due to alcohol-related causes of death [15]. Between 1990 and 2016, overall death rates in the USA declined, however, there are wide differences by age and at the state level [27]. The change in the probability of death from birth to age 20 years declined in all states. For ages 20 to 55 years, the probability of death actually increased in 21 states (Kentucky, Oklahoma, New Mexico, West Virginia, and Wyoming showed an increase of greater than 10%). For ages 55 to 90 years, all states experienced a considerable reduction in probabilities of death [27]. Moreover, recent data (between 2010 and 2015) showed life expectancy at birth for the USA has not increased or stagnant although the most important causes of death (such as CVDs or cancer) have declined [28,29]. A detailed inspection of this data showed that most of the causes of death are markedly impacted by alcohol and illicit drug use [28,29]. Furthermore, a high proportion of the increased premature mortality happened in lower socio-economic strata [28,29] led by the ŌĆśdeaths of despairŌĆÖ [30-32].
CONCEPTUAL BACKGROUND OF ALCOHOL POLICIES
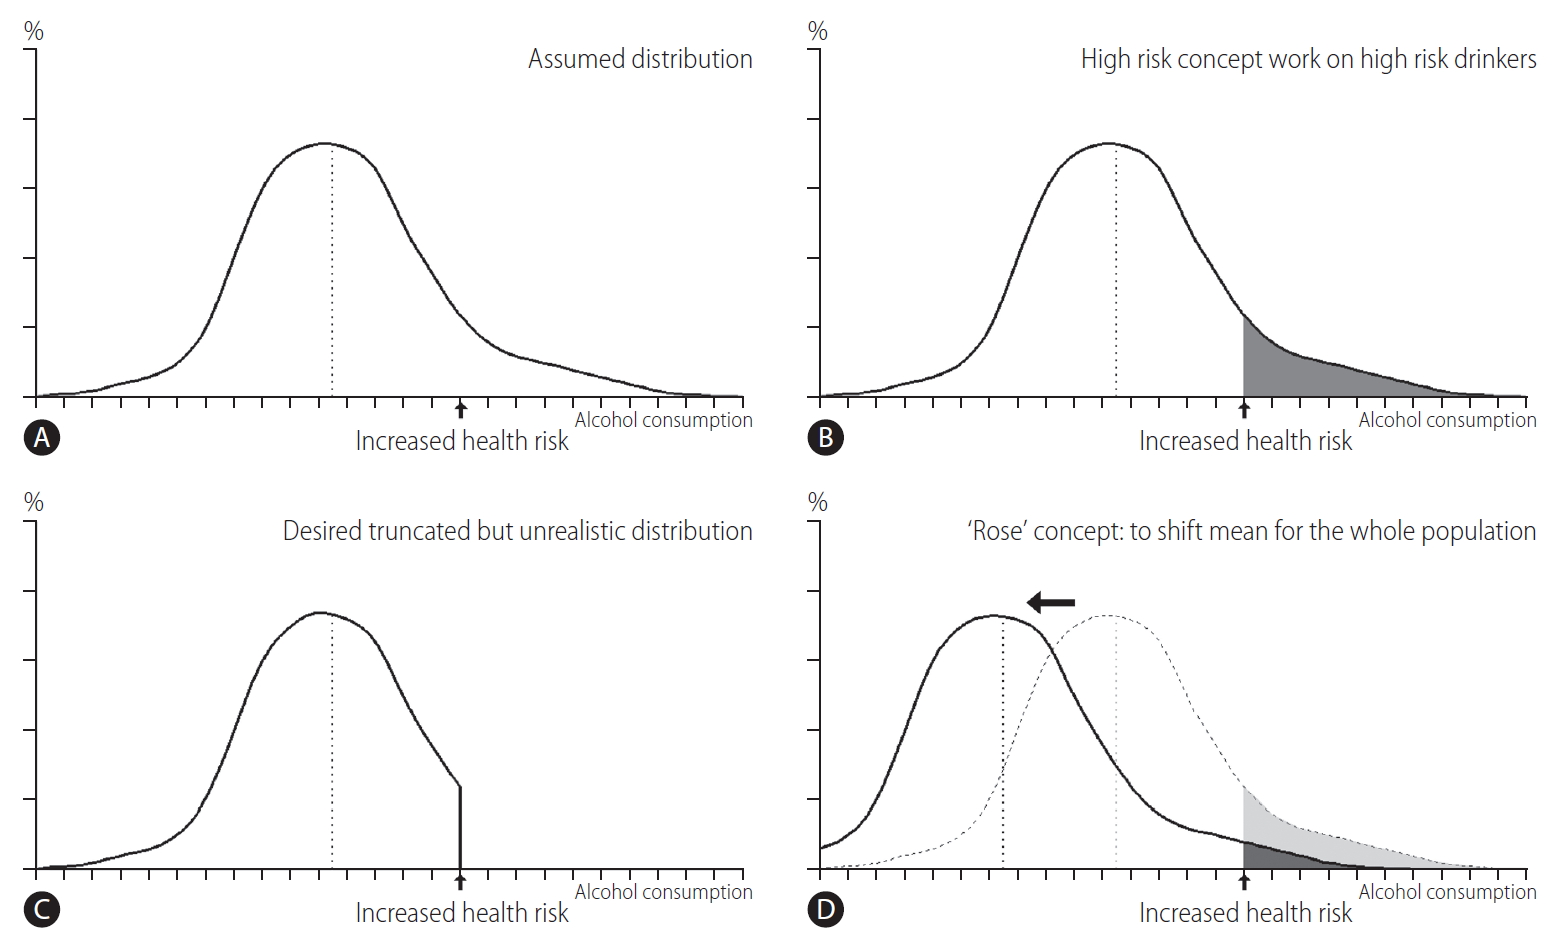
Health problems, such as alcohol-related problems, usually show a continuous distribution in terms of the intensity of risk factors or derangements. Figure 3 illustrates the strategic difference between the high-risk versus population-based approaches. People at one end of the distribution are not particularly deviant but a continuing part of one end (Fig. 3) [33].
An assumed distribution of alcohol consumption in a population is shown in Figure 3A. As the level of alcohol consumption increases, the health risks also rise. At a certain point, the increased health risk is considered as unacceptable (arrow). The shaded area of Figure 3B is the high-risk group. The high-risk approach focuses on this group. If the high-risk approach is fully successful, the end result would be as shown in Figure 3C, a highly unlike result. The population-based approach, in contrast to high-risk approach, emerges because a distribution such as that in Figure 3C is not feasible in the real world. Population-based approach is to change the entire distribution to reduce the risk within a population. The main difference between the high-risk versus population-based approaches is in the fact that high-risk approach focuses on high-risk ŌĆśindividualsŌĆÖ instead of the total sum of risk factors in a ŌĆśpopulationŌĆÖ [33]. On RoseŌĆÖs argument [34] in Figure 3D, the reduction of alcohol-related problems in a population should be directed to shift the entire distribution of alcohol consumption leftward, and with that shift, the average and total consumption in the population consequently declines. Such a shift in the distribution requires social actions that address the levels of total alcohol consumption with the aim to reduce the harm in the population as a whole, not merely confined in high-risk individuals [33].
WHOŌĆÖS RECOMMENDED INTERVENTIONS: ŌĆśBEST BUYSŌĆÖ
Alcohol policies are laws, rules, and regulations that aim to prevent and reduce alcohol-related harm [9]. The ŌĆśGlobal action plan for the prevention and control of noncommunicable diseases (NCDs) 2013ŌĆō2020ŌĆÖ proposed in the WHOŌĆÖs global strategy which endorsed by the World Health Assembly in 2010 [35] included recommended interventions to reduce alcohol-related harm at the national level with focus on the most cost-effective measures [9,36,37]. These WHO recommended interventions, so-called ŌĆśbest buysŌĆÖ, include increased taxation on alcoholic beverages, enforced restrictions on the physical availability of alcohol and comprehensive restrictions or bans on advertising alcoholic beverages (Table 2) [9,18].
It has been suggested that the most effective measure is a combination of various alcohol policies, especially in countries with high alcohol-related burdens [18]. The ultimate goal is to design a package of population-based alcohol policies considering the specific characteristics of a country to have the highest impact on both alcohol consumption and the alcohol-related burden [18,38].
THE ŌĆśWHOLE COUNTRYŌĆÖ APPROACH TO REDUCE THE HARMFUL USE OF ALCOHOL: A PUBLIC HEALTH IMPERATIVE
Alcohol policy development and implementation have advanced [9] but are still far from satisfactory in effectively protecting populations from alcohol-related harm. The challenges in implementing optimal alcohol policies to reduce the alcohol-related harm and burden include low levels of political commitment to coordinate multi-sector actions to reduce harmful use, the strong influence of commercial interests that go against implementing effective alcohol policies, and the drinking culture and traditions in a society [9].
The responsibility for the implementation of effective alcohol policies is often dispersed between diverse systems, governmental departments, intergovernmental agencies and professions ŌĆō for which alcohol problems are not a major concern [9]. This ŌĆśdivision of laborŌĆÖ makes alcohol policies difficult to run effectively and coherently at the national level [9]. Therefore, reducing the harmful use of alcohol at the population level and the alcohol-related burden in a country requires the ŌĆśwhole of governmentŌĆÖ and ŌĆśwhole of societyŌĆÖ approaches with appropriate public health-oriented engagement [9]. Partnerships and the appropriate engagement of all relevant stakeholders, such as nongovernmental organizations and professional and civil societies, are required to implement cost-effective measures that can ensure returns to the ŌĆśwhole countryŌĆÖ and the ŌĆśwhole nationŌĆÖ by reducing the harmful use of alcohol and the alcohol-related burden [9].
From the 2nd WHO report in 2004, it has given examples of leadership of member states. The latest 5th WHO report in 2018 lists eight countries as examples, including the Russian Federation, Thailand and Brazil [9]. In Thailand, only a minority of adults drink alcohol, but the country experiences substantial alcohol-attributable harms [9]. The likelihood of domestic violence increased fourfold when one person drinks, and two in five crimes committed by young people involve alcohol [9]. Thailand has managed this problem through the ŌĆśtriangle that moves the mountainŌĆÖ. The three legs are strong scientific communities, energetic grassroots movements and evidence-based policies [9]. In Brazil, traffic crashes are the leading cause of death among young male and 78% of drivers in fatal crashes test positive for alcohol [9]. ŌĆśVida UrgenteŌĆÖ (urgent life), a community-based drinking driving campaign in the state of Rio Grande do Sul, had an impressive success during Carnival, an event that is often marked by high rates of traffic crash fatalities [9]. There was not a single road traffic fatality on the major roads near Carnival in Porto Alegre in the years that the ŌĆśBuzoomŌĆÖ(driver) event, the campaign provided buses to transport, was in place [9].
ALCOHOL POLICY IMPACT CASE STUDY: RUSSIA
Russia has long been regarded as one of the heavy alcohol-consuming countries in the world [9]. Heavy alcohol consumption has been established as one of the main causes of the Russian mortality crisis of the 1990s and 2000s [9,39]. Alcohol consumption was the primary culprit of the mortality increase that started in the 1980s and led to 75% of deaths among men aged 15ŌĆō55 years [6]. Life expectancy in men plummeted by more than 6 years reaching its absolute low of 57 years between 1990 and 1994 [39,40]. However, these trends have been impressively reversed in recent years [41].
After 2003, per capita alcohol consumption dropped substantially from 18.7 L in 2005 to 11.7 L in 2016 as a result of the staggered implementation of alcohol policies [9]. Life expectancy started to increase in 2003 and reached its all-time high of 68 years for men and 78 years for women in 2018 [41]. Between 2003 and 2018, all-cause mortality dropped by 39% in men and by 36% in women [42].
Over time, the Russian governmentŌĆÖs alcohol policies started with very basic attempts to reinstate control over alcohol production and sales and to eliminate unrecorded alcohol production [41]. In the early 1990s, the government slowly regained control over alcohol production and sales, with the enactment of Federal Law No. 171 in 1995 [41]. After 2000, the Russian alcohol market was substantially reorganized to reduce the proportion of unrecorded alcohol [40,41]. Alcohol policies at that time mainly targeted control over alcohol production and sales, not individual consumers [41].
Alcohol policies evolved into comprehensive approaches, taking a long-term view aimed at reducing the harmful use of alcohol, the alcohol-related burden and the total level of alcohol consumption in the population [41]. In 2009, evidence-based measures, including increased alcohol excise taxes, an increased minimum unit price, and a substantial reduction in the availability of retail alcohol, were implemented [41,43].
CONCLUSIONS
Despite ongoing efforts for alcohol control, alcohol remains a leading global risk factor for premature mortality, with 3 million alcohol-attributable deaths. Its toll will remain substantial if there are no concerted and sustained policy initiatives. Recommendations for abstaining from alcohol should be prioritized because the level of consumption that minimizes an individualŌĆÖs risk is zero.
To reduce the harmful use of alcohol in a country, the ŌĆśwhole of governmentŌĆÖ and ŌĆśwhole of societyŌĆÖ approaches are required with the implementation of evidence-based alcohol control policies, the pursuit of public health priorities, and the adoption of appropriate policies over a long period of time.
 PDF Links
 PubReader
 ePub Link
 Full text via DOI
 Full text via PMC
 Download Citation
 Print
Print