Advances in ultrasound diagnosis in chronic liver diseases
Article information

Abstract
Chronic liver disease is a major disorder worldwide. A better understanding of anatomy, blood flow, and pathophysiology may be a key issue for their proper management. Ultrasound (US) is a simple and non-invasive diagnostic tool in the abdominal field. Doppler mode offers real-time hemodynamic evaluation, and the contrast-enhanced US is one of the most frequently used modalities for the detailed assessment. Further development in digital technology enables threedimensional (3D) visualization of target images with high resolution. This article reviews the wide ranges of application in the abdominal US and describes the recent progress in the diagnosis of chronic liver diseases.
INTRODUCTION
With the various spectrums of the etiologies, chronic liver disease is increasing in prevalence worldwide [1]. Cirrhosis is the most advanced stage of chronic liver disease. It is associated with possible adverse events, such as gastroesophageal varices, ascites, hepatic encephalopathy, and the development of hepatocellular carcinoma (HCC), which require careful medical care [2-4].
Because of the advantages of simple and less-invasive evaluations, ultrasound (US) may be the most frequently used imaging tool in the practical management of patients with chronic liver disease. In addition to the B-mode imaging, recent development in digital technology has introduced various modes, color/power Doppler mode, harmonic imaging as a microbubble-based contrast mode, and three-dimensional (3D) mode [5-7]. With these backgrounds, this review article describes the recent advances of US in the diagnosis of chronic liver diseases.
B-MODE
Recent digital development has shown the improvement of spatial resolution and signal-to-noise ratio of B-mode which is the only imaging to demonstrate fundamental tissue images. The role of simple technique for chronic liver disease is identification of cirrhosis, diameter measurement (i.e., liver, spleen, and vessels), and detection of the ascites, collateral vessels, and focal hepatic lesions [8-10].
Muscle is another target of B-mode US. The quantification of muscle mass is an important issue of patient care because it is closely associated with malnutrition, leading to the reduction of health-related quality of life [11,12]. Sarcopenia is defined by significant reduction of muscle mass and/or power and is widely accepted as a common impairment in cirrhosis [13,14]. It is a significant factor for poor prognosis, for prediction of outcome in patients with HCC, and for the development of complications after hepatic surgery or liver transplantation [15-17]. A study based on the B-mode US reported that the detectability of the iliopsoas muscle (IP) was 100% both in the control group (depth 31.7–61.2 mm; mean±standard deviation, 45.8±7.7) and in the cirrhosis group (20.6–75.4 mm; 43.7±9.2) (Fig. 1). Sensitivity, specificity, and the area under the receiver operating characteristic (AUROC) by IP index (IP area/height2, mm2/m2) calculated by US to detect muscle mass loss diagnosed by computed tomography (CT) using skeletal muscle index at L3 level were 79.5%, 73.1%, and 0.835, respectively, with the best cut-off value of 189.2 for males, and 84.6%, 78.8%, and 0.874, respectively, with the best cut-off value of 180.6 for females [18]. Thus, the IP index obtained from the transcutaneous US may be an alternative to CT the muscle mass quantification in cirrhosis, without requiring radiation exposure.
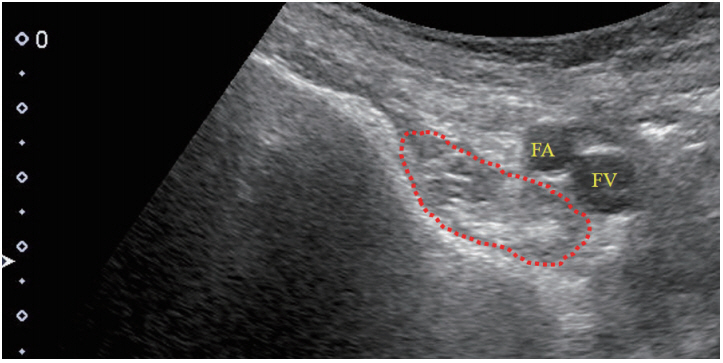
An 84-year old female, cirrhosis (primary biliary cholangitis). Bmode sonogram (transverse scan) at right groin area showed iliopsoas muscle with clear delineation (red dotted line). FA, femoral artery; FV, femoral vein.
Recent development of digital technology has resulted in the demonstration of 3D hepatic surface sonogram with high-qualified images and real-time manner; 74% (23/31) success rates of visualization showing characteristic irregularity of the hepatic surface in all cirrhotic patients and the intra-/inter-operator and interreviewer agreement were excellent (к=1.0) [19]. The ability to distinguish cirrhotic liver from non-cirrhotic liver improved with the use of combination of 2D- and 3D-imaging versus 2D-imaging alone (sensitivity, P =0.02; accuracy, P =0.02) or 3D-imaging alone (sensitivity, P =0.03). Therefore, 3D-based sonography may act as a virtual laparoscopy method with the potential to improve the diagnosis of cirrhosis.
DOPPLER US
Doppler US is the first-line modality for the diagnosis of vascular-related liver diseases [20], with possible evaluation of waveform, flow direction, a velocity and flow volume. A damping index is a parameter using the hepatic vein waveform calculated by the following formula: minimum velocity/maximum velocity of the hepatic vein waveform. If the value was higher than 0.6, the patient is significantly more likely to have severe portal hypertension (SPH; hepatic venous pressure gradient [HVPG] > 12 mmHg), with 76% sensitivity and 82% specificity, suggesting it to be an effective parameter to predict the grade of portal hypertension [21].
Flow direction is also the target of Doppler US observation. The study in 222 cirrhosis patients reported that the cumulative incidences of non-forward portal flow (NFPF) were 6.5% at 1 year, 14.5% at 3 years, and 23.1% at 5 years. The cumulative survival rate was significantly lower in patients with NFPF (72.2% at 1 year, 38.5% at 3 years, and 38.5% at 5 years) than in those with forward portal flow (84.0% at 1 year, 67.8% at 3 years, and 54.3% at 5 years; P =0.0123) on using Child-Pugh B and C classification, suggesting the need for careful management [22].
It is also reported that portal hemodynamics are predictive markers of outcomes in cirrhosis; lower velocity (<12.8 cm/s) in the portal trunk in compensated cirrhosis for decompensation, and reverse portal flow in decompensated cirrhosis for poor prognosis [23].
ESOPHAGEAL VARICES (EV)
Based on the anatomical and hemodynamic features, left gastric vein (LGV) is the key vascular route to the EV (Fig. 2). A recent study reported that the sonographic detectability of the LGV was higher in patients with EV (129/154, 83.8%) than in those without (35/75, 46.7%; P<0.0001), and was higher in those with large EV (30/30, 100%) than in those without (134/199, 67.3%; P =0.0002) [24]. The positive detection of the LGV showed 100% sensitivity and negative predictive value (NPV) to identify large EV in the whole cohort and the compensated group. The best cutoff value in the LGV diameter was 5.35 mm to identify large EV, showing 0.753 AUROC with 90% sensitivity and 96.5% NPV. It may enhance the practical use of US-based LGV assessment as a noninvasive test to identify large EV with high sensitivity and NPV in cirrhotic patients at a lower cost.
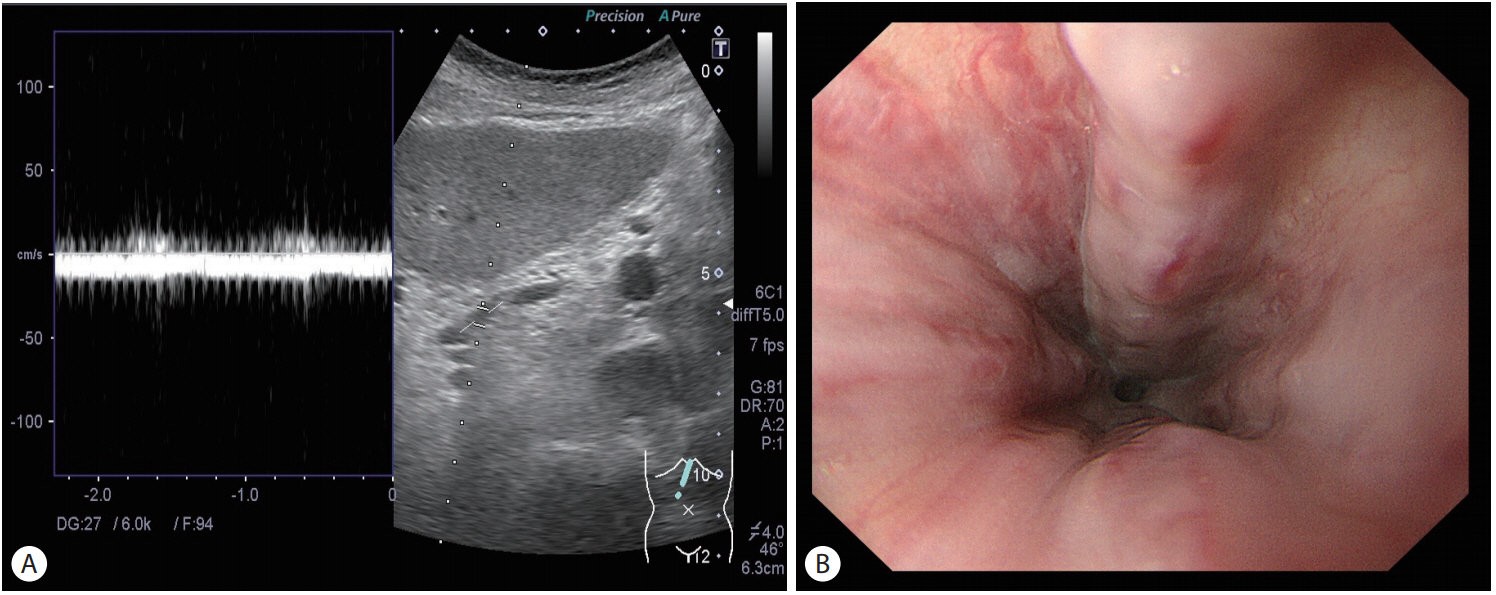
A 46-year old female, alcoholic cirrhosis. (A) Pulsed Doppler image. Left gastric vein showed hepatofugal flow direction. (B) Endoscopic finding. The patient had medium-grade esophageal varices with a red sign.
GASTRIC VARICES (GV)
GV are one of the serious complications in cirrhosis. Although the frequency is relatively lower than that of EV, bleeding from GV may result in much severer consequence [25]. Needless to say, presence and degree of GV need to be properly recognized for their clinical management. The 3D color Doppler may be effective for the quantitative evaluation of the degree of GV; the sensitivity and specificity of the 3D-US technique to detect GV were 88.6% (62/70) and 100% (37/37), respectively. The best cutoff value of variceal volume to detect medium/large-grade GV was 2.0 mL, with 83.3% sensitivity and 95.8% specificity. Seventy-nine percent (55/70) of patients showed partial resemblance or better between the 3D images and the endoscopic findings with the good inter-reviewer agreement. These data suggest the improvement of objectivity in the assessment of GV by using 3D-US, which is expected to be an alternative to endoscopy [26,27].
With regard to the hemodynamic aspect, Doppler US is effective to evaluate the inflow and outflow route of GV for the assessment of bleeding risk (Fig. 3) [28,29]. Particularly, demonstration of the gastrorenal shunt may be useful to decide the therapeutic strategy because it is a key pathway to perform balloon-occluded retrograde transvenous obliteration. Hemodynamic evaluation by Doppler US also offers the prediction of long-term prognosis after treatment of GV; large flow volume in the collaterals and reverse flow direction of splenic vein suggest the post-treatment poor prognosis [30,31].
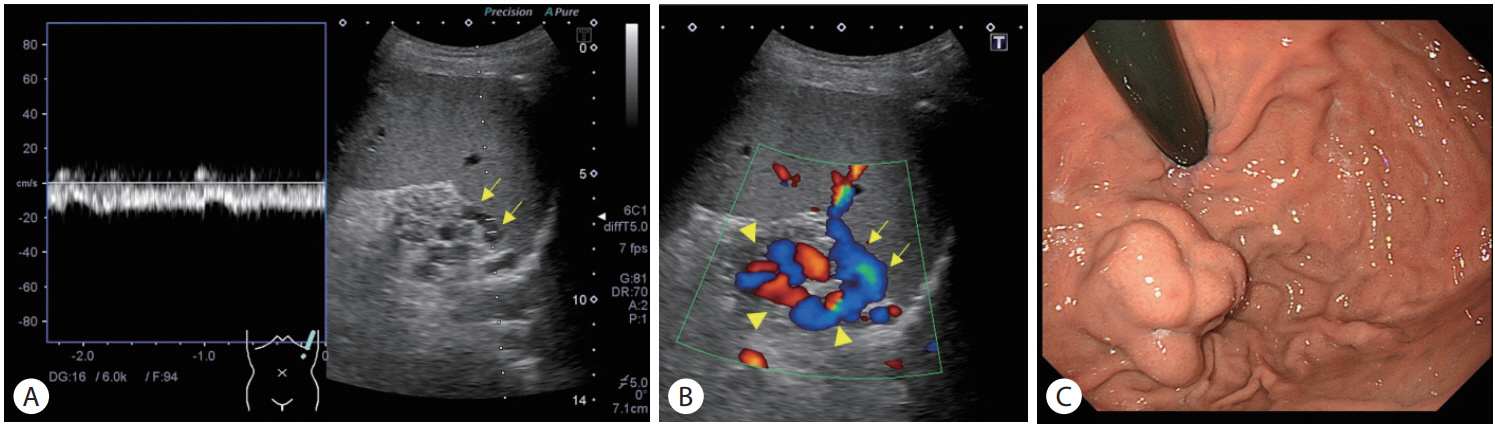
A 25-year old male, non B non C cirrhosis. (A) Pulsed Doppler image. Short gastric vein (arrows) had a continuous wave with hepatofugal flow direction. (B) Color Doppler image. The stomach was demonstrated through the spleen (arrows, short gastric vein; arrowheads, gastric varices). (C) Endoscopic finding. The patient had medium-grade gastric fundal varices.
CONTRAST-ENHANCED US
Hepatic fibrosis
Transit time
The transit time is defined by the interval from vessel to vessel and represents the parameter for evaluating dynamic microbubbles (Table 1) [32,33].

Contrast-enhanced parameters for hepatic fibrosis
A prospective multicenter study reported the effect of the transit time from the portal vein to the hepatic vein using SonoVue: 78.6% specificity, 79% sensitivity, 78.3% positive predictive value, 83.3% NPV, 78.8% accuracy, and 0.847 AUROC at a cutoff of 13 seconds for the diagnosis of severe fibrosis (F3 and F4) with various etiologies [34]. A more recent study with the same parameter using SonoVue in chronic hepatitis B virus infection has shown AUROCs of 0.955 for ≥S2 (Scheuer scoring system) and 0.946 for ≥S4, with better diagnostic ability than FibroIndex [35]. However, Cobbold et al. reported poor diagnostic ability of transit time (hepatic artery to hepatic vein) in patients with chronic hepatitis C virus infection using SonoVue: AUROCs of 0.83 with aspartate aminotransferase to platelet ratio index (APRI), 0.82 with enhanced liver fibrosis (ELF)/transient elastography (TE), 0.71 with hepatic transit time for moderate to severe fibrosis (stage >2), 0.91 with ELF, 0.9 with TE, 0.86 with APRI, and 0.83 with hepatic transit time for cirrhosis [36]. The transit time from venous access to the hepatic vein (HVAT) using Definity showed an AUROC of only 0.56 in the differentiation of ≥F3 [37]. The other study suggested no significant effect of HVAT on METAVIR scores of fibrosis and necroinflammatory changes in patients with chronic hepatitis C [38]. Taken together, the efficacy of transit time to estimate the degree of hepatic fibrosis is controversial. An optimal time point with proper kind of contrast agents needs to be determined by further studies.
Intensity-based parameter
The signal intensity is also a popular parameter in the assessment of contrast sonography. The difference in the peak signal intensity between the portal vein and liver parenchyma showed an AUROC of 0.87 for >F3 in 49 patients with hepatitis C virus infection using SonoVue [39]. The interval between the portal onset and the time of maximum intensity ratio between the right portal vein and parenchyma showed a close relationship with the degree of hepatic fibrosis using Sonazoid in 117 chronic liver disease patients with AUROCs of 0.94 for ≥F2, 0.96 for ≥F3, and 0.98 for cirrhosis [40]. The diagnostic ability was superior to those of APRI and fibrosis index based on 4 factors (FIB-4). A subsequent study (in 74 patients with chronic liver disease) compared the diagnostic performance using the following 4 markers: contrast parameter (Sonazoid, the same contrast parameter used in [40]), TE, type IV collagen 7 s, and FIB-4 [41]. In the combined model with a constant parameter, the AUROCs were sufficient: 0.87 for ≥F2 with FIB-4, 0.89 for ≥F3 with TE, and 0.99 for cirrhosis with TE. Therefore, the contrast parameter may be promising for grading hepatic fibrosis when combined with liver stiffness or FIB-4.
Assessment of captured microbubbles
Sonazoid is the only second-generation contrast agent available for the abdomen with the accumulating property in the reticuloendothelial system. The post-vascular phase signal intensity from the intrahepatic accumulated microbubbles showed AUROCs of 0.88 for ≥F2, 0.95 for ≥F3, and 0.97 for cirrhosis in 203 subjects [42]. The results were superior to those obtained with FIB-4 (0.85 for ≥F2, P =0.15; 0.89 for ≥F3, P =0.057; 0.90 for cirrhosis, P =0.017). From a technical aspect, it appears easier to conduct scanning and to assess the findings with the captured microbubbles compared to the dynamic microbubbles, because of the stability of the target. Also, it should be recognized that there is a difference in the origin of signal source between SonoVue and Sonazoid when interpreting the data because the former does not accumulate in the liver.
Differentiation between idiopathic portal hypertension (IPH) and cirrhosis
Although it may not be a common disease, IPH causes several manifestations of portal hypertension, gastroesophageal varices, ascites, and a higher incidence of developing portal vein thrombosis [43]. IPH should be strictly distinguished from cirrhosis because of the differences in clinical management, the lower incidence of developing into HCC, and a better survival rate than cirrhosis [43]. For this purpose, contrast-enhanced US with Sonazoid is effective to identify IPH by means of earlier-phase appearance of the liver showing delayed periportal enhancement [44], degree of post-vascular phase enhancement by accumulated microbubbles in the liver [45], and demonstration of unique structure of the intrahepatic portal vein by 3D imaging [46].
Severity of portal hypertension
The transit time between vessels could be applicable to predict the severity of portal hypertension. A large study reported that the AUROC of HVAT (SonoVue) was 0.973 for clinically significant portal hypertension (HVPG >10 mmHg) in compensated cirrhosis under the cut-off value of 14 seconds [47]. The other study also reported that intrahepatic transit time under 6 seconds showed the diagnostic ability for SPH (HVPG >12 mmHg) with AUROC of 0.94 [48]. A more recent study reported that splenic circulation presented by the transit time from the splenic artery to splenic vein using Sonazoid was an effective marker for the severity of portal hypertension [49].
SUMMARY AND PROSPECTIVE
The pieces of evidence support the benefit of US in the diagnosis of chronic liver diseases, regarding the characterization of liver diseases and the assessment of the severity of fibrosis and portal hemodynamics. However, there are some limitations. Firstly, skill and knowledge of the US depend on the experience and may affect the operation and interpretation of the findings. Particularly, achievement of the valid data may be difficult in obese patients even by the trained person. Secondly, there are not enough studies to compare the diagnostic abilities of US and other imaging modalities, such as elastography and magnetic resonance imaging (MRI). Additional studies, including an international multicenter setting from different races and clinical backgrounds, may be necessary to solve these problems.
There are two novel techniques in the abdominal US field. One is the fusion imaging which is the combined multiple imaging of US, CT, and MRI. Although it is generally used for the support of treating liver tumors [50], the role in the diagnosis of chronic liver disease is not determined. The second is the radiomics by means of the high-throughput extraction of large amounts of image features from radiographic images. This technology, based on automated and reproducible analysis, may suggest the beginning of the new era in the imaging field of chronic liver disease, though further validation study is needed [51-53].
CONCLUSION
This article demonstrated the current application, substantial effects, and limitation of US in the diagnosis of chronic liver diseases. Further validation in a large-scale prospective study may enhance the establishment of US-based standard medical care of patients with chronic liver diseases.
Notes
Authors’ contribution
Interpreting data: Naoya Kato.
Drafting the manuscript: Hitoshi Maruyama.
Final approval: All authors.
Conflicts of Interest: The authors have no conflicts to disclose.
Abbreviations
APRI
aspartate aminotransferase to platelet ratio index
AUROC
area under the receiver operating characteristic
CT
computed tomography
ELF
enhanced liver fibrosis
EV
esophageal varices
FIB-4
fibrosis index based on 4 factors
GV
gastric varices
HCC
hepatocellular carcinoma
HVAT
transit time from venous access to the hepatic vein
HVPG
hepatic venous pressure gradient
IP
iliopsoas muscle
IPH
idiopathic portal hypertension
LGV
left gastric vein
MRI
magnetic resonance imaging
NFPF
non-forward portal flow
NPV
negative predictive value
SPH
severe portal hypertension
TE
transient elastography
US
ultrasound
3D
three-dimensional