Prognostic role of computed tomography analysis using deep learning algorithm in patients with chronic hepatitis B viral infection
Article information
Abstract
Background/Aims
The prediction of clinical outcomes in patients with chronic hepatitis B (CHB) is paramount for effective management. This study aimed to evaluate the prognostic value of computed tomography (CT) analysis using deep learning algorithms in patients with CHB.
Methods
This retrospective study included 2,169 patients with CHB without hepatic decompensation who underwent contrast-enhanced abdominal CT for hepatocellular carcinoma (HCC) surveillance between January 2005 and June 2016. Liver and spleen volumes and body composition measurements including subcutaneous adipose tissue (SAT), visceral adipose tissue (VAT), and skeletal muscle indices were acquired from CT images using deep learning-based fully automated organ segmentation algorithms. We assessed the significant predictors of HCC, hepatic decompensation, diabetes mellitus (DM), and overall survival (OS) using Cox proportional hazard analyses.
Results
During a median follow-up period of 103.0 months, HCC (n=134, 6.2%), hepatic decompensation (n=103, 4.7%), DM (n=432, 19.9%), and death (n=120, 5.5%) occurred. According to the multivariate analysis, standardized spleen volume significantly predicted HCC development (hazard ratio [HR]=1.01, P=0.025), along with age, sex, albumin and platelet count. Standardized spleen volume (HR=1.01, P<0.001) and VAT index (HR=0.98, P=0.004) were significantly associated with hepatic decompensation along with age and albumin. Furthermore, VAT index (HR=1.01, P=0.001) and standardized spleen volume (HR=1.01, P=0.001) were significant predictors for DM, along with sex, age, and albumin. SAT index (HR=0.99, P=0.004) was significantly associated with OS, along with age, albumin, and MELD.
Conclusions
Deep learning-based automatically measured spleen volume, VAT, and SAT indices may provide various prognostic information in patients with CHB.
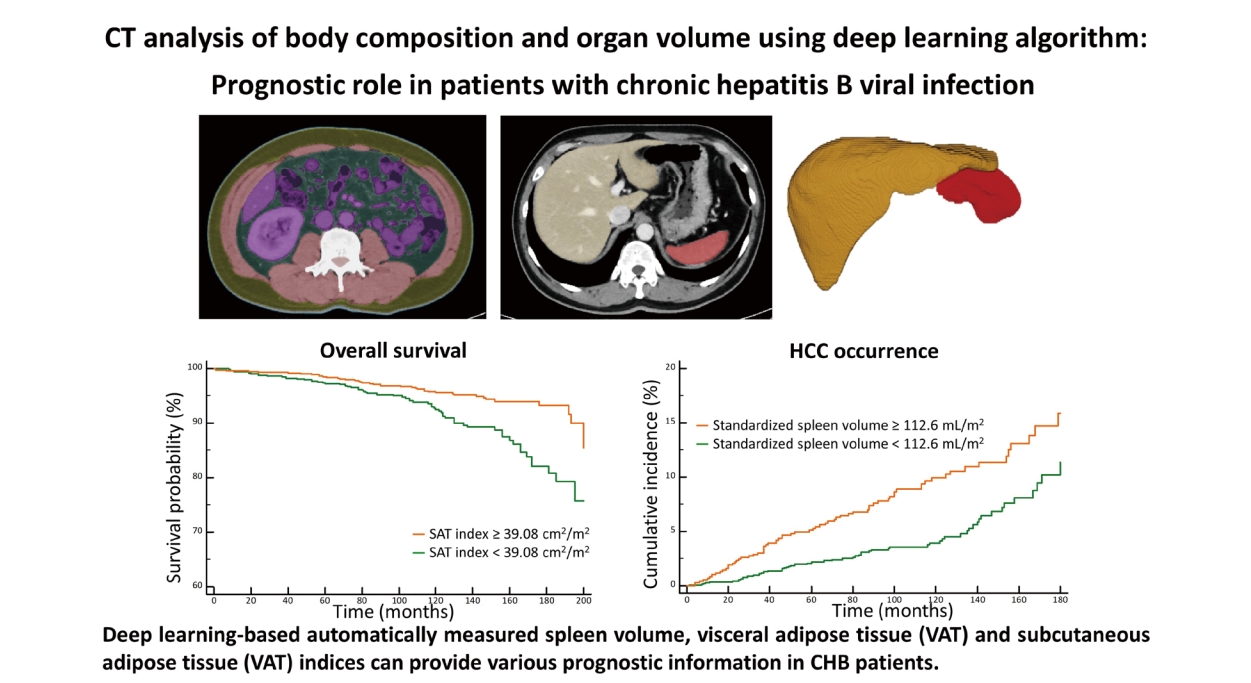
Graphical Abstract
INTRODUCTION
Chronic hepatitis B (CHB) remains an important global health problem with significant morbidity and mortality despite vaccination and effective antiviral treatment [1]. The risk of progression to cirrhosis and hepatocellular carcinoma (HCC) in patients with CHB is variable and is affected by the host’s immune response. The 5-year cumulative incidence of cirrhosis ranges from 8% to 20% in patients with untreated CHB and the 5-year cumulative risk of hepatic decompensation among those with cirrhosis is 20% [2]. The annual risk of HCC in patients with cirrhosis has been reported to be 2–5% [3]. The risk factors for CHB progressing to cirrhosis or HCC include not only host-related or viral factors, but also social-environmental factors (e.g., alcohol consumption, metabolic syndrome, diabetes mellitus [DM], obesity, and smoking) [4]. There have been efforts over decades to predict clinical outcomes in patients with CHB for proper and timely managements such as GAGHCC [5], CU-HCC [6], REACH-B [7], or PAGE-B [8] for predicting HCC development, hepatic decompensation [9] and overall survival (OS) [10] and model for end-stage liver disease, hepatic venous pressure gradient, and albumin for predicting hepatic decompensation [9] and OS [10] in previous literatures.
Deep learning-based computed tomography (CT) metric analysis provides three-dimensional organ volumetric parameters and body composition measurements [11,12]. Furthermore, previous investigations [13,14] showed that fully automated quantitative tissue composition analysis using CT scans may predict future serious adverse events and add opportunistic value to CT scans performed for other indications. Considering the promising results of previous studies, we surmised that body composition analysis and organ volume measurement using liver CT images may also provide prognostic information regarding the risk of HCC occurrence or development of hepatic decompensation in patients with compensated CHB.
Therefore, the purpose of this study was to evaluate the prognostic value of CT analysis using deep learning algorithm in patients with CHB.
MATERIALS AND METHODS
This study was approved by our institutional review board (IRB No.: 2108-143-1246) and the requirement for signed informed consent was waived owing to the retrospective design.
Patients
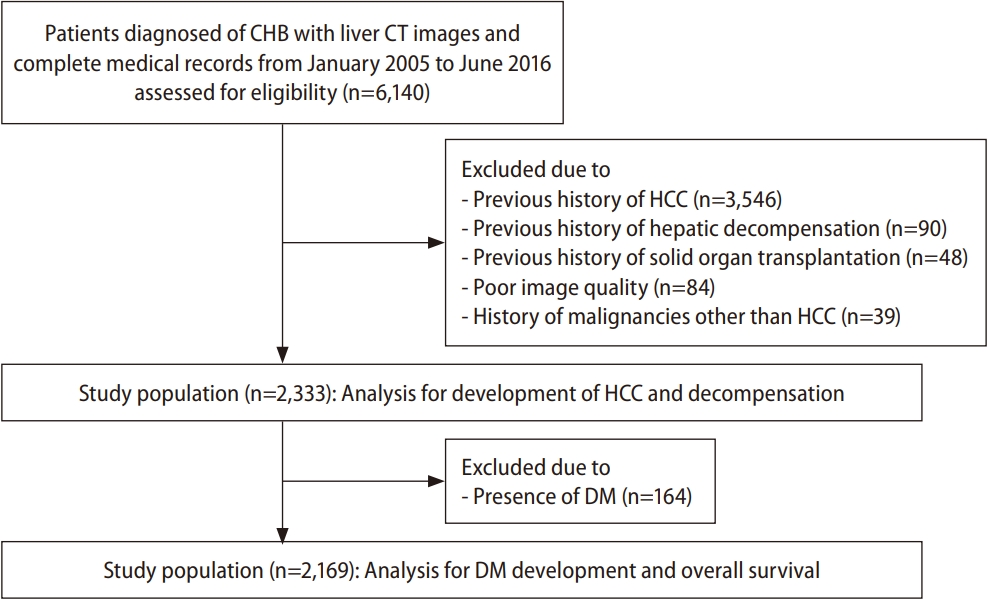
The inclusion criteria were: 1) patients aged between 19 and 85 years, 2) patients who were diagnosed with CHB, and 3) patients having both a contrast-enhanced abdominal CT scan and complete medical records, including liver function tests, between January 2006 and June 2016 (Fig. 1). According to the inclusion criteria, 6,140 consecutive patients were assessed for eligibility. The exclusion criteria were: 1) previous history of HCC (n=3,546), 2) previous history of hepatic decompensation (n=90), 3) previous history of solid organ transplantation (n=48), 4) poor image quality of abdominal CT scan, when reviewed by a radiologist (n=84), and 5) history of malignancies other than HCC (n=39). Finally, 2,333 patients constituted the study population.
CT image acquisition
All patients underwent abdominal CT scans, including the arterial and portal venous phase, using various types of CT scanners owing to the retrospective study design. CT scanning was performed using the following parameters: tube voltage, 90–120 kVp according to the scanner type; tube current-time products, 100–300 mAs; rotation time, 0.5 s; pitch, 0.6–1.2; and slice thickness, 3 mm. Iobitridol (Xenetix 350; Guerbet, Aulnay-sous-Bois, France) was intravenously injected at a dose of 520 mg/kg body weight using a power injector (Stellent; Bayer AG, Berlin, Germany) for 30 s at a rate of 2–5 mL/s according to body weight, followed by a 20–30-mL saline flush. Using the bolus tracking method, arterial phase scans were started 17–23 s after the enhancement threshold (100–150 HU) was reached in the descending thoracic aorta. For portal venous phase scans, a fixed delay of 60–75 s was used.
Body composition and organ volume analysis using CNN
CT images were processed in an automated analysis software program using convolutional neural network (CNN) (DeepCatch and MEDIP; MedicalIP Co. Ltd., Seoul, Korea; http://www.medicalip.com). After uploading portal venous phase CT images to commercially available segmentation software (MEDIP Deep Catch v1.0.0.0; MedicalIP Co. Ltd.), a three-dimensional U-Net automatically provided volumetric segmentation of body components into seven classes (skin, subcutaneous fat, muscle, visceral fat, bone, internal organs and vessels, and the central nervous system) (Fig. 2). The average dice scores for muscles, visceral fat, and for subcutaneous fat were 96.8–99.2%, 95.1–98.9%, and 97.1–99.7%, respectively, in the domestic validation sets [12]. After segmentation, the software also provided automatic segmentation and labeling of the body composition area at the L3-level cross-sectional image. An experienced radiologist, who was blinded to the patients’ clinicopathological information, confirmed the results of the segmentation. Subsequently, L3-level sectional area (cm2) of the skeletal muscle, subcutaneous adipose tissue (SAT), and visceral adipose tissue (VAT) were normalized to the height (m2) [15-17] and were labeled as skeletal muscle, SAT, and VAT indices, respectively. Additionally, three-dimensional segmentation of the liver and spleen was performed and the organ volumes were automatically calculated. Spleen and liver volumes were normalized to the body surface area (m2), which was calculated as body weight (kg)0.425×height (cm)0.725 ×0.007184 [18].

Fully automated body composition and organ volume analysis using convolutional neural network. (A) A three-dimensional U-Net automatically provided volumetric segmentation of body components into seven classes (skin, subcutaneous fat, muscle, visceral fat, bone, internal organs and vessels, and the central nervous system). (B) An axial image showsthe results of segmentation, which are overlaid on orthogonal cross-sectional images at the L3 vertebral-body level. Pink, yellow, green, and purple colors indicate skeletal muscle, subcutaneous fat, visceral fat, and internal organs, respectively. (C) An axial image shows the results of organ segmentation of the liver (yellow) and spleen (red), which are overlaid on the CT image. (D) Three-dimensionalsegmentation of the liver and spleen was performed. CT, computed tomography.
Endpoints
The primary endpoint was OS and the secondary endpoints were liver-related (i.e., development of HCC and decompensation) and metabolic outcomes (i.e., development of DM). We assessed the cumulative incidence of the occurrence of HCC, hepatic decompensation, DM, and death. Development of HCC was determined histopathologically in patients who underwent surgical resection or percutaneous biopsy, or based on imaging features categorized into “LR-5” according to the Liver Imaging Reporting and Data System [19] or “definite HCC” according to the 2022 Korean Liver Cancer Association and National Cancer Center Korea practice guidelines [20], in patients without histopathologic analysis. The development of hepatic decompensation was defined as the occurrence of variceal bleeding, spontaneous bacterial peritonitis, hepatic encephalopathy, or hepatorenal syndrome [21]. The development of DM was determined based on medical records. OS was calculated as the interval between the day of the baseline liver CT and death or the last follow-up date. The survival data of the study population was acquired from the national registry data from the Korean Ministry of Interior and Safety. The data cut-off date was January 31, 2022.
Statistical analysis
All statistical analyses were performed using IBM SPSS Statistics for Windows version 27.0 (IBM Corp., Armonk, NY, USA), SAS version 9.3 (SAS Institute Inc., Cary, NC, USA), and MedCalc Statistical Software version 18.9.1 (MedCalc Software bvba, Ostend, Belgium; https://www.medcalc.org; 2019). Univariate and multivariate Cox proportional hazards logistic regression analyses were performed to identify significant predictors of each outcome. All variables with p-values less than 0.05, in univariate analyses, were included in the multivariate analysis using stepwise selection. The Kaplan–Meier method was used for estimation of the cumulative incidence of each outcome. The optimal cut-off values of body composition and organ volume measurements for predicting each outcome were determined using the minimal P-value approach based on log-rank test statistics [22]. Statistical significance was set at a P-value <0.05.
RESULTS
Patient characteristics
Baseline characteristics of the 2,333 patients (Male: Female=1,396:937; median age, 52.0 years [interquartile range {IQR}, 45.0–59.0]) are summarized in Table 1. Among them, 164 patients had DM at the time of enrollment. For all patients, body composition data including skeletal muscle, VAT, and SAT indices were successfully obtained from CT data analyzed by deep learning algorithm. Additionally, liver and spleen volumes of each patient were successfully acquired from their CT data via deep learning algorithm and standardized by dividing by body surface area.
Predictive factors for HCC development
During a median follow-up period of 103 months, HCC developed in 134 patients (5.7%, 134/2,333) with the following stages at diagnosis: Barcelona-Clinic Liver Cancer stage 0 (n=70), stage A (n=59), stage B (n=4), and stage C (n=1). The estimated the 1-, 5-, and 10-year cumulative incidences of HCC occurrence were 0.6%, 3.2%, and 6.1%, respectively. According to the multivariate analysis, standardized spleen volume was one of the significant predictive factors for HCC development (hazard ratio [HR]=1.01, 95% confidence interval [CI]=1.01–1.01, P=0.025), along with age, sex, albumin level, and platelet count (Table 2). The optimal cut-off value for the standardized spleen volume was set at 112.6 mL/m2 to predict HCC development. The estimated 1-, 5-, and 10-year cumulative incidences of HCC development in 773 patients with standardized spleen volumes ≥112.6 mL/m2 were 0.8%, 5.1%, and 9.9%, respectively, and were significantly higher than those in 1,396 patients with standardized spleen volumes <112.6 mL/m2 which were 0.4%, 2.2%, and 3.9%, respectively (HR=1.71, 95% CI =1.21–2.42, P=0.002) (Fig. 3A).

The predictors for development of HCC in 2,333 patients with compensated chronic liver disease from CHB
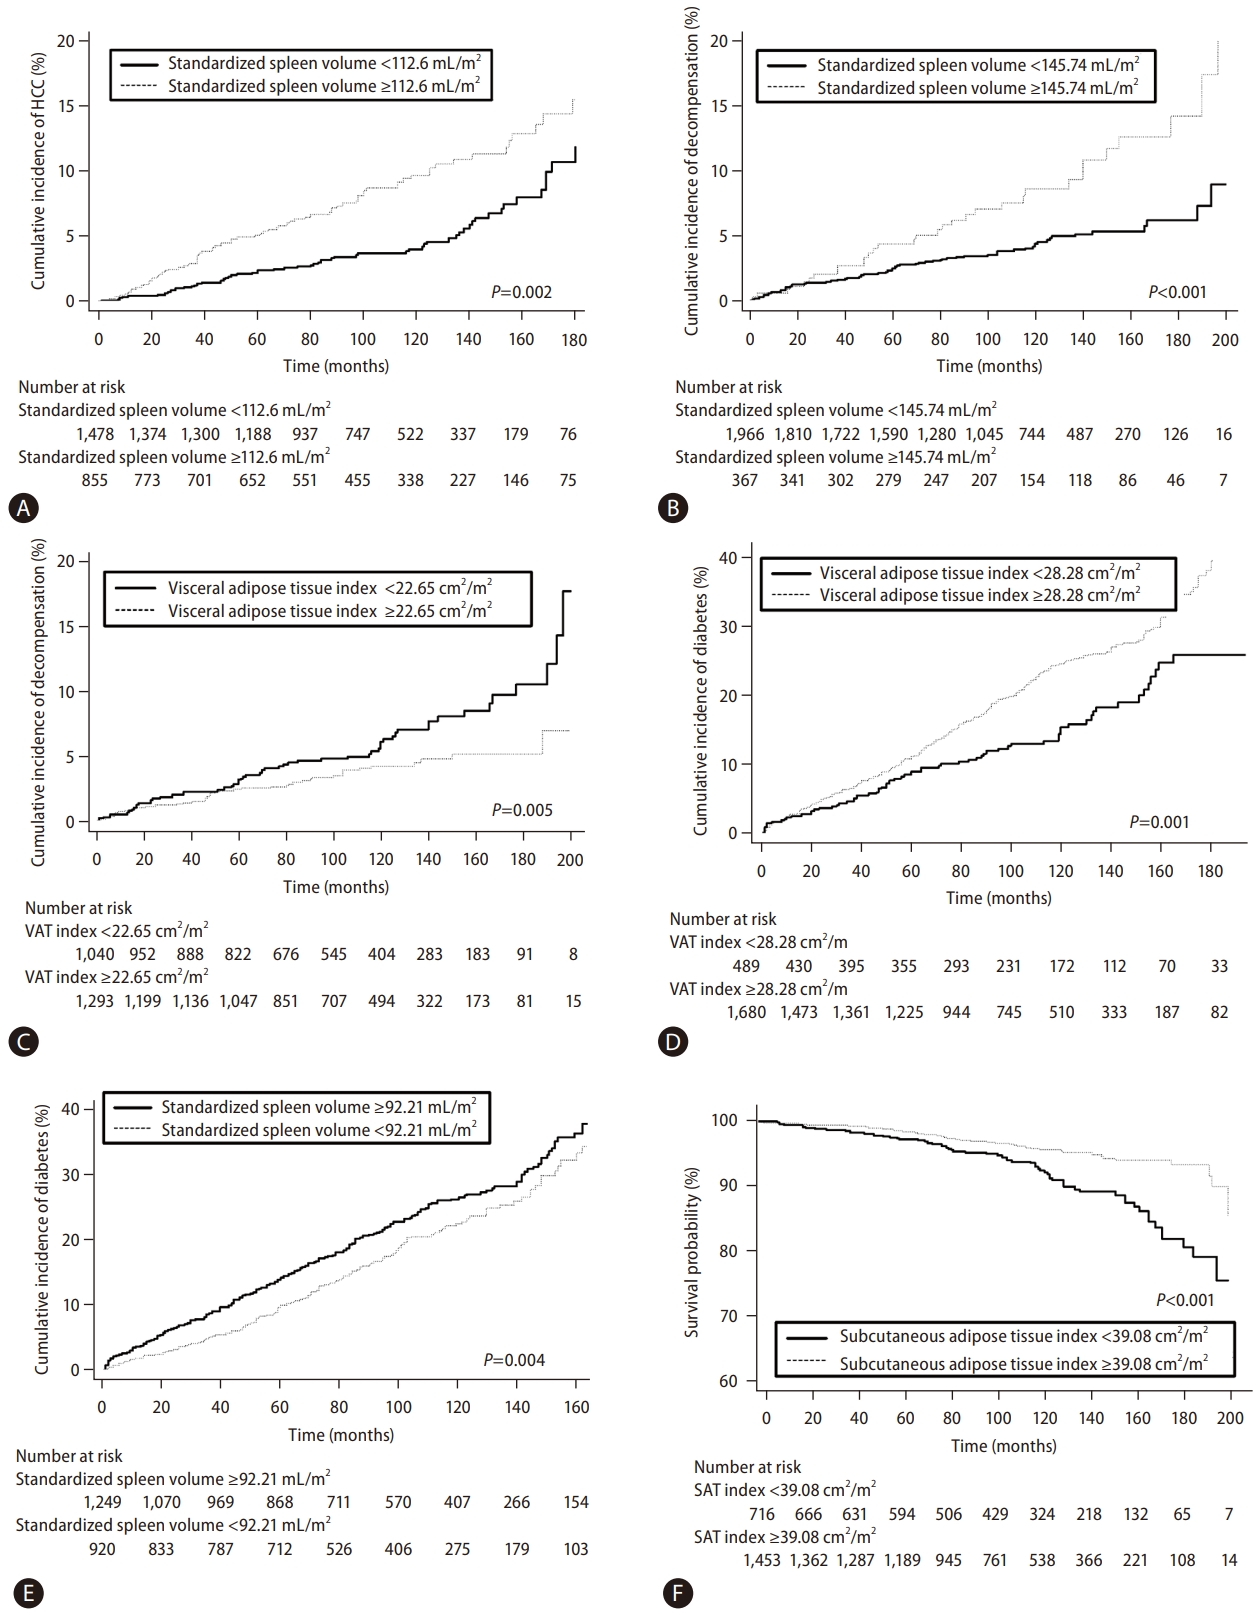
Kaplan–Meier estimation of cumulative incidences of HCC, hepatic decompensation, development of DM, and overall survival in patients stratified according to body composition measurements and organ volumes. (A) The cumulative incidence of HCC of 855 patients with a standardized spleen volume ≥112.6 mL/m2 was significantly higher than that of 1,478 patients with a standardized spleen volume <112.6 mL/m2 (P<0.001). (B) The cumulative incidence of hepatic decompensation of 367 patients with a standardized spleen volume ≥145.74 mL/m2 was significantly higher than that of 1966 patients with a standardized spleen volume <145.74 mL/m2 (P<0.001). (C) The cumulative incidence of hepatic decompensation of 1,040 patients with a VAT index <22.65 cm2/m2 was significantly higher than that of 1,293 patients with a VAT index ≥22.65 cm2/m2 (P=0.012). (D) The cumulative incidence of DM of 1,680 patients with a VAT index ≥28.28 cm2/m2 was significantly higher than that of 489 patients with a VAT index <28.28 cm2/m2 (P<0.001). (E) The cumulative incidence of DM development of 1,249 patients with a standardized spleen volume ≥92.21 mL/m2 was significantly higher than that of 920 patients with a standardized spleen volume <92.21 mL/m2 (P=0.040). (F) The overall survival of 1,453 patients with a SAT index ≥39.08 cm2/m2 was significantly higher than that of 716 patients with a SAT index <39.08 cm2/m2 (P<0.001). HCC, hepatocellular carcinoma; VAT, visceral adipose tissue; DM, diabetes mellitus; SAT, subcutaneous adipose tissue.
Predictive factors for the development of hepatic decompensation
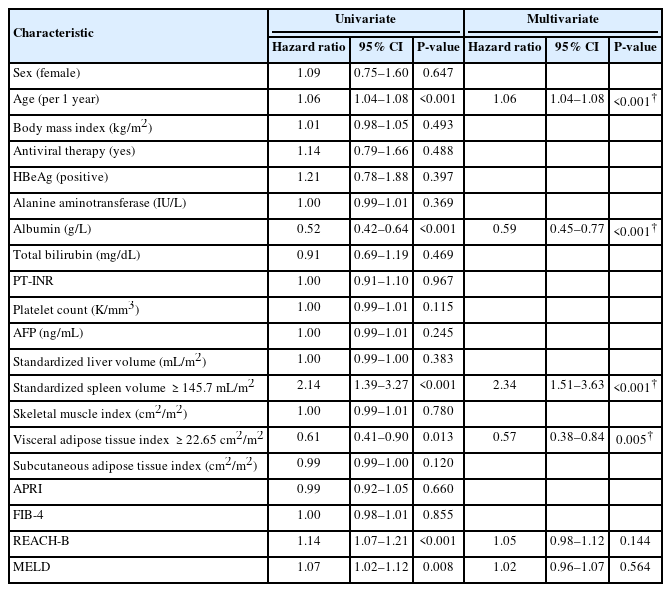
During the follow-up period, 103 patients (4.4%, 103/2,333) experienced hepatic decompensation with the development of: ascites (n=59); hepatic encephalopathy (n=33); and variceal bleeding (n=11). The estimated 1-, 5-, and 10-year cumulative incidences for the development of hepatic decompensation were 0.7%, 2.8%, and 5.1%, respectively. On multivariate analysis, age and serum albumin level were significantly associated with the development of hepatic decompensation. In addition, standardized spleen volume (HR=1.01, 95% CI=1.01–1.01, P<0.001) and VAT index (HR=0.98, 95% CI=0.97–0.99, P=0.004) were also significant predictive factors for hepatic decompensation (Table 3). The optimal cut-off value of the standardized spleen volume was set at 145.74 mL/m2 to predict hepatic decompensation. The estimated 1-, 5-, and 10-year cumulative incidences of hepatic decompensation in 329 patients with a standardized spleen volume ≥145.74 mL/m2 were 0.6%, 4.4%, and 9.1%, respectively, and were significantly lower than those of 1,840 patients with a standardized spleen volume <145.74 mL/m2 which was 0.7%, 2.5%, and 3.9%, respectively (HR=2.34, 95% CI =1.51–3.63, P<0.001) (Fig. 3B). Regarding the VAT index, the optimal cut-off value was set at 22.65 cm2/m2 to predict hepatic decompensation. The estimated 1-, 5-, and 10-year cumulative incidences of hepatic decompensation in 990 patients with a VAT index <22.65 cm2/m2 were 0.5%, 3.3%, and 6.1%, respectively, which were significantly higher than those of 1,179 patients with a VAT index ≥22.65 cm2/m2 which were 0.8%, 2.4%, and 4.2%, respectively (HR=0.57, 95% CI=0.38–0.84, P=0.005) (Fig. 3C).
Predictive factors for the development of DM
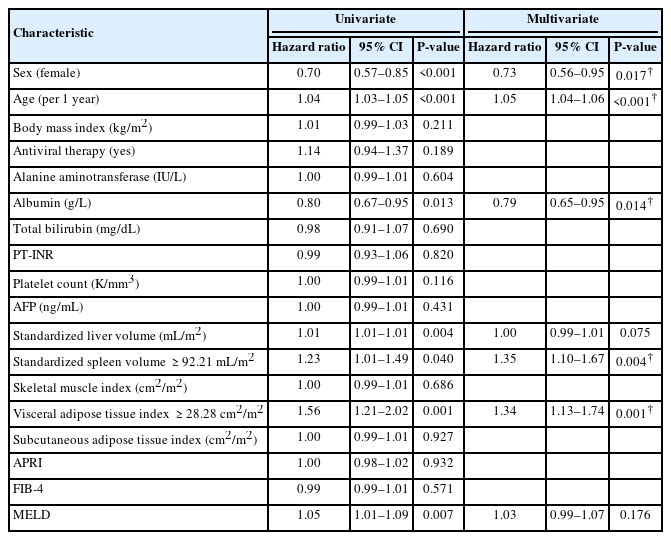
We excluded 164 patients who had DM at the time of enrollment to examine the development of DM. During the follow-up period, DM developed in 432 patients (19.9%, 432/2,169). The estimated 1-, 5-, and 10-year cumulative incidences for the development of DM were 2.7%, 10.7%, and 22.7%, respectively. Multivariate analysis revealed that VAT index (HR=1.01, 95% CI=1.01–1.01, P=0.001) and standardized spleen volume (HR=1.01, 95% CI=1.01–1.01, P=0.001) were among the significant predictors for the development of DM (Table 4), along with sex, age, and albumin level. The optimal cut-off value of the VAT index was set at 28.28 cm2/m2 to predict the development of DM. The estimated 1-, 5-, and 10-year cumulative incidences of DM development in 1,680 patients with a VAT index ≥28.28 cm2/m2 were 2.7%, 11.2%, and 24.8%, respectively, and were significantly higher than those of 489 patients with a VAT index of <28.28 cm2/m2 which were 2.5%, 9.0%, and 15.4%, respectively, (HR=1.34, 95% CI =1.13–1.74, P=0.001) (Fig. 3D). Regarding the standardized spleen volume, the optimal cut-off value was set at 92.21 mL/m2 to predict the development of DM. The estimated 1-, 5-, and 10-year cumulative incidences of DM development in 1,249 patients with a standardized spleen volume ≥92.21 mL/m2 were 3.4%, 12.7%, and 24.7%, respectively, and were significantly higher than those of 920 patients with a standardized spleen volume <92.21 mL/m2 which were 1.7%, 8.1%, and 20.0%, respectively (HR=1.35, 95% CI=1.10–1.67, P=0.004) (Fig. 3E).
Predictive factors for OS
We excluded 164 patients who had DM at the time of enrollment to examine OS. During the follow-up period, 120 patients (5.5%, 120/2,169) died. The causes of death were: unknown (n=104, 86.7%), liver cirrhosis-related complications (n=6, 5.0%), pneumonia (n=6, 5.0%), and progression of HCC (n=4, 3.3%). The estimated 1-, 5-, and 10-year OS were 99.6%, 98.1%, and 94.5%, respectively. Multivariate analysis revealed that the SAT index (HR=0.99, 95% CI=0.98–0.99, P=0.004) was significantly associated with OS, along with age, albumin, and the Model for End-Stage Liver Disease score (Table 5). The optimal cut-off value of the SAT index was set at 39.08 cm2/m2 to predict OS. The estimated 1-, 5-, and 10-year OS in 1,453 patients with a SAT index ≥39.08 cm2/m2 were 99.7%, 98.5%, and 95.6%, respectively, and were significantly higher than those of 716 patients with a SAT index <39.08 cm2/m2 which were 99.4%, 97.2%, and 92.5%, respectively (HR=0.49, 95% CI=0.34–0.70, P<0.001) (Fig. 3F).
DISCUSSION
In this study, body composition data and spleen and liver volumes were automatically acquired from portal venous phase CT images using CNN in all patients. Standardized spleen volume was significantly associated with the development of HCC, hepatic decompensation, and DM; furthermore, the VAT index was correlated with the development of hepatic decompensation and DM. In addition, a higher SAT index correlated with increased OS.
Although ultrasound is currently the recommended modality for HCC screening in patients with CHB [23,24], its sensitivity for detecting HCC can be commonly reduced in situations such as limited sonic window, inherent liver blind spots, or coarse liver parenchyma masking focal lesions [25]. Considering that CT scans can be performed as an alternative imaging modality in such circumstances [25], we expect that body composition and spleen volumetric data automatically and additionally obtained by applying CNN-based fully automated algorithm on CT data, can be used for opportunistically predicting the comprehensive prognosis of patients with CHB. Our study results are in line with those from previous studies [13,26,27] showing the usefulness of automated CT-based opportunistic screening of various diseases such as cardiovascular events, osteoporosis, and sarcopenia.
Our study results showed the prognostic role of spleen volume in predicting the development of HCC and hepatic decompensation. As liver fibrosis and cirrhosis advance, the spleen tends to enlarge owing to both the accumulation of portal flow and tissue hyperplasia characterized by a combination of angiogenesis, fibrogenesis, enlargement, and hyperactivation of the splenic lymphoid compartment [28,29]. Therefore, spleen enlargement was reported as a potential surrogate marker of the severity of liver fibrosis and portal hypertension [30,31] and showed a significant association with the development of HCC and hepatic decompensation in previous studies [32,33], which aligns with our results. However, these previous studies determined a spleen enlargement of more than 12 cm on ultrasonography [33] or acquired splenic volume by applying a semi-automated software to CT scans [32]. In contrast, in this study, we obtained spleen volume using a deep learning-based fully automated segmentation tool, saving researchers’ time and efforts.
The association between CHB and DM has been controversial, and some previous studies [34,35] reported the increased prevalence of DM in patients with CHB, while others did not [36,37]. In our study, the spleen volume was a significant predictor of DM. Several mechanisms have been suggested to explain the association between hepatitis B viral (HBV) infection and the prevalence of DM [35]. The liver’s impairment resulting from HBV infection can potentially lead to disruptions in glycometabolism, owing to its crucial role in maintaining glucose homeostasis by managing both glucose storage and release [38]. Therefore, the significant correlation between the spleen volume and DM in our study may be attributable to the association between DM and HBV infection-induced chronic inflammation of the liver, which was represented by increased splenic volume.
In our study, a higher VAT index was associated with hepatic decompensation and DM, whereas a higher SAT index was significantly correlated with increased OS. In previous studies [39,40], obesity, represented by the body mass index, was a significant risk factor for decompensation in patients with cirrhosis of all etiologies. Moreover, obesity-related changes in insulin and leptin may change intrahepatic vascular resistance [40], leading to portal hypertension. However, body mass index alone may not be an accurate predictor of outcomes since it does not reflect the distribution of fat deposition [41]. Recently, growing evidence indicates that adipose tissue plays an active role in influencing endocrine function, immunity (i.e., leptin and adiponectin), and angiogenesis (i.e., angiopoietin-2, vascular endothelial growth factor, leptin, and adiponectin) [42,43]. Adipose tissue is currently divided into SAT and VAT based on location and functions. The VAT index was an independent predictor of DM in our study, which can be explained by previous studies showing significant correlations between increased visceral adiposity with insulin resistance in patients with DM [44,45]. In contrast, the favorable effects of increased SAT on survival were demonstrated in patients with various oncologic diseases [46,47] and cirrhosis [48], which are concordant with our study results. The reasons for the protective effects of high subcutaneous adiposity were not clearly identified; however, potential explanations include the association between leptin produced by SAT and better insulin sensitivity and energy metabolism, as well as less prevalent cachectic state inducing energy exhaustion in patients with increased SAT [49]. Based on these results from ours, fully automated body composition measurements using CNN on CT data which quantifies the distribution of fat deposition, rather than merely determining the presence of obesity according to the body mass index, may provide more accurate information regarding prognosis.
Our study has several limitations. First, this was a retrospective study from a single tertiary referral center; therefore, selection bias was unavoidable. Furthermore, our study results were not externally validated in other patient cohorts. Therefore, further studies are warranted to validate our study results. Second, our study did not provide longitudinal follow-up data which might have shown different results.
In conclusion, a larger spleen volume was significantly associated with HCC, hepatic decompensation, and DM occurrence. A higher abdominal VAT index was correlated with the development of DM, while a higher SAT index was correlated with increased OS in patients with CHB. Deep learning-based automatically measured spleen volume, abdominal VAT and SAT indices may be used as opportunistic prognostic factors in patients with CHB.
Notes
Authors’ contribution
Jeongin Yoo: analysis and interpretation of data; drafting manuscript; critical revision of the manuscript; obtained funding. Heejin Cho: acquisition of data; critical revision of the manuscript. Dong Ho Lee: study concept and design; analysis and interpretation of data; supervision; critical revision of the manuscript. Eun Ju Cho: study concept and design; supervision; critical revision of the manuscript. Ijin Joo: study concept and design; acquisition of data. Sun Kyung Jeon: study concept and design; acquisition of data. All authors approved the final version of the manuscript.
Conflicts of Interest
The authors have no conflictsto disclose.
Acknowledgements
This study was supported by a research grant (No. 04-2021-2310) from Seoul National University Hospital, Seoul, Korea.
Abbreviations
CHB
chronic hepatitis B
CI
confidence interval
CT
computed tomography
DM
diabetes mellitus
HCC
hepatocellular carcinoma
HR
hazard ratio
OS
overall survival
References
Article information Continued
Notes
Study Highlights
• Previous studies have shown the usefulness of deep learning-based automated CT analysis for opportunistic screening of various diseases. Therefore, this study aimed to evaluate comprehensive prognosis through organ volumes and body composition measurements obtained from CT data using deep learning-based fully automated organ segmentation algorithm in patients with chronic hepatitis B. A larger standardized spleen volume was significantly associated with HCC, hepatic decompensation, and occurrence of DM. A higher abdominal VAT index was correlated with the development of DM, while a higher SAT index was correlated with increased OS.

