Letter regarding “Evidence-based hyponatremia management in liver disease”
Article information

Dear Editor,
Recently, Ryu et al. [1] provided an extensive review of hyponatremia, the most common electrolyte abnormality in hospitalized patients, focusing on patients with liver disease. Indeed, this serious disorder of osmolality continues to take a huge toll on patients with hepatic disease, accounting for complications that are associated with high morbidity or death [2,3]. As such, the authors thoroughly examined the pathophysiology, laboratory findings and clinical aspects of hyponatremia to formulate guidelines for the effective management of patients with advanced liver disease.
Because hyponatremia is multifactorial and complex, the clinical diagnosis and management of adverse effects of osmolar derangement are difficult, particularly in critically ill patients. Perhaps just as important would be drafting a plan for the correction of hyponatremia without complication of myelinolysis, in each individual case [4]. Indeed, patients with advanced liver disease are at high risk for developing grave neurological complications including hepatic encephalopathy, and osmotic demyelination syndrome (ODS) secondary to marked disturbances of electrolytes. The clinical course of ODS is biphasic: first, it begins with hyponatremic encephalopathy that appears to improve transiently following rapid elevation of serum sodium levels; and, second, 2–3 days after the correction or overcorrection of sodium, ensuing myelinolysis can cause spastic quadriplegia, pseudobulbar palsy, coma or death [5]. Although the authors are indeed correct that ODS is a rare and life-threatening neurologic complication resulting from excessive hyponatremia therapy, neuronal changes may be reversible and the evolution of encephalopathy can ideally be monitored.
Advances in magnetic resonance (MR) imaging of the brain have revolutionized the understanding of complex diagnoses of many neurological disease processes. In ODS, myelinolysis, the dominant feature of this particular form of toxic encephalopathy, affects primarily the white matter causing loss of myelin with relative sparing of the neurons. Pathological changes of ODS include destruction of the myelinated nerve sheaths and loss of oligodendrocytes, which are most susceptible to osmotic disturbances. These structural neuronal abnormalities are foremost reflected on the distribution of the MR imaging changes of osmotic myelinolysis in the white matter, in pontine or extrapontine sites, which as said parallels the distribution of oligodendrocytes in the brain [5,6]. MR imaging reportedly has played a key role in the determination of both the presence and extent of myelinolysis related to osmotic dysregulation [7,8]. The well-recognized addition of diffusion-weighted imaging (DWI), a specialized imaging technique, to conventional MR sequences allows for early detection of changes in diffusion of the water molecules reflecting cytotoxic brain edema, caused by hyponatremia (Fig. 1). For example, in a previous study Ruzek et al. [5] were able to identify myelinolysis within 24 hours of onset of tetraplegia on DWI. On MR images, ODS lesions may display decreased signal intensity on T1-weighted images, frequently with a symmetric distribution. On the T2-weighted and fluid-attenuated inversion recovery (FLAIR) images, osmotic demyelination lesions show increased signal intensity with corresponding high signal intensity on DWI (and low ADC values), indicating restricted diffusion due to active cytotoxic edema in the affected brain areas [5,8,9]. With normalization of intracellular hypotonicity and re-establishment of equilibrium of osmolality, gradual improvement of the brain lesions may be seen on the MR images. Further, recent evidence indicates that oligodentrocytes that survive demyelination can remyelinate [10]. As such, the regenerative potential of neuroglial cells may need to be clinically addressed or monitored on the imaging studies for prognostication purposes, in those patients with liver disease and resolving ODS. Hyponatremia and attempted overly rapid correction of the electrolyte imbalance may cause extreme osmotic stress that can be damaging to the brain, with debilitating neurologic sequelae. DWI can detect changes of water diffusion in the brain and is useful in diagnosis of cytotoxic edema associated with ODS. In any cases, the authors would agree that MR imaging is a powerful tool that needs to be added to the diagnostic armamentarium of clinicians managing hyponatremia and its neurological complications, in patients with liver disease.
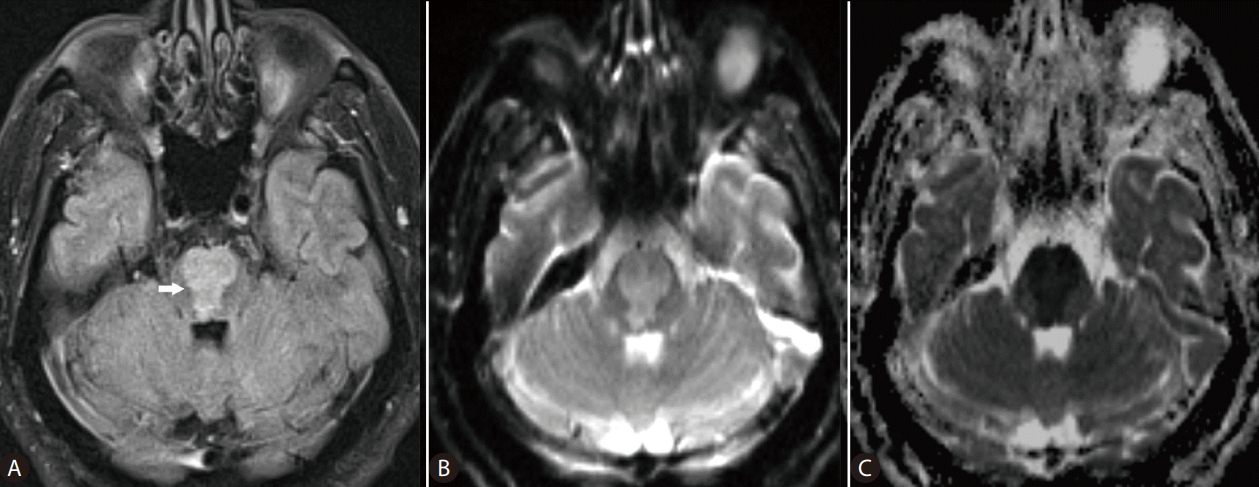
MR images of the brain in a 67-year-old man with cirrhosis of the liver, who developed extensive pontine myelinolysis due to overcorrection of hyponatremia (serum sodium, 167 mmol/L). Axial FLAIR (A), DWI (B), and ADC map (C) MR images of the brain obtained at the same level reveal large lesion (arrow) in the pons, with restricted diffusion. MR, magnetic resonance; FLAIR, fluid-attenuated inversion recovery; ADC, apparent diffusion coefficient; DWI, diffusion-weighted imaging.
Notes
Authors’ contribution
The authors contributed equally to conceptualization, analysis and writing of this manuscript.
Conflicts of Interest
The authors have no conflicts to disclose.
Abbreviations
ADC
apparent diffusion coefficient
ODS
osmotic demyelination syndrome
DWI
diffusion-weighted imaging