Classification of microvascular invasion of hepatocellular carcinoma: correlation with prognosis and magnetic resonance imaging
Article information

Abstract
Background/Aims
The microvascular invasion (MVI) of hepatocellular carcinoma (HCC) involves a wide histological spectrum, and it is unclear whether the degree of MVI correlates with patient prognosis or imaging findings. Here, we evaluate the prognostic value of MVI classification and analyze the radiologic features predictive of MVI.
Methods
Using a retrospective cohort of 506 patients with resected solitary HCCs, the histological and imaging features of MVI were reviewed and correlated with clinical data.
Results
MVI-positive HCCs invading ≥5 vessels or those with ≥50 invaded tumor cells were significantly associated with decreased overall survival (OS). The 5-year OS, recurrence-free survival (RFS), and beyond Milan criteria RFS rates were significantly poorer in patients with severe MVI compared with those with mild or no MVI. Severe MVI was a significant independent predictive factor for OS (odds ratio [OR], 2.962; P<0.001), RFS (OR, 1.638; P=0.002), and beyond Milan criteria RFS (OR, 2.797; P<0.001) on multivariable analysis. On MRI, non-smooth tumor margins (OR, 2.224; P=0.023) and satellite nodules (OR, 3.264; P<0.001) were independently associated with the severe-MVI group on multivariable analysis. Both non-smooth tumor margins and satellite nodules were associated with worse 5-year OS, RFS, and beyond Milan criteria RFS.
Conclusions
Histologic risk classification of MVI according to the number of invaded microvessels and invading carcinoma cells was a valuable predictor of prognosis in HCC patients. Non-smooth tumor margin and satellite nodules were significantly associated with severe MVI and poor prognosis.
Graphical Abstract

INTRODUCTION
Vascular invasion is one of the most significant prognostic factors of hepatocellular carcinoma (HCC) [1-11] and this parameter is consistently included in HCC staging systems, including the tumor-node-metastasis staging system used by the American Joint Committee on Cancer and the Barcelona Clinic Liver Cancer (BCLC) classification [4,6,12]. Vascular invasion can be classified into gross vascular invasion and microvascular invasion (MVI) [1,5,6,13]. Unlike gross vascular invasion, which can be detected on preoperative imaging, MVI can only be identified by microscopic examination [4-6]. MVI comprises a wide range of microscopic vascular structures, including small, thin-walled vessels in the tumor capsule or the adjacent fibrotic non-neoplastic liver, and thicker muscularized vessels that are peripheral branches of the portal veins, hepatic arteries or hepatic veins [1,6,13-16]. As MVI varies histologically according to its extent, its location, and the type of microscopic vessel involved, several studies have attempted to correlate various MVI characteristics with patient outcomes, with the ultimate goal of reaching a pathological definition of MVI that is clinically relevant for HCC management [1,6,13-16].
Interest has been growing in using imaging studies, particularly gadoxetic-enhanced magnetic resonance imaging (GAMRI) for the preoperative prediction of MVI. Peritumoral arterial enhancement, non-smooth tumor margins, and peritumoral hyposignal intensity on the hepatobiliary phase (HBP) are all suspected of being associated with MVI [8,17-22]. However, Min et al. [23] recently reported that the diagnostic accuracy of preoperative GA-MRI to detect MVI was modest, even for experienced radiologists, and interobserver agreement for MRI findings was only fair to moderate. Moreover, no studies evaluating the relationship between the degree of MVI assessed on pathology and imaging findings have been published.
We therefore aimed to evaluate the prognostic value of MVI in HCC according to its extent in HCC patients, and to correlate the imaging features with microscopy examinations to search for imaging features that are predictive of MVI.
MATERIALS AND METHODS
Patient selection and clinical analysis
In this retrospective study, consecutive adult patients with surgically resected HCC admitted to our hospital from January 2011 to December 2017 were enrolled. Patients with a history of preoperative locoregional treatment, multiple HCCs, HCCs beyond BCLC stage A, other malignancies, no follow-up after surgery, or no GA-MRI performed within 1 month before surgery were excluded (Supplementary Fig. 1). Clinical data, including age, sex, underlying disease, Child–Pugh score, preoperative laboratory findings, and follow-up data on the status at last follow-up and occurrence of extrahepatic metastasis or local recurrence, were retrieved from electronic medical records. This study was approved by the hospital’s institutional review board (IRB No. 1912-128-1091). Patient consent was waived by the IRB, due to the retrospective nature of the study.
Histopathological analysis
Pathology reports and microscopy slides (glass or digitally scanned slides) for all enrolled patients were reviewed by two pathologists (Y.J.H. and H.K., with 4 and 21 years of experience in liver pathology, respectively). Gross examination of the resected specimens was performed according to the General Rules for the Study of Primary Liver Cancer of the Korean Liver Cancer Association [24]. All specimens were sectioned at intervals of 1 cm at planes perpendicular to the parenchymal resection margin, and the most representative sections were completely histologically mapped whenever possible. Additional foci of interest (e.g., suspicious vascular or bile duct invasion, capsular invasion, and promixity to resection margins) were also sampled to allow for histological examination. The total number of slides ranged from 1 to 9 per case. The following information was recorded: tumor size, capsule formation, histological differentiation (Edmondson–Steiner grade), the presence of satellite nodules, and the presence of MVI. MVI was defined as the invasion by tumor cells of a vascular space lined by endothelial cells visible on microscopic evaluation. We further subclassified MVI according to the number of invaded microvessels (≥5 vs. <5) [1], the presence of muscularized vessel invasion [13], and the number of invaded tumor cells in the vascular spaces (≥50 cells vs. <50 cells) (Fig. 1) [1]. Cut-off values for the number of invaded microvessesls and the number of invaded tumor cells were as proposed in previous studies [1,13]. If more than one invaded microvessel was present, we counted the maximum number of invaded tumor cells. A muscularized vessel was defined as a vascular structure with visible smooth-muscle fibers in the vascular wall, and comprised microscopic branches of the portal veins, hepatic veins, and hepatic arteries. Both pathologists were blinded to the patients’ clinical and follow-up information.
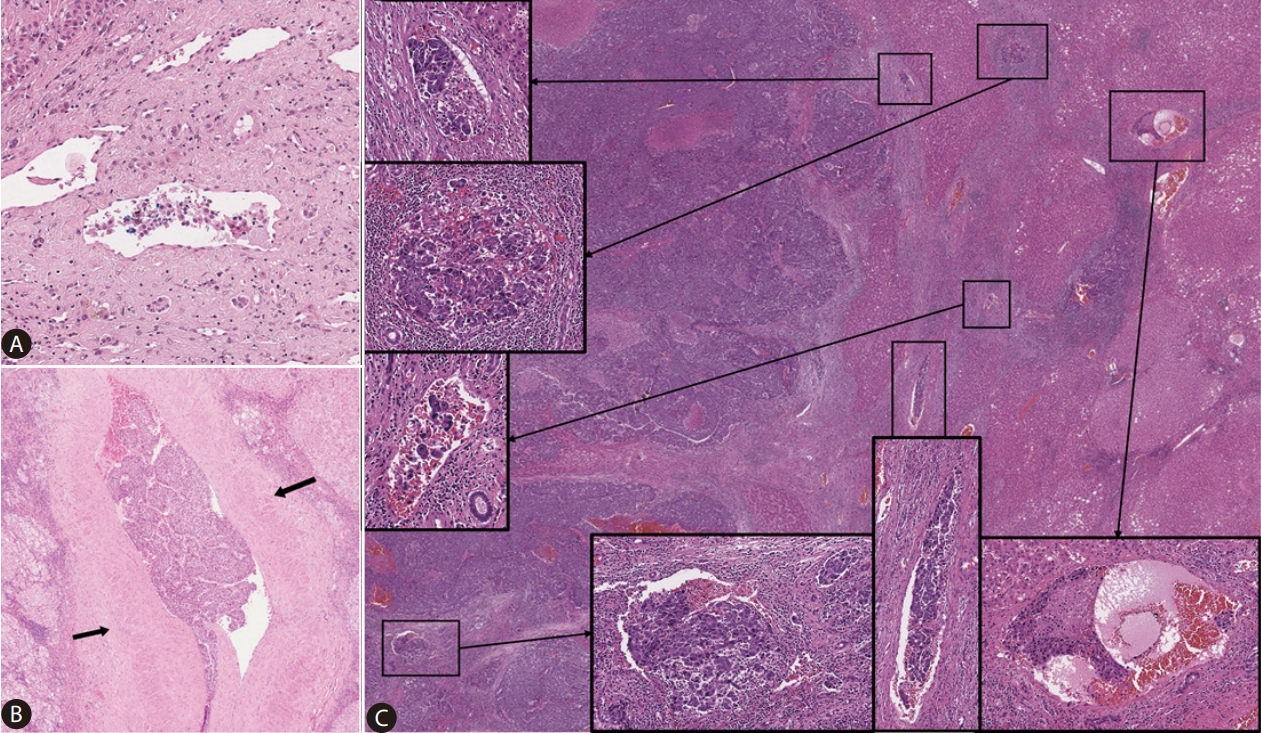
Representative hematoxylin-eosin images of hepatocellular carcinomas with microvascular invasion. Examples of cases with <50 invading carcinoma cells and non-muscularized vessel invasion (A); the number of invading carcinoma cells ≥50 and muscularized vessel invasion (B, arrows: tunica media); and the number of invaded microvessels ≥5 (C). Magnification: A: ×100, B, C: ×40, boxes: ×100.
Radiological analysis
Details of the GA-MRI are described in the Supplementary material (Supplementary Table 1). Imaging analysis was performed independently by two board-certified radiologists for the validation group patients (D.H.L. and H.B.Y., with 15 and 12 years of experience in abdominal imaging, respectively). Reviewers were informed that the patients had undergone resection for HCC, but were blinded to the pathologic information. The reviewers assessed six types of imaging features, all of which were reported in the previous studies to be associated with the presence of MVI regardless of degree: peritumoral enhancement on arterial phase; irregular rim-like enhancement on arterial phase; presence of a capsule or pseudocapsule on the portal venous and/or transitional phase; tumor margin on the HBP; peritumoral hypointensity on the HBP; and satellite nodule on the HBP. Peritumoral enhancement indicated a detectable portion of crescent or polygonal-shaped enhancement outside the tumor margin with broad contact with the tumor border in the arterial phase, becoming isointense with background liver parenchyma in the delayed phase [20,22]. Tumor margins were graded as smooth or non-smooth. A smooth tumor margin indicated no budding at the periphery of a tumor, whereas a non-smooth tumor margin indicated a minute budding portion at the periphery protruding into the liver parenchyma [18,22]. Peritumoral hypointensity indicated a flame-like or wedge-shaped decreased signal intensity around the tumor compared with adjacent liver parenchyma [21]. Satellite nodules indicated smaller nodules attached to or within 2 cm of the main tumor [19]. After an independent image review, a consensus was reached through discussion by the two reviewers.
Statistical analysis
Statistical analyses were performed using commercially available software (MedCalc, version 19.0.7, MedCalc Software, Ostend, Belgium; IBM released 2020. IBM SPSS Statistics for Windows Version 25.0 Korea, Seoul, Korea). Continuous data were presented as medians with interquartile ranges, and analyzed by Student’s t-tests and one-way analysis of variance (ANOVA). Categorical data were evaluated by chi-square tests and Fisher’s exact tests. Survival analyses for overall survival (OS), recurrence-free survival (RFS), and beyond Milan criteria RFS were carried out by using the Kaplan–Meier method and log-rank tests. OS and RFS were defined as the interval from the date of operation to the date of last living visit or death and the date of any kind of recurrence, respectively. Beyond Milan criteria RFS was defined as the interval between the date of surgery and the date of intrahepatic recurrence that was beyond the Milan criteria (i.e., single tumor ≤5 cm in diameter or up to three tumors ≤3 cm in diameter) and/or macroscopic vascular invasion or extrahepatic metastasis. In addition to conventional surrogate markers such as OS and RFS, we assessed beyond Milan criteria RFS because patients experiencing a within Milan criteria recurrence could undergo curative treatments such as ablation [25,26]. To identify factors associated with MVI, uni- and multivariable logistic regression analyses were performed. Variables with P-values <0.05 in univariable analysis were included in the multivariable analysis. Sensitivity, specificity, area under the curve (AUC), accuracy, and the positive and negative predictive values of each imaging feature were also calculated. In addition, interobserver agreements for imaging features were assessed using a kappa coefficient. The following convention was used to interpret κ values: <0.20, poor; 0.21–0.40, fair; 0.41–0.60, moderate; 0.61–0.80, substantial; and 0.81–1.00, nearly perfect [27]. A P-value <0.05 was considered statistically significant.
RESULTS
Baseline characteristics
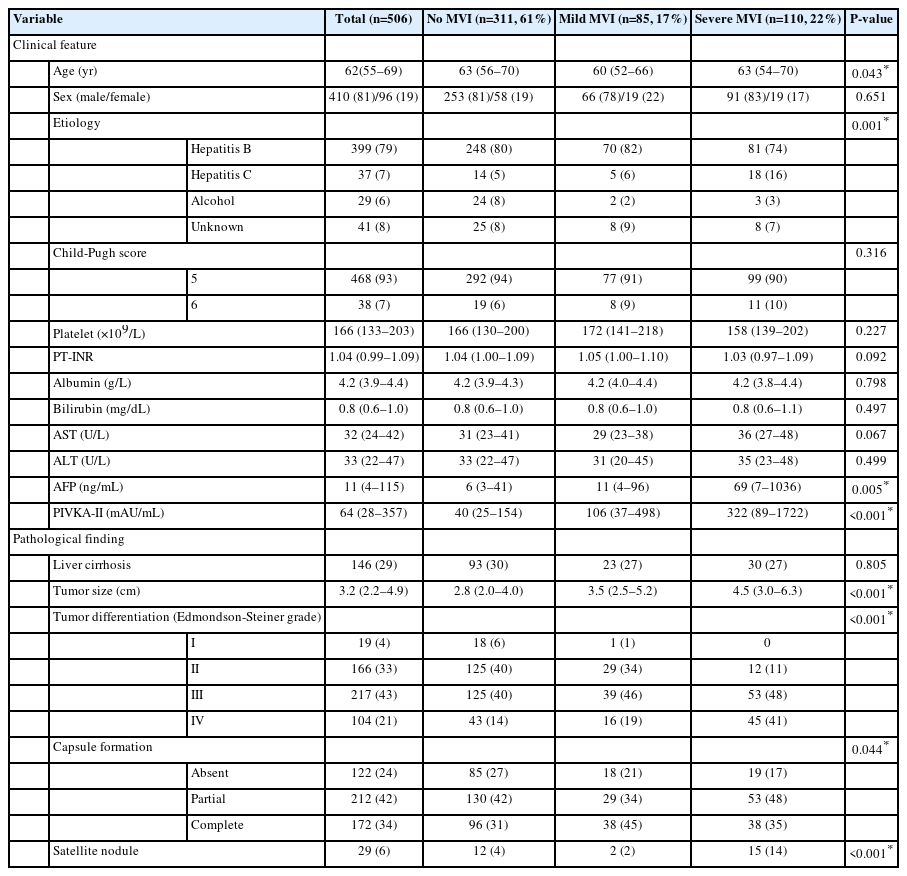
The clinicopathological features of the 506 patients included in this study are presented in Table 1. Briefly, 410 patients (81%) were male and 96 (19%) were female, with a median age of 62 years (interquartile range, 55–69). Most of the cases were related to hepatitis B viral infection (n=399, 79%), and less frequently hepatitis C viral infection (n=37, 7%) or alcohol intake (n=29, 6%). The median tumor size was 3.2 cm (interquartile range, 2.2–4.9 cm), and the tumors were Edmonson–Steiner grade III or IV in 321 cases (64%). Fibrous capsule formation, either partial or complete, was observed in 384 cases (76%) (n=212, 42% and n=172, 34%, respectively), and satellite nodules were identified in 29 cases (6%).
Comparison of clinicopathologic characteristics according to the MVI group
MVI was observed in 195 cases of HCC (MVI+, 39%). In more detail, 115 HCCs (23%) showed MVI with invasion of ≥5 vessels, 155 (31%) demonstrated MVI with ≥50 invaded tumor cells, and 41 (8%) showed muscularized vessel invasion.
Classification of MVI
To examine how individual MVI parameters affected patient prognosis, we analyzed OS according to the three MVI parameters. MVI+ HCCs with invasion of ≥5 vessels were associated with a significantly decreased OS compared to MVI+ HCCs with invasion of <5 vessels or MVI- HCCs (P<0.001; Fig. 2A). Similarly, MVI+ HCCs with ≥50 invaded tumor cells were associated with a significantly shorter OS compared with MVI+ HCCs with <50 invaded tumor cells or MVI- HCCs (P=0.001; Fig. 2B). There was no significant difference in OS according to the muscularized vessel invasion status (P=0.210, Fig. 2C).
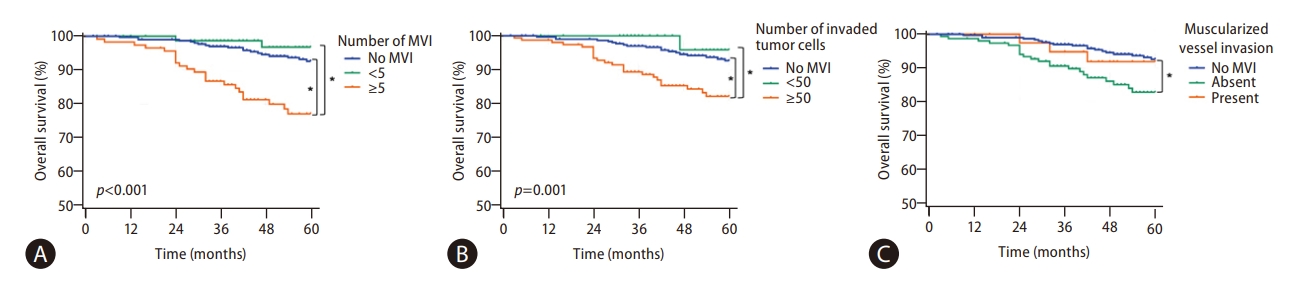
Kaplan–Meier curves demonstrating the overall survival according to three MVI parameters; the number of invaded microvessels (A), the number of invaded tumor cells (B), and the presence of muscularized vessel invasion (C). *indicates P<0.05. MVI, microvascular invasion.
Multivariable analysis revealed that the number of MVIs (≥5) and the number of invaded tumor cells (≥50) were significant independent predictive factors for OS (number of MVI: P=0.002; hazard ratio [HR], 2.534; 95% confidence interval [CI], 1.410–4.556; number of invaded tumor cells: P=0.029; HR, 1.890; 95% CI, 1.066–3.351). The number of MVIs and number of invaded tumor cells were also significant independent predictive factors for beyond Milan criteria RFS (number of MVI: P<0.001; HR, 2.504; 95% CI, 1.579–3.971; number of invaded tumor cells: P=0.002; HR, 1.982; 95% CI, 1.274–3.084).
Based on these findings, we classified MVI into three groups according to the number of the MVI features (number of invaded vessels ≥5, number of invaded tumor cells ≥50) present: “severe MVI” (defined as MVI+ HCCs with all two features), “mild MVI” (defined as MVI+ HCCs with one or none of the features), and “no MVI” (defined as absence of MVI). By this classification, the 195 MVI+ HCCs were classified into the mild MVI (n=85, 17%) and severe MVI groups (n=110, 22%).
Clinicopathologic characteristics and survival according to MVI group
A comparison of the clinicopathologic characteristics according to the MVI classification is presented in Table 1. HCCs with severe MVI were significantly associated with high serum alpha-fetoprotein (AFP) (P=0.005) and protein induced by vitamin K absence-II (PIVKA-II) levels (P<0.001), large tumor size (P<0.001), poor histologic differentiation (P<0.001), fibrous capsule formation (P=0.044), and satellite nodules (P<0.001), compared with the groups with mild or no MVI (Table 1, Fig. 3). The 5-year OS, RFS, and beyond Milan criteria RFS rates were 92.6%, 63.0%, and 88.2% in the no MVI group, 96.9%, 51.0%, and 88.4% in the mild MVI group, and 76.2%, 47.8%, and 64.4% in the severe MVI group, respectively. OS, RFS, and beyond Milan criteria RFS rates in the severe MVI group were significantly shorter compared with that of the mild MVI or no MVI groups (P<0.001 for all, Fig. 4). There was no significant difference in OS, RFS, and beyond Milan criteria RFS rates between mild MVI and no MVI groups, while RFS tended to be shorter in the mild MVI group than in the no MVI group (P=0.052). Other clinicopathological features that were associated with OS on univariable analysis were hepatitis B viral etiology (P=0.037), aspartate aminotransferase level>30 U/L (P=0.011), PIVKA-II level ≥400 AU/mL (P=0.005), tumor size ≥3 cm (P=0.001), and the presence of satellite nodules (P<0.001). Multivariable analysis demonstrated that a tumor ≥3 cm, the presence of satellite nodules, and severe MVI were significant independent prognostic factors for OS, RFS, and beyond Milan RFS (Table 2).
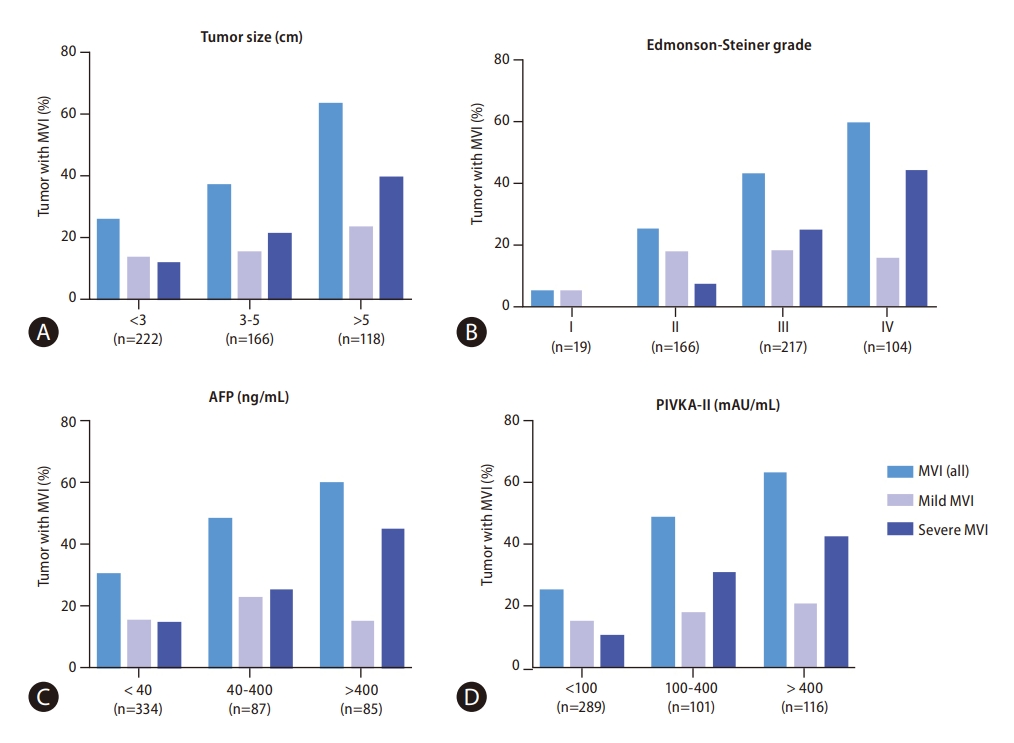
The frequency of microvascular invasion according to tumor size (A), Edmonson–Steiner grade (B), AFP level (C), and PIVKA-II level (D). MVI, microvascular invasion; AFP, alpha-fetoprotein; PIVKA-II, protein induced by vitamin K absence-II.

Overall survival (A), recurrence-free survival (B), and beyond Milan criteria recurrence-free survival (C) of hepatocellular carcinoma patients,stratified by MVI classification. *Indicates P<0.05. MVI, microvascular invasion.
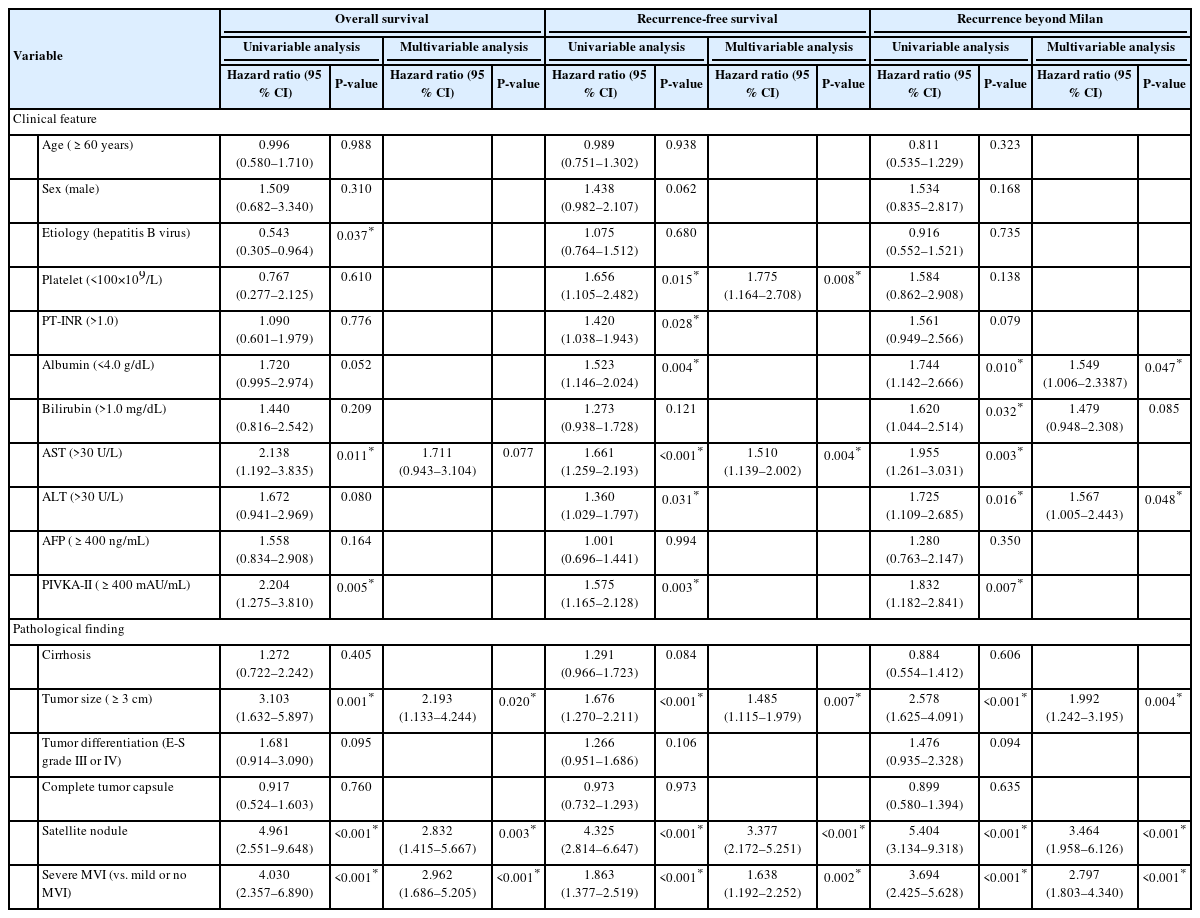
Univariable and multivariable analysis results for survival
Radiologic findings predicting the presence of severe MVI
Levels of serum bilirubin >1.0 mg/dL, serum aspartate aminotransferase >30 U/L, serum AFP ≥400 ng/mL, and serum PIVKA-II ≥400 mAU/mL, tumor size ≥3 cm on MRI, arterial peritumoral enhancement, non-smooth tumor margin, peritumoral hypointensity on HBP, and a satellite nodule were associated with severe MVI in the univariable analysis (Table 3). Multivariable analysis revealed that a serum AFP level ≥400 ng/mL (odds ratio [OR], 2.749; 95% CI, 1.560–4.844), a serum PIVKA-II level ≥400 mAU/mL (OR, 2.377; 95% CI, 1.348–4.193), non-smooth tumor margin (OR, 2.224; 95% CI, 1.115–4.434), and satellite nodule (OR, 3.264; 95% CI, 1.622–6.567) were independently associated with severe MVI (P-values ≤0.023) (Table 3, Fig. 5).

Factors predicting the presence of severe microvascular invasion
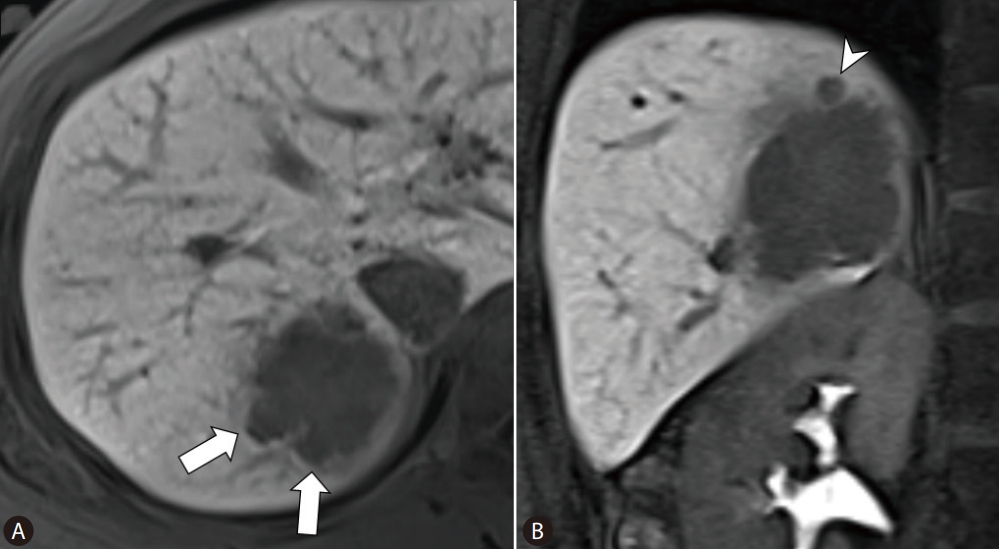
A representative example of gadoxetic acid-enhanced MRI obtained from a 47-year-old woman with hepatocellular carcinoma and severe MVI. (A) On the axial image of hepatobiliary phase, a tumor with a non-smooth margin (arrows) is visible in segment 7 of the liver. (B) On coronal imaging, a satellite nodule (arrowhead) is visible at the superior aspect of the tumor. After surgical resection, severe MVI was identified by pathological examination. Twenty-five months after surgical resection, this patient experienced recurrence with inferior vena cava invasion, and died 42 months after resection. MRI, magnetic resonance imaging; MVI, microvascular invasion.
A serum AFP level ≥400 ng/mL, a serum PIVKA-II level ≥400 mAU/mL, arterial peritumoral enhancement, and peritumoral hypointensity on HBP were statistically significant predictors of any degree of MVI (both mild and severe) (Supplementary Table 2). The 5-year OS and beyond Milan criteria RFS rates were lower in patients with HCCs with non-smooth tumor margins than in patients with HCCs having smooth tumor margins (93.8% vs. 88.1% and 93.8% vs. 78.0%, respectively) (P=0.039 and <0.001, respectively), and the 5-year RFS rate tended to be lower in patients with HCCs exhibiting non-smooth tumor margins (61.7% vs. 58.0%, P=0.059). The 5-year OS, RFS, and beyond Milan criteria RFS rates were lower in patients with HCCs with satellite nodules than in those without satellite nodules (92.6% vs. 61.5% vs. 66.5% and 85.2% vs. 40.1% vs. 59.4%, respectively) (P<0.001 for all) (Supplementary Fig. 2).
Thereafter, we classified patients according to the combination of the two imaging features: patients without non-smooth tumor margins or satellite nodules (n=160), patients with either non-smooth tumor margins or satellite nodules (n=296), and patients with both non-smooth tumor margins and satellite nodules (n=50). The 5-year OS, RFS, and beyond Milan criteria RFS rates differed among the patients without the imaging features, with only one imaging feature, and with both imaging features (93.7% vs. 92.1% vs. 65.8%, 57.1% vs. 60.7% vs. 40.9%, and 94.0% vs. 81.4% vs. 58.6%, respectively) (P<0.001 for all).
The diagnostic performance of imaging features in predicting severe MVI was moderate, based on AUCs ranging from 0.586 to 0.681. A non-smooth tumor margin demonstrated a high sensitivity and negative predictive value (88.2% and 90.7%, respectively) for predicting severe MVI, while satellite nodules demonstrated a high specificity of 88.9% (Supplementary Table 3). The results of imaging features for any degree of MVI were also similar, with AUCs ranging from 0.594 to 0.664 (Supplementary Table 4). Interobserver agreements for imaging features were as follows: 0.449 (95% CI, 0.361–0.536) for peritumoral enhancement on arterial phase, 0.513 (95% CI, 0.398–0.628) for irregular rim-like enhancement on arterial phase, 0.447 (95% CI, 0.373–0.520) for presence of capsules or pseudocapsules on portal venous and/or transitional phase, 0.478 (95% CI, 0.386–0.570) for tumor margin on HBP, 0.607 (95% CI, 0.535–0.679) for peritumoral hypointensity on HBP, and 0.395 (95% CI, 0.254–0.535) for a satellite nodule on HBP.
DISCUSSION
MVI is the first step of intrahepatic tumor spread and distant metastasis of HCC, and is a known poor prognostic factor for HCC patients [1-11,28,29]. However, microscopically, there is a wide spectrum of MVI. Roayaie et al. [13] reported that invasion of a vessel with a muscular wall can predict recurrence and survival among HCC patients. Fujita et al. [14] reported that HCC patients showing multiple microscopic portal venous invasion with more than 50 invading carcinoma cells that were more aggressive had reduced survival. Here, we analyzed different types of MVI, and found that the number of invaded microvessels and the number of invaded tumor cells/vessel significantly correlated with survival. We also found that severe MVI (in ≥5 vessels and ≥50 tumor cells/vessel) was associated with poor survival and aggressive behavior. There was no significant difference in survival between the groups with mild MVI and no MVI, although there was a tendency for a decreased RFS for cases with mild MVI. These findings suggest that the degree of MVI is prognostically significant, particularly for identifying a subset of HCC patients who are more likely to demonstrate “severe” (beyond Milan criteria) recurrences, which are less likely to be amenable to curative therapy after recurrence [26].
Although MVI is an important factor in HCC staging, the presence of MVI in some cases may be missed due to sampling or interpretation issues, possibly resulting in understaging of the tumor. This is particularly likely in cases of HCCs with a few floating tumor cells in microvascular structures of the peritumoral fibrous stroma; artifactual displacement of tumor cells into the vascular lumina may be possible, as HCC is often subject to contamination during slide preparation. Evaluating the microscopic extent of MVI would help select a more prognostically relevant group of HCCs with unequivocal MVI.
The presence of muscularized MVI had no prognostic significance in our patient cohort, unlike previous studies [1,13,14]. The low frequency of muscularized MVI (8%) in this study may partly account for this finding. Muscularized MVI primarily involves peripheral branches of the portal and hepatic veins, and HCCs with these features were less likely to have been included in this cohort of surgically resected, solitary BCLC stage A HCCs. Other studies have evaluated the distance of the MVI from the main tumor, and the degree of filling of the microvessels by the tumor [13,15]. One limitation of applying this distance factor in classif ying MVI using conventional microscopy slides is that an adequate margin of non-tumoral hepatic parenchymal tissue needs to be present on the same slide for an accurate measurement of the distance; this may not be realistic without prior histological mapping of the tumor and its adjacent parenchyma.
Many studies have evaluated the preoperative predictive ability of imaging tests such as GA-MRI for MVI. Among the imaging features, peritumoral arterial enhancement, non-smooth tumor margin, and peritumoral hyposignal intensity on HBP are reportedly associated with MVI [17-22]. We found that the presence of non-smooth tumor margins and satellite nodules in MRI scans were significant predictors of severe MVI. In addition, HCCs with non-smooth tumor margins and/or satellite nodules on GA-MRI were associated with lower 5-year OS and beyond Milan criteria RFS rates, compared with those without the two features. This suggests that these two features in GA-MRI may have adverse outcomes in HCC patients, possibly in association with severe MVI. However, we also found that the ability of imaging features to predict severe MVI or any degree of MVI were at best modest, with AUCs ranging from 0.586 to 0.681, similar to results of previous studies [17-23]. Among the six imaging features assessed in our study, a non-smooth tumor margin may be useful for excluding the presence of severe MVI, as a non-smooth tumor margin showed the highest sensitivity (88.2%) and highest negative predictive value (90.7%) for detecting severe MVI. If the tumor margin is smooth, severe MVI would therefore be less likely to be present. In contrast, the presence of satellite nodules may be used cautiously to predict the presence of severe MVI, due to high specificity (88.9%).
This study has some limitations. First, due to its retrospective design, gross examination may not have been entirely consistent over the 7-year period, although we did follow a standardized protocol for liver tumor resection specimens. The number of slides per specimen could affect the result of MVI estimation. For example, the number of sections may vary depending on the size of the tumor: smaller tumors are completely submitted for histological examination, while for huge tumors, it is impractical to examine the entire tumor. It is therefore possible to underestimate the degree of MVI in such cases. Second, when counting the number of invaded microvessels, we counted the number of cross-sectioned invaded vessels, regardless of whether some of them represent cross-sections of the same tortuous vessel or its branches. Although one invaded microvessel may yield multiple vascular profiles on a particular section, increasing the number of MVI counts, this situation would more likely occur in cases with extensive MVI. For practical purposes, it would be more realistic to stratify MVI as mild versus severe using eyeballed estimations, as counting the actual numbers of MVI and tumorcells in microvascular lumens may be impractical in daily practice. Nevertheless, this study demonstrates that the presence of a large number of HCC tumor cells involving multiple microvessels, regardless of the type of microvessel, is relevant for HCC prognostication. We also identified GA-MRI imaging features that may help predict the presence of severe MVI in this large cohort of HCC patients.
In conclusion, we demonstrated that microscopic subclassification of the severity of MVI is valuable for prognostication of HCC, and that non-smooth tumor margins and satellite nodules on MRI may help predict severe MVI.
Notes
Authors’ contribution
Haeryoung Kim and Dong Ho Lee conceived and designed the study. Yoon Jung Hwang, Jae Seok Bae, Haeryoung Kim, Dong Ho Lee, Youngeun Lee and Bo Yun Hur collected, analyzed, and interpreted the data and wrote the manuscript. Yoon Jung Hwang and Jae Seok Bae performed the statistical analysis. Haeryoung Kim and Dong Ho Lee provided the study material and clinical data. Yoon Jung Hwang, Jae Seok Bae, Haeryoung Kim, and Dong Ho Lee analyzed and interpreted the data. Yoon Jung Hwang, Jae Seok Bae, Haeryoung Kim, Dong Ho Lee, Youngeun Lee and Bo Yun Hur edited the manuscript. All authors contributed to the final approval of the manuscript.
Conflicts of Interest
The authors have no conflictsto disclose.
Acknowledgements
This study was supported by the National Research Foundation of Korea (NRF) grant funded by the Korea government (MSIT) (NRF-2019R1A2C2010056, NRF-2022R1A2C2010348) (to H.K.).
SUPPLEMENTAL MATERIAL
Supplementary material is available at Clinical and Molecular Hepatology website (http://www.e-cmh.org).
Gadoxetic acid-enhanced MRI acquisition
MRI parameters
Factors predicting the presence of any degree of microvascular invasion
Diagnostic performance of MRI findings in prediction of severe microvascular invasion
Diagnostic performance of MRI findings in prediction of any degree of microvascular invasion
Flow diagram of the patient selection process. HCC, hepatocellular carcinoma; BCLC, Barcelona Clinic Liver Cancer; HBA-MRI, hepatobiliary contrast agent magnetic resonance imaging.
Overall survival (A–C), recurrence-free survival (D–F) and beyond Milan criteria recurrence-free survival (G–I) of hepatocellular carcinoma patients, stratified by MR imaging features. MVI, microvascular invasion; RFS, recurrence-free survival.
Abbreviations
AFP
alpha-fetoprotein
AUC
area of the curve
BCLC
Barcelona Clinic Liver Cancer
GA-MRI
gadoxetic-enhanced magnetic resonance imaging
HBP
hepatobiliary phase
HCC
hepatocellular carcinoma
MVI
microvascular invasion
PIVKA-II
protein induced by vitamin K absence-II
OS
overall survival
RFS
beyond Milan recurrencefree survival
References
Article information Continued
Notes
Study Highlights
• The presence of severe MVI (≥5 microvessels and the presence of microvessels with ≥50 invaded tumor cells) was significantly associated with decreased survival, while no significant difference in survival was evident between cases of mild MVI and no MVI.
• Non-smooth tumor margins (sensitivity, 88.2%; negative predictive value, 90.7%) and satellite nodules (specificity, 88.9%) on MRI were significantly associated with severe MVI, and both imaging features were associated with decreased survival.