Clinical usefulness of psoas muscle thickness for the diagnosis of sarcopenia in patients with liver cirrhosis
Article information

Abstract
Background/Aims
The most widely used method for diagnosing sarcopenia is the skeletal muscle index (SMI). Several studies have suggested that psoas muscle thickness per height (PMTH) is also effective for detecting sarcopenia and predicting prognosis in patients with cirrhosis. The aim of this study was to evaluate the optimal cutoff values of PMTH for detecting sarcopenia in cirrhotic patients.
Methods
All cirrhotic patients who underwent abdominal computed tomography (CT) scan including L3 and umbilical levels for measuring SMI and transverse psoas muscle thickness, respectively, were included. Two definitions of sarcopenia were used: (1) sex-specific cutoffs of SMI (≤52.4 cm2 /m2 in men and ≤38.5 cm2 /m2 in women) for SMI-sarcopenia and (2) cutoff of PMTH (<16.8 mm/m) for PMTH-sarcopenia.
Results
Six hundred fifty-three patients were included. The average age was 53.6 ± 10.2 years, and 499 patients (76.4%) were men. PMTH correlated well with SMI in both men and women (P<0.001). Two hundred forty-one (36.9%) patients met the criteria for SMI-sarcopenia. The best PMTH cutoff values for predicting SMI-sarcopenia were 17.3 mm/m in men and 10.4 mm/m in women, and these were defined as sex-specific cutoffs of PMTH (SsPMTH). The previously published cutoff of PMTH was defined as sex-nonspecific cutoff of PMTH (SnPMTH). Two hundred thirty (35.2%) patients were diagnosed with SsPMTH-sarcopenia, and 280 (44.4%) patients were diagnosed with SnPMTH-sarcopenia. On a multivariate Cox regression analysis, SsPMTH-sarcopenia (hazard ratio [HR], 1.944; 95% confidence interval [CI], 1.144–3.304; P=0.014) was significantly associated with mortality, while SnPMTH-sarcopenia was not (HR, 1.446; 95% CI, 0.861–2.431; P=0.164).
Conclusions
PMTH was well correlated with SMI in cirrhotic patients. SsPMTH-sarcopenia was an independent predictor of mortality in these patients and more accurately predicted mortality compared to SnPMTH-sarcopenia.
INTRODUCTION
Sarcopenia is characterized by a decline in muscle mass, muscle strength, and physical activity [1]. In the past, sarcopenia was only considered part of the aging process [2]. However, recent studies have shown that sarcopenia is associated with impaired physical capability [3-5], poor quality of life, adverse metabolic effects, falls [6], disability, mortality [7,8], and high healthcare expenditures [9]. Therefore, sarcopenia is increasingly recognized as a progressive disease frequently associated with various comorbidities and mortality [10].
Malnutrition is common in patients with advanced liver diseases, and malnutrition and sarcopenia frequently occur in patients with liver cirrhosis [11-15]. A number of studies have reported that, in cases of cirrhosis, sarcopenia is an independent prognostic factor of prognosis [13-21]. However, objective assessment of muscle mass in cirrhotic patients remains challenging. Various definitions and measurement methods have been used to quantify and diagnose sarcopenia. However, there is still no consensus on measurement and cutoff values [22].
Radiological image analysis is being increasingly utilized to diagnose sarcopenia in patients with cirrhosis [10]. The skeletal muscle index (SMI), assessed by the cross-sectional area of several muscles on computed tomography (CT) at the L3 vertebral level, is the most widely used technique. SMI has been shown to be an independent predictor of mortality in cirrhotic patients [23-26]. Abdominal muscles, including the psoas muscle, are appropriate to use for the assessment of skeletal muscle mass, because abdominal muscle mass, unlike appendicular muscle mass, is relatively independent of activity level [10]. However, delineating the surface of different groups of muscles is relatively complex, takes time and specific software is needed for computation. Therefore, SMI is hardly generalizable to outpatients.
A recent study used psoas muscle thickness measured on CT to diagnose sarcopenia [27]. They measured transverse psoas muscle thickness, defined as diameter of the psoas muscle perpendicular to the longest axial diameter of the muscle at the umbilical level, and then normalized the value to the patient’s height by dividing transverse psoas muscle thickness by height. This psoas muscle thickness/height (PMTH) was easily calculated as muscle mass and was determined to be associated with mortality in patients with cirrhosis. This method does not require specific software and can be calculated quickly. However, the study did not correlate PMTH with other measurements, such as psoas muscle area or SMI. Also, sex differences in muscle mass were not considered, and 16.8 mm/m was suggested as a cutoff value for the definition of sarcopenia in all patients. Our study was performed to measure how well PMTH predicts outcomes in cirrhotic patients and to establish optimal PMTH cutoff values for detecting sarcopenia by sex.
MATERIALS AND METHODS
Patients
We included all patients with liver cirrhosis who underwent an abdominal CT and laboratory tests at the Korea University Anam Hospital, Soonchunhyang University Bucheon Hospital, and Wonju Severance Christian Hospital. Patients with hepatocellular carcinoma and parenchymal renal disease were excluded. Liver cirrhosis was diagnosed histologically or clinically. The protocol was approved by the Human Ethics Committee of the Korea University Anam Hospital and conformed to the ethical guidelines of the 2008 Declaration of Helsinki. A waiver of consent was obtained, and the patient records were anonymized and de-identified prior to analysis.
Data collection
Data on age, sex, height, body weight, body mass index (BMI), underlying liver diseases, and results of the baseline laboratory tests were collected for each patient. Baseline laboratory tests consisted of platelet count, international normalized ratio (INR), serum aspartate aminotransferase (AST), alanine aminotransferase (ALT), bilirubin, albumin, creatinine (Cr), and sodium levels. The model for end-stage liver disease (MELD) score was calculated using the following equation: 9.57×loge (creatinine, mg/dL)+3.78×loge (bilirubin, mg/dL)+11.2×loge (INR)+6.43 [28]. Clinical, laboratory, and radiological data used for the analysis were obtained within 1 week of the CT image used to quantify skeletal muscle mass.
Measurement of skeletal muscle area and definition of sarcopenia
Two axial images one at the L3 vertebral body and one at the level of the umbilicus were selected for each case. To determine PMTH, axial and transverse thickness of right psoas muscle was measured at the level of the umbilicus. Axial psoas muscle thickness was defined as the largest diameter of psoas muscle on an axial view (Fig. 1). Transversal psoas muscle thickness was defined as the diameter of psoas muscle perpendicular to the axial diameter. Psoas muscle thickness was normalized to the patient’s height. For SMI, skeletal muscle area (cm2) was measured by a trained operator with the NIH ImageJ software which enables specific tissue demarcation using previously reported Hounsfield unit thresholds (for skeletal muscle, -29 to +150) [29]. The skeletal muscle area at L3 vertebra was normalized to the patient’s height squared (m2).
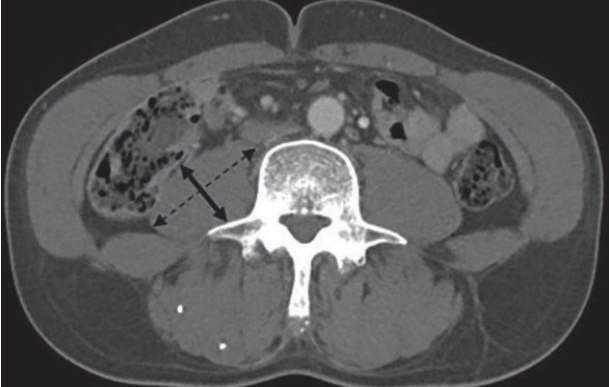
Measurement of psoas muscle thickness/height at the level of the umbilicus on a computed tomography (CT) scan image. Axial CT scan at the level of the umbilicus in a patient with hepatitis B virus-related cirrhosis and a model for end-stage liver disease (MELD) score of 10 with no ascites. Psoas muscle thickness corresponds to the diameter of transversal psoas muscle (left-right arrow) perpendicular to the axial diameter (dotted left-right arrow).
Sarcopenia was defined by previously published cutoffs: (1) sexspecific cutoffs of SMI (≤52.4 cm2/m2 in men and ≤38.5 cm2/m2 in women) for SMI-sarcopenia [14]; (2) cutoff of PMTH (<16.8 mm/m) for PMTH-sarcopenia (sex-nonspecific PMTH sarcopenia, SnPMTHsarcopenia) [27].
Statistical analysis
Statistical analyses were performed using the Statistical Package for the Social Science (SPSS) version 20.0 for Windows (IBM Corp., Armonk, NY, USA). All data are expressed as either mean ± standard deviation for continuous variables or number of patients (percentage) for categorical variables. Groups were compared using the chi-square test for categorical variables and Student’s t-test for quantitative variables. The area under the receiver operating characteristic curve (AUROC) and 95% confidence interval (CI) were used to find the optimal values of sex-specific psoas muscle thickness/height (SsPMTH)-sarcopenia to predict SMI-sarcopenia. Survival time was calculated as the time interval from the date of the abdominal CT scan to death or to the end of the follow-up. Patients who had liver transplantation were censored at the time of liver transplantation. Survival curves were constructed using the Kaplan-Meier method, and differences were assessed by the log-rank test. A Cox regression analysis was performed to find which variables were predictors of mortality. Hazard ratios (HRs) and 95% CIs were calculated. A two-tailed P-value of less than 0.05 was considered statistically significant.
RESULTS
Baseline characteristics
Table 1 presents baseline characteristics of all included patients. A total of 653 patients were included. The average age was 53.6 ± 10.2 years and 499 patients (76.4%) were men. Alcoholic liver disease was the most common underlying liver disease (326 patients, 49.9%), followed by chronic viral hepatitis (269 patients, 41.0%). Most of the cause of chronic viral hepatitis was chronic hepatitis B (244 of 269 patients, 90.7%). The average MELD score was 11.4±4.8. Ascites was absent in 332 patients (50.8%), mild in 197 patients (30.2%), and moderate in 124 patients (19.0%).

Baseline characteristics of all included patients with liver cirrhosis
Sarcopenia defined by SMI
Two hundred forty-one (36.9%) patients met the criteria for SMI-sarcopenia. In this group, men and alcoholic liver disease were more common than those that did not meet the threshold for SMI-sarcopenia (Table 2). Serum bilirubin level and the MELD score were significantly higher in patients with SMI-sarcopenia, while BMI and serum sodium level were significantly lower compared to those without SMI-sarcopenia. PMTH was significantly lower in the patients with SMI-sarcopenia compared to those without SMI-sarcopenia (15.8±3.6 mm/m vs. 18.4±4.0 mm/m, P<0.001). On a multivariate binary regression analysis, the presence of SMI-based sarcopenia was independently associated with male sex (odds ratio [OR], 7.657; 95% CI, 4.190–13.992; P<0.001), lower BMI (OR, 0.709; 95% CI, 0.661–0.761; P<0.001), and serum bilirubin level (OR, 1.068; 95% CI, 1.013–1.125; P=0.015) (Table 3).

Baseline characteristics according to the presence of sarcopenia based on the SMI and sex-nonspecific and sex-specific PMTH definitions

Univariate and multivariate binary regression analyses for the presence of sarcopenia based on the SMI definition
Sarcopenia defined by PMTH
PMTH was significantly higher in men than in women (18.1±3.8 mm/m vs. 15.2±3.9 mm/m, P<0.001). PMTH was well correlated with SMI (Pearson’s correlation coefficient, 0.526; P<0.001) (Fig. 2A). The Pearson’s correlation coefficient differed between men (0.505, P<0.001) (Fig. 2B) and women (0.380, P<0.001) (Fig. 2C). Following previous cutoff value, PMTH was less than 16.8 mm/m in 290 patients (44.4%) and they were defined as sex-nonspecific psoas muscle thickness/height (SnPMTH)-sarcopenia.
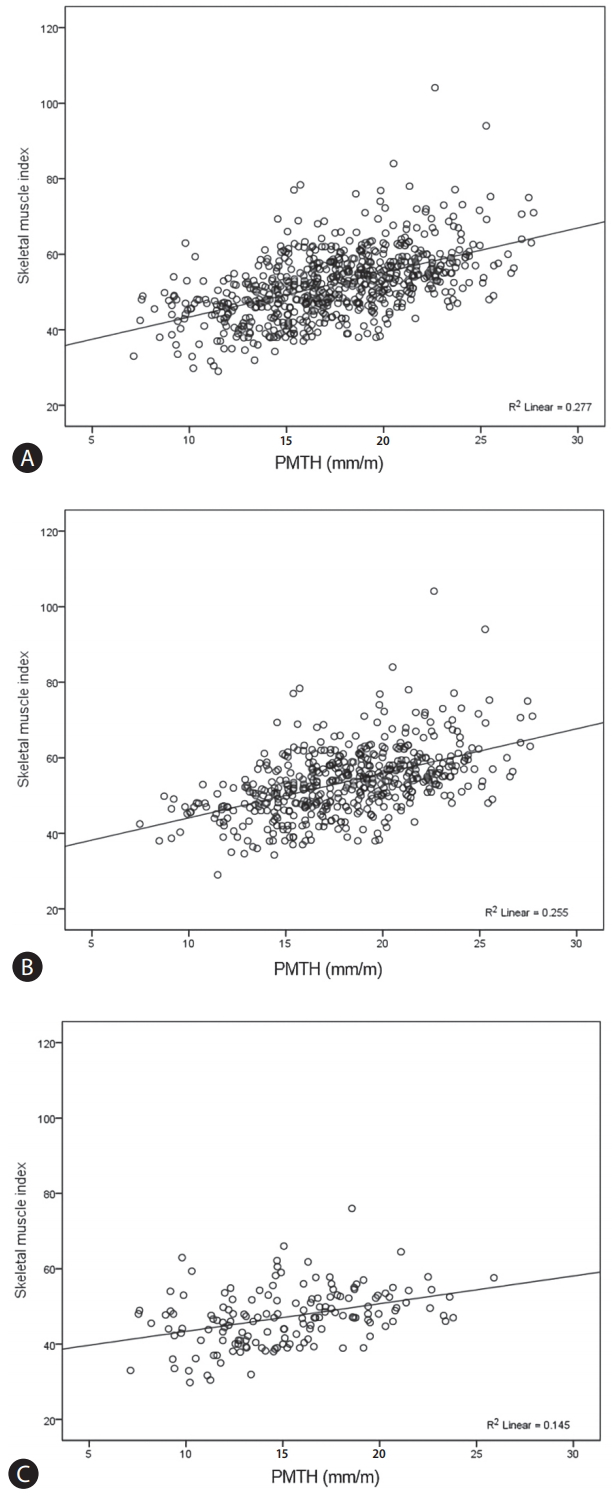
Correlation between psoas muscle thickness/height and skeletal muscle index. Correlation between psoas muscle thickness/height and skeletal muscle index in all enrolled patients (A), in men (B), and in women (C). PMTH was well correlated with SMI (Pearson’s correlation coefficient, 0.526; P<0.001) (A). The Pearson’s correlation coefficient differed between men (0.505, P<0.001) (B) and women (0.380, P<0.001) (C). PMTH, psoas muscle thickness/height; SMI, skeletal muscle index.
The AUROCs of PMTH for predicting SMI-sarcopenia were 0.779 (95% CI, 0.739–0.819) in men (Fig. 3A) and 0.842 (95% CI, 0.772–0.912) in women (Fig. 3B). The best cutoff values for predicting SMI-sarcopenia were 17.3 mm/m in men (sensitivity, 65.3%; specificity, 76.3%) and 10.4 mm/m in women (sensitivity, 31.2%; specificity, 90.6%). Using these cutoff values, sarcopenia was diagnosed in 230 patients (35.2%) and they were defined as SsPMTH-sarcopenia.

Area under the receiver operating characteristic curve for detecting sarcopenia. Area under the receiver operating characteristic curve for detecting sarcopenia defined by smooth muscle index based on psoas muscle thickness/height in men (A) and in women (B). The area under the receiver operating characteristic curve of psoas muscle thickness/height for predicting skeletal muscle index-sarcopenia was 0.779 (95% confidence interval [CI], 0.739-0.819) in men (A) and 0.842 (95% CI, 0.772-0.912) in women (B).
When sarcopenia was diagnosed using the SnPMTH-sarcopenia, more women were defined as sarcopenic. Serum bilirubin level was significantly higher in patients with SnPMTH-sarcopenia, while BMI, serum albumin, and creatinine levels were significantly lower. The MELD score did not differ between the two groups (11.8±4.9 vs. 11.1±4.7, P=0.083) (Table 2). On multivariate binary regression analysis, the presence of SnPMTH-sarcopenia was independently associated with female sex (OR, 4.794; 95% CI, 3.046–7.545; P<0.001), lower BMI (OR, 0.777; 95% CI, 0.734–0.822; P<0.001), and serum albumin level (OR, 0.486; 95% CI, 0.366–0.645; P<0.001) (Table 4).
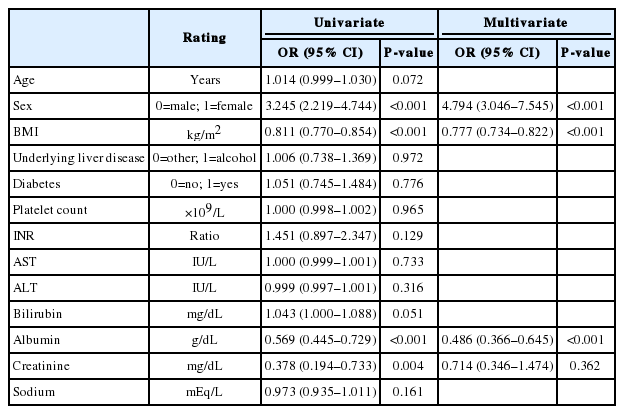
Univariate and multivariate binary regression analyses for the presence of sarcopenia based on the sex-nonspecific PMTH definition
When sarcopenia was defined with SsPMTH-sarcopenia, men and those with alcoholic liver disease were more frequently defined as sarcopenic. Serum bilirubin level and the MELD score were significantly higher in patients with SsPMTH-sarcopenia, while BMI and serum sodium level were significantly lower (Table 2). On multivariate binary regression analysis, the presence of SsPMTH-sarcopenia was independently associated with sex (OR, 5.558; 95% CI, 3.109–9.937; P<0.001), lower BMI (OR, 0.759; 95% CI, 0.712–0.810; P<0.001), alcoholic liver disease (OR, 1.592; 95% CI, 1.080–2.346; P=0.019), and serum albumin level (OR, 0.417; 95% CI, 0.288–0.603; P<0.001) (Table 5).
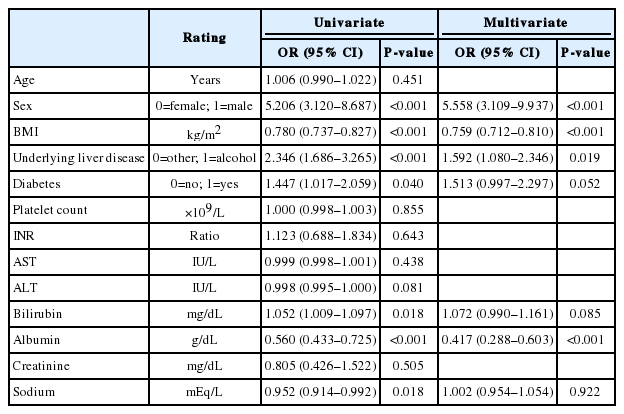
Univariate and multivariate binary regression analyses for the presence of sarcopenia based on the sex-specific PMTH definition
Mortality
Cumulative survival rate differed significantly according to the presence of sarcopenia (Fig. 4). With the definition of sarcopenia by SMI, survival rates at 1, 2, and 3 years were 97.7%, 93.3%, and 88.3%, respectively, in patients without sarcopenia, while those were 86.2%, 81.0%, and 78.8%, respectively, in patients with sarcopenia (P<0.001) (Fig. 4A). With the definition of sarcopenia by sex-nonspecific cutoff of PMTH the survival rates at 1, 2, and 3 years were 95.3%, 91.5%, and 88.4%, respectively, in patients without sarcopenia, while those were 91.4%, 85.6%, and 80.6%, respectively, in patients with sarcopenia (P=0.024) (Fig. 4B). With the definition of sarcopenia by sex-specific cutoff of PMTH, survival rates at 1, 2, and 3 years were 96.2%, 92.4%, and 89.7%, respectively, in patients without sarcopenia, while those were 90.2%, 84.1%, and 78.5%, respectively, in patients with sarcopenia (P=0.002) (Fig. 4C).
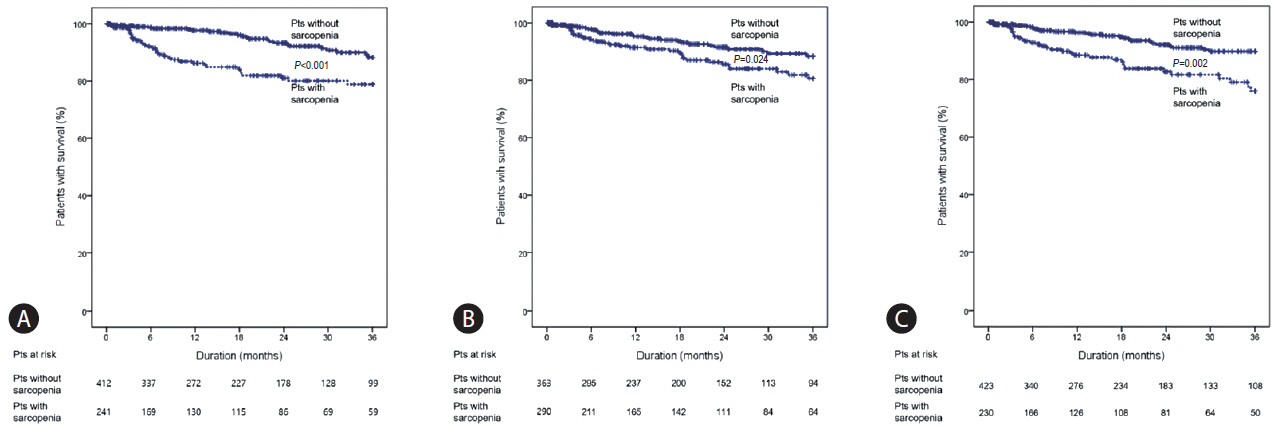
Kaplan-Meier analysis for survival according to the presence of sarcopenia. Kaplan-Meier curve for cumulative survival of patients with liver cirrhosis according to the presence of sarcopenia defined by smooth muscle index (A), sex-nonspecific PMTH (B), and sex-specific PMTH (C). With the definition of sarcopenia based on SMI, survival rates at 1, 2, and 3 years were 97.7%, 93.3%, and 88.3%, respectively, in patients without sarcopenia, while they were 86.2%, 81.0%, and 78.8% in patients with sarcopenia (P<0.001) (A). With the definition of sarcopenia based on the sex-nonspecific cutoff of PMTH, the survival rates at 1, 2, and 3 years were 95.3%, 91.5%, and 88.4%, respectively, in patients without sarcopenia, while they were 91.4%, 85.6%, and 80.6% in patients with sarcopenia (P=0.024) (B). With the definition of sarcopenia by sex-specific cutoff of PMTH, survival rates at 1, 2, and 3 years were 96.2%, 92.4%, and 89.7%, respectively, in patients without sarcopenia, while they were 90.2%, 84.1%, and 78.5% in patients with sarcopenia (P=0.002) (C). Pts, patients; PMTH, psoas muscle thickness/height; SMI, skeletal muscle index.
On a univariate Cox regression analysis, the presence of sarcopenia was significantly associated with mortality when any definition was applied. In addition, underlying liver disease, platelet count, INR, serum bilirubin, albumin, creatinine, and sodium levels were significantly associated with mortality (Table 6).
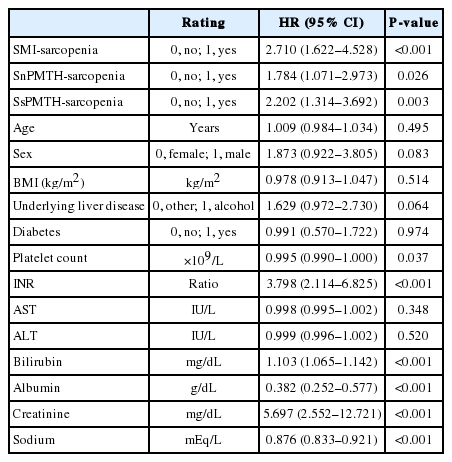
Univariate Cox regression analysis for mortality
A multivariate Cox regression analysis was performed after adjusting for underlying liver disease, platelet count, INR, bilirubin, albumin, Cr, and sodium levels. SMI-sarcopenia (HR, 1.841; 95% CI, 1.072–3.164; P=0.027) and SsPMTH-sarcopenia (HR, 1.818; 95% CI, 1.056–3.130; P=0.031) were significantly associated with mortality, but there was no significant association between SnPMTH-sarcopenia and mortality (HR, 1.613; 95% CI, 0.950–2.739; P=0.077) (Table 7).

Cox regression analysis adjusted for underlying liver disease, platelet count, INR, and serum bilirubin, albumin, creatinine, and sodium levels
DISCUSSION
In this study, PMTH was well correlated with SMI, and the AUROC of PMTH for predicting sarcopenia defined by SMI was relatively high in both men and women suggesting that PMTH is a more simple, objective, and readily available method to assess skeletal muscle mass. Similarly to previous studies, SMI-based sarcopenia was predictive of mortality, independently of other possible confounders. Interestingly, we found that sex-specific PMTH-based sarcopenia was significantly associated with mortality, while sexnonspecific PMTH-based sarcopenia was not.
A number of studies showed men had significantly more skeletal muscle mass than in women, even after adjustment for body weight and height [30-33]. Moreover, the association between sarcopenia and functional decline is stronger in men than in women [34,35]. These differences may be a natural result of the different exposure of sex hormones and the greater amount of physical activity in men. In muscle quantification studies based on magnetic resonance imaging, the muscle mass of the psoas major showed significant sex differences while the rectus abdominis, latissimus dorsi, or thigh muscles did not [36,37]. Reasons for these sex differences are still unknown, but a greater functional requirement of trunk musculature might be associated with greater development of the psoas muscle in men who perform more physical activities than women [38-40]. Also, during growth, women experience a lower increase in waist circumference than men. This morphological difference in the abdominal region might be associated with the difference in psoas muscle mass between the sexes [41-44].
Recently, CT with image analysis programs is being increasingly used to assess skeletal muscle mass. Abdominal CT would be difficult to justify for muscle mass measurements alone due to cost and radiation exposure. However, as most patients with liver cirrhosis have surveillance scans for detecting focal liver lesions [10], additional CT scans for measuring muscle mass are not usually needed.
Previous researchers have suggested that PMTH, measured on CT at the level of the umbilicus, may be predictive of mortality in cirrhotic patients independently of the MELD and MELD-Na scores. They also suggested that the optimal cutoff point of 16.8 mm/m be used to predict mortality in both sexes [27]. However, contrary to other studies, when this cutoff value was applied, sarcopenia was more frequent in women than in men. Besides, the mean MELD score (11.8±4.9 vs. 11.1±4.7, P=0.083) and mortality (HR, 1.613; 95% CI, 0.950–2.739; P=0.077) were not significantly different between patients with and without SnPMTH sarcopenia. These results could be indicative of weakness of SnPMTH in predicting prognosis of cirrhotic patients. As amount of muscle mass differs with gender (lower in females) [25] after adjustment for height, applying different cutoff values based on sex would be more appropriate. Therefore, we found the sex-specific cutoffs of PMTH (<17.3 mm/m in men and <10.4 mm/m in women) to be the optimal values for predicting sarcopenia defined by SMI. Among 290 patients (44.4%) classified as sarcopenic by SnPMTH, 60 (9.2%) were classified as non-sarcopenic by SsPMTH. Sarcopenia defined by sex-specific PMTH (HR, 1.818; 95% CI, 1.056–3.130; P=0.031) was significantly associated with mortality.
It is hard to compare the results of the previous study and our current study due to the disparities between the cohorts. First, mean MELD score was higher in the previous study (16.0±7) than in our study (11.4±4.8). This was because only patients registered for deceased donor liver transplantation were enrolled in the previous study, while we included all patients with liver cirrhosis who had an abdominal CT scan. Therefore, mortality at 6 months was higher in the previous study (12.3%) than in our study (3.7%). Second, the previous study included HCC patients (46%), who were excluded in our study in consideration of the impact of HCC on mortality. Our data more clearly shows the clinical effect of sarcopenia in cirrhotic patients. Lastly, mean BMI (23.6±3.8 kg/m2 vs. 26.2±4.7 kg/m2) and mean PMTH was lower in our study. This disparity may have been caused by the differences in body size, lifestyle, and cultural background between Asian and Caucasian populations [45]. However, the prevalence of sarcopenia is usually not higher in Asians compared to Caucasians, although mean BMI and mean muscle mass are lower in Asians. This difference may be due to the characteristics of older Asian people, who have walked and performed more physical activities since their early adulthood because of the underdeveloped living conditions and transportation.
This study has several limitations. First, it is a retrospective study, and PMTH was measured by only one clinician. We could not evaluate inter-observer variance, although several studies have already shown relatively good agreement between observers. Second, PMTH has inherent limitations. Transverse psoas muscle thickness was measured at the level of the umbilicus, but the level of the umbilicus may vary if ascites is present. However, umbilical level can be easily identified on a CT scan than given level of the lumbar section, because sacralization of the L5 vertebrae and lumbar wedge fractures in patients with osteoporosis make detection of given lumbar level difficult [27]. In a recent systematic review and meta-analysis on the impact of CT-assessed skeletal muscle mass on outcomes in liver transplant candidates [22], only one study measured skeletal muscle mass using PMTH [27]. Further studies validating the efficacy of PMTH in patients with liver cirrhosis are needed. Lastly, assessment of muscle mass by CT scan also should be taken into account. Since muscle strength and amount of fat content is related to CT attenuation, CT attenuation is often lower in the muscles of cirrhotic patients compared to controls [25]. It is uncertain whether sarcopenia in cirrhotic patients can be diagnosed with hounsfield unit alone. To overcome these limitations, numerous measurement methods have been suggested, however, few studies have directly compared the different methods so far.
In conclusion, we found that PMTH measured on a single axial CT scan image at the level of the umbilicus may be a good substitute for SMI and an independent prognostic factor for mortality in cirrhotic patients. Additionally, applying different cutoff values based on sex improves the prognostic value of PMTH.
Notes
Authors’ contribution
Study design: Yeon Seok Seo, Sang Gyune Kim
Acquisition and interpretation of data: Han Ah Lee, Tae Hyung Kim, Young Kul Jung, Moon Young Kim, Ji Hoon Kim
Drafting of the manuscript: Dae Hoe Gu, Moon Young Kim, Yeon Seok Seo
Critical revision of the manuscript for important intellectual content: Soon Ho Um, Altay Kandemir, Hyung Joon Yim, Jong Eun Yeon, Kwan Soo Byun
Statistical analysis: Hyunggin An, Yeon Seok Seo
Notes
Conflicts of Interest: The authors have no conflicts of interest to disclose.
Abbreviations
ALT
alanine aminotransferase
AST
aspartate aminotransferase
AUROC
area under the receiver operating characteristic curve
BMI
body mass index
CI
confidence interval
Cr
creatinine
CT
computed tomography
INR
international normalized ratio
HR
hazard ratio
MELD
model for end-stage liver disease
OR
odds ratio
PMTH
psoas muscle thickness/height
SMI
skeletal muscle index
SnPMTH
sex-nonspecific psoas muscle thickness/height
SsPMTH
sex-specific psoas muscle thickness/height
References
Article information Continued
Notes
Study Highlights
Sarcopenia is a common complication in patients with liver cirrhosis. Although the smooth muscle index (SMI) is the most widely used technique for the diagnosis of sarcopenia, delineating the surface of muscles is relatively complex, and specific software is need for computation. Previous studies suggested that psoas muscle thickness represents muscle mass and psoas muscle thickness/height (PMTH) is associated with prognosis of patients with liver cirrhosis. In this study, PMTH was a good substitute for SMI and an independent prognostic factor for mortality in cirrhotic patients. In addition, applying different cutoff values based on sex improves its prognostic value.