Regional prevalence of non-alcoholic fatty liver disease in Seoul and Gyeonggi-do, Korea
Article information
Abstract
Background/Aims
The prevalence of nonalcoholic fatty liver disease (NAFLD) in Korea has increased recently. The aim of the present study was to determine the regional differences in the prevalence and characteristics of NAFLD.
Methods
From January 2009 to December 2010, 161,891 Seoul and Gyeonggi-do residents receiving a health examination at our institution were enrolled in this cross-sectional study. After applying exclusion criteria, the data of 141,610 subjects (80,943 males, 60,667 females) were analyzed. The presence of NAFLD was established by ultrasound examination.
Results
The overall prevalence of NAFLD was 27.3% (38.3% in men, 12.6% in women). When standardized according to age, area, and sex, the prevalence of NAFLD was 25.2%. The age and area standardized prevalence of NAFLD was higher for men (34.4%) than for women (12.2%; P<0.001). The overall prevalence of NAFLD was higher in Gyeonggi-do (27.7%) than in Seoul (26.9%; P<0.001). Among the men, the prevalence of NAFLD was higher in Gyeonggi-do (39.2%) than in Seoul (37.4%; P<0.001), while for the women it was higher in Seoul (13.2%) than in Gyeonggi-do (12.0%; P<0.001).
Conclusions
The regional prevalence of NAFLD differed between Seoul and Gyeonggi-do. Further studies are needed to establish the etiology of this difference.
INTRODUCTION
Non-alcoholic fatty liver disease (NAFLD) is a wide spectrum of diseases that range from simple steatosis to non-alcoholic steatohepatitis (NASH) and cirrhosis.1 Prevalence of NAFLD has increased and comprises more than 20% of the general population in the United States and Europe.2
As Korea is also experiencing increased prevalence of Western diseases due to westernized pattern in diet and life style, it is probable that the prevalence of NAFLD among Koreans will increase. However, few large scale studies have been performed in Korea. Data from smaller scale studies that examined the preva lence of NAFLD among Koreans are not representative of the population.3,4 Also, no study has explored geographic differences in NAFLD prevalence in Korea. This study was undertaken to estimate the overall prevalence of NAFLD among Koreans. We included 161,891 adults aged between 18 and 80 years old residing in Seoul and Gyeonggi-do, where about half of the entire population of Korea resides. We also estimated the prevalence of NAFLD by region.
METHODS
Study subjects
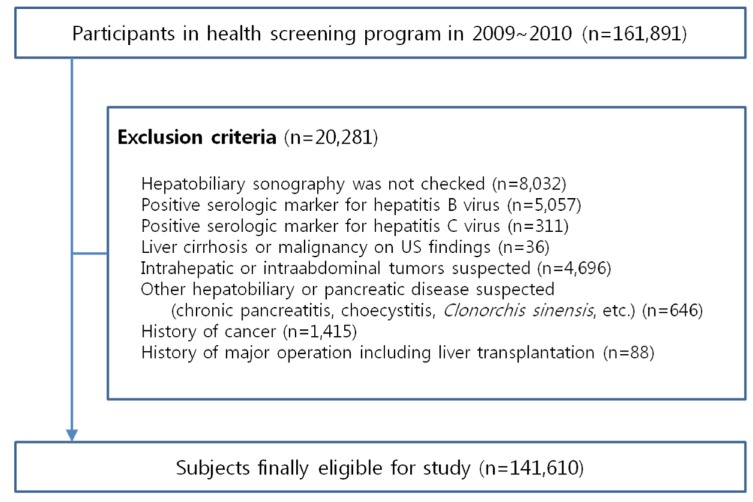
From January 2009 to December 2010, 161,891 Seoul and Gyeonggi-do residents 18-80 years of age who received a routine health examination at the Heath Promotion Center in Kangbuk Samsung Hospital, Korea, were enrolled in this cross-sectional study. Patients with viral hepatitis with positive serologic markers for hepatitis B or C, liver cirrhosis, liver transplantation, malignant tumor, or other hepatobiliary disease including cholecystitis, Clonorchis sinensis, or chronic pancreatitis were excluded. After exclusion, 141,610 subjects (80,943 men, 60,667 women) were analyzed (Fig. 1). Ethics approval for this study was obtained from the institutional review board of Kangbuk Samsung Hospital.
Measurements
Medical history including hypertension, diabetes, dyslipidemia, cardiovascular disease, or cerebrovascular disease and alcohol consumption were assessed using a standard questionnaire. Height and body weight were measured with automated instruments (FA-94H; Fanics, Seoul, Korea) while subjects were barefoot and wearing light clothing. Waist circumference was measured with a flexible tape under fasting conditions, at the level of the umbilicus in a standing position. Body mass index (BMI) was calculated as body weight (kilograms) divided by squared height (meters).
Blood samples were collected from the antecubital vein after fasting overnight. An Advia 1650 automated chemistry analyzer (Bayer Diagnostics, Leverkusen, Germany) was used to measure fasting blood glucose, triglyceride (TG), high-density lipoprotein (HDL) cholesterol, serum aspartate aminotransferase (AST), and alanine aminotransferase (ALT) levels. Hepatitis B surface antigen (HBsAg) and antibody (HBsAb) were measured by chemiluminescent micro-particle immunoassay using an Architect i2000SR apparatus (Abbott Laboratories, Abbott Park, IL, USA). Hepatitis C virus (HCV) antibody was measured by polymerase chain reaction using a COBAS Anplicor HCV assay (Roche, Basel, Switzerland).
The non-significant alcohol consumption was applied to subjects who consumed less than 210 grams on average per week in men and 140 grams on average per week in women according to AASLD (American Association for the Study of Liver Diseases) guideline.5 NAFLD was defined as a fatty liver found on sonography in the absence of viral hepatitis in non-significant alcohol consumption. Sonographic fatty liver was defined according to a diffuse hyperechoic echotexture, hepatorenal echo contrast in reference to the cortex of the right kidney, vascular blurring, and deep echo attenuation, using an ASPEN 3.5 MHz probe (Acuson, Malvern, PA, USA).6 Five sonographers blinded to the clinical status of the subjects performed and interpreted the liver ultrasounds. We did not assess interobserver reliability.
Statistical analyses
All data were analyzed using PASW Statistics 18.0 (IBM, Armonk, NY, USA). In univariate analysis, normal continuous variables were compared with the independent sample t-test. Categorical variables were compared using the Chi-square test. Logistic regression analysis was carried out to analyze relationships between risk factors and NAFLD. To obtain the age, area, and sex standardized prevalence of NAFLD, we used direct standardized method by grouping age (≤ 30, 31-39, 40-49, 50-59, ≥ 60 years) for real population which was registered to Korean Statistical Information Service in 2010. Data are presented by mean and standard deviations for continuous variables; percentage for categorical variables. A P-value <0.05 was considered statistically significant.
RESULTS
Overall prevalence of NAFLD was 27.3% (38.3% in men, 12.6% in women). The prevalence of NAFLD after standardization for age, area, and sex was 25.2%. The age and area standardized prevalence of NAFLD was higher in men (34.4%) than in women (12.2%) (P<0.001). Overall prevalence of obesity (BMI ≥ 25 kg/m2) was 28.9% (39.6% in men, 14.7% in women). The age, area, and sex standardized prevalence of obesity was 28.6%.
Clinical characteristics of the subjects among men and women are given in Table 1. The mean age of the subjects was 41.8±8.4 years for men and 41.3±8.9 years for women. The mean BMI in men and women were 24.5±2.9 and 22.0±3.0 kg/m2, respectively. The proportion of subjects with results that were out of normal range in each variable was higher in men.
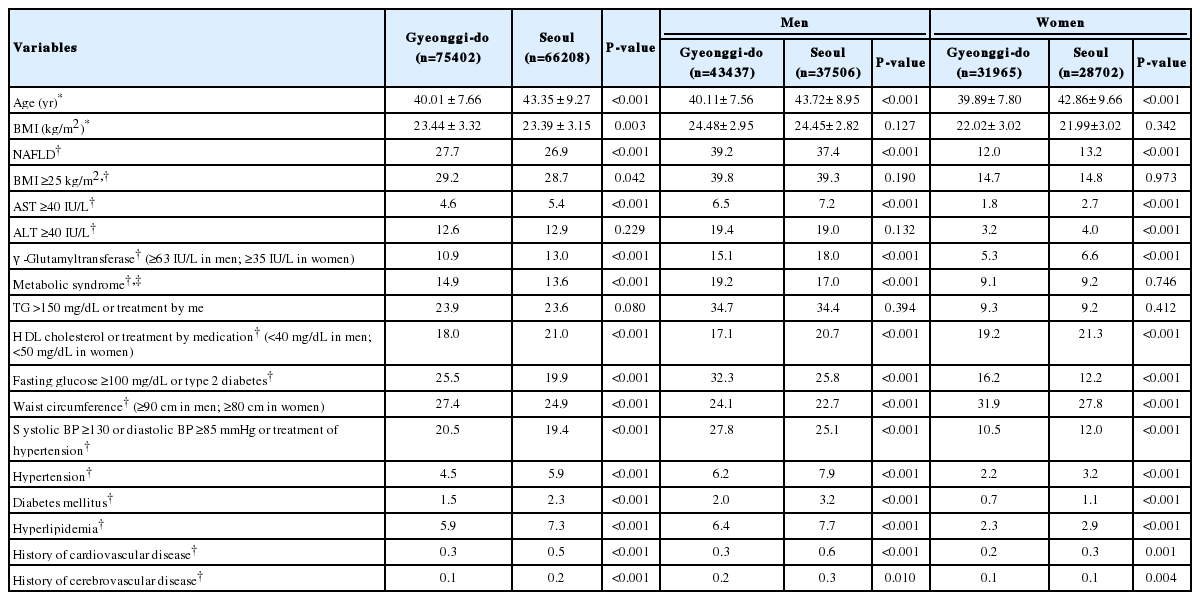
The regional clinical characteristics of the subjects among Gyeonggi-do and Seoul are given in Table 2. The mean age of the subjects was 40.0±7.7 years in Gyeonggi-do and 43.4±9.3 years in Seoul. The mean BMI of residents of Gyeonggi-do and Seoul was 23.4±3.3 and 23.4±3.2 kg/m2, respectively. The proportion of subjects with levels that were out of normal range in fasting glucose, waist circumference, and blood pressure was higher in Gyeonggi-do, whereas Seoul had higher proportion of subject with level that were out of normal range in AST, γ-Glutamyltransferase, and HDL cholesterol. The prevalence of hypertension, diabetes mellitus, hyperlipidemia, history of cardiovascular disease, and cerebrovascular disease in Seoul was higher than Gyeonggi-do.
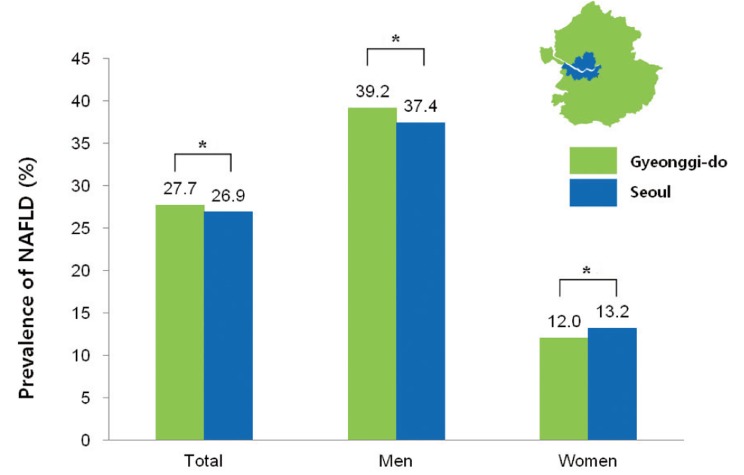
The prevalence of NAFLD was higher in Gyeonggi-do (27.7%) than in Seoul (26.9%) (P <0.001) (Fig. 2). The prevalence of NAFLD for men was higher in Gyeonggi-do (39.2%) than Seoul (37.4%) (P <0.001). But, among women, the prevalence was higher in Seoul (13.2%) than Gyeonggi-do (12.0%) (P<0.001). The prevalence of obesity was higher in Gyeonggi-do (29.2%) than Seoul (28.7%) (P =0.042). But there were no differences between male and female gender (Fig. 3). The prevalence of metabolic syndrome was also higher in Gyeonggi-do (14.9%) than in Seoul (13.6%) (P <0.001). Among men, it was higher in Gyeonggi-do (19.2%) than in Seoul (17.0%) (P <0.001). But there was no significant difference among women (Fig. 4).

Regional prevalence of metabolic syndrome. IDF (International Diabetes Federation) definition was used for metabolic syndrome. *P<0.001.
Table 3 shows results of logistic regression analysis. The age adjusted odds ratio (OR) of obesity was 7.41 (95% confidence interval [CI], 7.22-7.61; P <0.001). That of metabolic syndrome was 6.53 (95%CI, 6.32-6.74; P <0.001). The multivariate adjusted OR including age and metabolic components (raised TG, reduced HDL cholesterol, raised fasting plasma glucose, waist circumference, and raised blood pressure) was highest in raised TG (OR, 3.74; 95%CI, 3.64-3.85; P <0.001). And second highest OR was waist circumference (OR, 2.99; 95%CI, 2.91-3.07; P <0.001). The multivariate adjusted OR including age, metabolic components, and obesity was highest in obesity (OR, 5.10; 95% CI, 4.96-5.25; P <0.001). And second highest OR was in raised TG (OR, 2.99; 95%CI, 2.90-3.08; P <0.001). We used IDF (International Diabetes Federation) definition for metabolic syndrome.
The age standardized prevalence of NAFLD showed an increasing tendency with age until more than 60 years (Fig. 5). When analyzed separately between men and women, the prevalence of NAFLD in men peaked at 41-50 years and then decreased. The prevalence of NAFLD in women showed increasing tendencies with age, with an especially sharp increase in the prevalence of NAFLD for subjects 51-60 years of age.
DISCUSSION
In this study, we tried to estimate the overall prevalence of NAFLD in Korea. For this, we calculated the prevalence of NAFLD among 141,610 adult subjects who resided in the Seoul and Gyeonggi-do area, where about half of total Korean population resides, and also analyzed the regional difference and age standardized distribution of NAFLD.
In previous studies, the prevalence of NAFLD in Korea has been reported in various results depending on the study populations and methods. Those were 17.9% in 1997,7 23.4% in 2001,4 28.1% in 2008,8 and 27.4% in 2009,9 substantially increased. Prevalence of NAFLD in 589 potential living liver donors in Korea by liver biopsies was 51.4% in 2005.10 These studies included specific study population, so were not representative of the whole Korean population.
In contrast, the present study included large number of popula tion and various regions. And we did estimate age, area, and sex standardized prevalence of NAFLD with a direct standardization method using an actual resident population registered in 2010. Therefore, we infer that the results are close to the true prevalence of NAFLD in the general population of Seoul and Gyeonggi-do.
To analyze the regional difference in the prevalence, we compared Gyeonggi-do which is an urban and rural area, and Seoul which is the capital city of Korea. Regional prevalence of NAFLD differed in Gyeonggi-do and Seoul, with the prevalence of NAFLD higher in Gyeonggi-do. Among men, the prevalence of Gyeonggi-do was higher than Seoul, but among women, it was lower than Seoul. Both prevalence of obesity and metabolic syndrome in Gyeonggi-do were higher than Seoul. It is well known that obesity and metabolic syndrome are associated with NAFLD.5,11,12 Thus higher prevalence of NAFLD in Gyeonggi-do is associated with higher prevalence of obesity and metabolic syndrome. As adjusted OR of obesity was higher than that of metabolic syndrome in development of NAFLD, obesity would have more affected to the prevalence of NAFLD than metabolic syndrome. Among the metabolic components, raised TG the most would influence, then waist circumference would influence prevalence of NAFLD.
Advanced age has been associated with increasing prevalence of NAFLD.13 In this study, the age and area standardized prevalence of NAFLD increased with age among women. But among men, it showed a peak between 41 to 50 years and decreased thereafter. This tendency is similar to the results of a study about 3,175 people in Shanghai.14 This trend in women was reported as an estrogen hormone effect.8 However, in men, data about on its age distribution and trend is lacking. So, further studies are needed to understand the reason for our observation of a peak in the prevalence of NAFLD among men in their 40s.
Our study had several limitations. The major limitation is that subjects were voluntary health-check examinees rather than general population. Another limitation is that fatty liver was detected by sonographic findings without assessing interobserver reliability, even though all of the radiologists were very experienced. Alcohol intake was assessed by self-reported questionnaires, which may have the possibility of underestimating the amounts of alcohol intake.
The strengths of this study are the inclusion of a large population of 141,610 subjects, which enabled the detection of regional difference in the prevalence of NAFLD. Also, for direct standardization for age, area, and sex, we used distribution of actual residing population, so the estimations for the prevalence of NAFLD in this study must be very close to a true value.
In conclusion, there were differences of regional prevalence of NAFLD and obesity in Seoul and Gyeonggi-do in Korea. Further studies will be needed to learn the cause of the differences.
Acknowledgements
This study was supported by the Ministry Food & Drug Safety (12162-KFDA-159).
Notes
The authors have no conflicts to disclose


