


INTRODUCTION
Patients with cirrhosis often complain of sleep difficulties even without overt encephalopathy [1,2]. Management of sleep difficulties in these patients is problematic. Pharmacological therapies must achieve a balance between hypnotic and adverse effects. Zolpidem is a high-affinity positive modulator of Žē1 GABAA receptors [3]. The mean half-life of zolpidem in cirrhotic patients of 9.9 hr (range: 4.1 to 25.8 hr) was greater than that observed in normal subjects of 2.2 hr (range: 1.6 to 2.4 hr) [4].
The recommended dose for immediate release formulation of zolpidem is 10 mg in adult males, 5 mg in adult women, and 5 mg in elderly and patients with hepatic impairment [4]. In 2011, a sublingual, lower-dose tablet was approved, with doses that differed for men and women (3.5 mg for men and 1.75 mg for women [5].
There are no published randomized controlled studies on efficacy and safety of zolpidem in patients with cirrhosis. The aim of this study was to study the efficacy and safety of zolpidem for sleep disturbances in patients with cirrhosis.
MATERIALS AND METHODS
Trial design
This was a single center, double-blind, randomized placebo-controlled trial (ClinicalTrials.gov identifier number: NCT02484963).
Participants
The study was conducted in the Department of Hepatology and Liver Transplantation, Institute of Liver and Biliary Sciences (ILBS), New Delhi from 30/6/2015 to 20/12/2016. The study was approved by the ILBS Institutional Review Board (Number: F. 25/5/75/ILBS/AC/2014/392). Informed consent was taken from the participants and the work was done in accordance with the declaration of Helsinki.
Patients who fulfilled the following inclusion criteria were eligible to participate in the study: age 18 to 70 years, Child-Turcotte-Pugh (CTP) class A and B cirrhosis (CTP score up to 9) of any etiology, and history of persistent sleep disturbance with Pittsburgh Sleep Quality Index (PSQI) >5.
Exclusion criteria were the following: active alcohol intake or intake within 1 month of enrollment, active substance abuse or intake within 1 month of enrollment, known psychiatric and neurological disorders, patients using antidepressant, anticonvulsants, other hypnotics, pregnancy or lactation, hepatocellular carcinoma, prior history of overt hepatic encephalopathy or currently in overt encephalopathy, patients at high risk of obstructive sleep apnea (OSA), CTP class C cirrhosis, acute decompensated state of cirrhosis like gastrointestinal bleed/increased jaundice, active infection, post transjugular intrahepatic portosystemic shunt patients, acute febrile illness and no consent.
Interventions
After fulfilling all inclusion and exclusion criteria patients were randomized to either zolpidem (5 mg per oral 30 minutes before sleeping at night daily) or placebo (peroral at bed time daily) for 4 weeks. The same dose of 5 mg of zolpidem was used for both males and females.
All patients were advised regarding good sleep hygiene.
Both the group of patients underwent the following investigations at baseline: hemogram, renal and liver function tests, serum electrolytes, etiological workup for cirrhosis as needed, abdominal ultrasound with Doppler splenoportal axis and hepatic veins, blood sugar fasting, chest X-ray, arterial ammonia level, critical flicker frequency (CFF), PSQI, Epworth Sleepiness Scale (ESS), and polysomnography (PSG).
Patients were followed up weekly up to fourth week of therapy. During each follow up visit following were assessed: compliance, any adverse drug effect, renal and liver function tests, arterial ammonia levels. At the fourth week, in addition, PSQI score assessment, ESS, CFF and PSG were repeated.
The patients and their relatives were instructed to contact the investigators immediately in the event of any alteration in the patientŌĆÖs mental state, excessive sleepiness or drowsiness. Patients were strictly advised not to drive during the study period.
Outcomes
The primary outcome measure was improvement in total sleep time (TST) as measured by PSG at end of 4 weeks. The secondary outcome measures studied at end of 4 weeks were: change in other polysomnographic parameters, improvement in PSQI score, precipitation of hepatic encephalopathy, or development of any other side effects.
Randomization and allocation concealment
Random allocation sequence was done by computer-generated random number codes with an equal number of the alternative treatment. Patients were randomized to either of the two groups in 1:1 ratio. Sealed opaque thick papered envelopes were used to conceal the sequence until interventions were assigned.
Blinding
Treatment and placebo pills were of similar size, shape and color. The participants, care providers, and those assessing outcomes were blinded. The code was not broken until the end of the study.
Medication preparation
The Institute Pharmacy procured and prepared the study medication in size #1 opaque capsules. Zolpidem capsules contained 5 mg of zolpidem and placebo capsules (identical in appearance to zolpidem capsules) contained starch.
Compliance
Pills were supplied to the patients for 1 week (7 pills) at one time, and patients and attendants were instructed to taken only one pill per day. Compliance was checked every week by interview and pill count technique. The same dose was continued throughout the trial period (no dose titration was done), with the plan to discontinue the patient in case major adverse events occur (excessive sedation, neuropsychiatric side effects or encephalopathy).
Study assessments
PSQI and ESS
PSG
All patients were subjected to complete overnight PSG in the sleep unit of the Department of Pulmonology, Institute of Liver and Biliary Sciences, New Delhi, India, using the sleep laboratory digital system EMBLA S7000® (Embla Systems Inc., Broomfield, CO, USA). After an initial adaptation night, PSG was performed on the second night.
The subjects were instructed to go to sleep at their usual bedtime. All PSG sessions were monitored by trained technicians and visually scored according to standardized criteria [16].
The following PSG sleep parameters were recorded; (1) total recording time (TRT), (2) TST, (3) wake time, (4) sleep efficiency (the TST/TRT ratio, expressed as percentage), (5) sleep latency: the length of time to sleep onset, (6) latency to rapid eye movement (REM) sleep, (7) percentage of time patients spent in sleep stages 1, 2, 3 + 4 or REM sleep stage, (8) apnea-hypopnea index (AHI): mean number of apneas or hypopneas in a 1-h period, (9) periodic limbs movements of sleep per hour (PLMS/h), (10) arousals/h, (11) mean SpO2: the mean oxy-hemoglobin saturation, and (12) nadir SpO2: minimal oxy-hemoglobin saturation recorded during PSG.
An abnormal AHI (AHI of more than five events per hour of sleep) accompanied by excessive daytime sleepiness were diagnosed as OSA [17].
PSG was conducted by the neurology team. These parameters were analyzed and scored by blinded specialists (Kumar S, Agarwal HK, and Dhamija RM) and the scores were separately tabulated by all three (with intra-class correlation coefficient of more than 0.9 for all variables) and finally the mean of the three was taken as final value of each variable in the PSG report.
Statistical methods
Data was processed using the software packages SPSS version 20.0 (IBM Corp., Armonk, NY, USA). For comparison of categorical variables, chi-square and FisherŌĆÖs exact tests were used. For comparision of continuous variables, t-test for normally distributed continous variables and Mann-Whitney U test for continous variables not normally distributed were used. Wilcoxon rank sum test for paired continuous data, and McNemar test for paired categorical variables were used.
Sample size
Zolpidem has been shown to be effective from the very first day (in non-cirrhotic subjects), in trials of zolpidem use in transient insomnia including trials using the first night effect as a model of transient insomnia [18], therefore use of PSQI questionnaire (which covers the 4 weeks prior to assessment) as an assessment tool of this 4-week drug trial is justified. The primary outcome measure was improvement in TST as measured by PSG at end of 4 weeks. As there was no prior data on Indian cirrhotic patients, we initially did PSG on 10 patients with cirrhosis with CTP A and B (without the exclusion criteria for the study as above) and mean TST of 248.3┬▒64.4 min. Assuming baseline TST to be 240┬▒60 min in each group and that zolpidem and placebo will increase TST by 120 min (to 360┬▒60 min) and 60 min (to 300┬▒60 min) respectively; with alpha 5% and power 90% we needed to enroll 22 cases in each arm of the study. Assuming defaulter rate to be 10% it was decided to enroll total 50 cases (25 cases in each group). No interim analysis was planned.
RESULTS
Participant flow and numbers analyzed
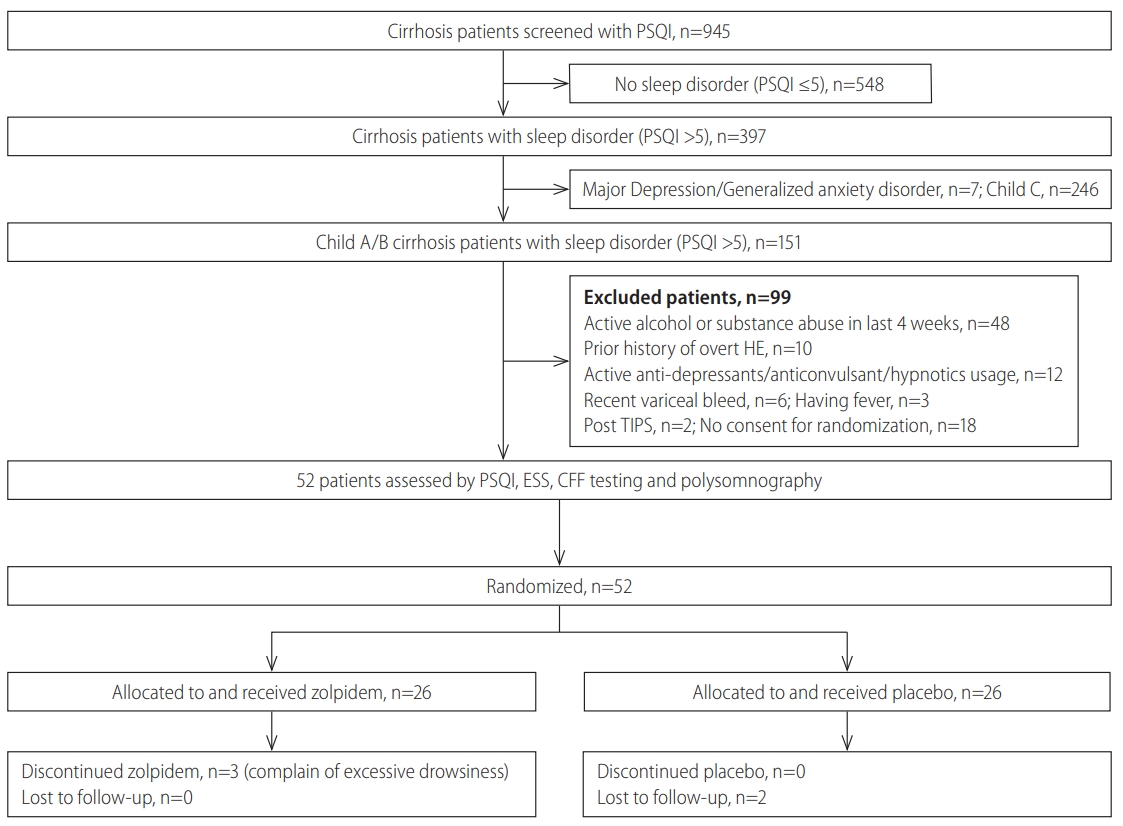
945 patients with cirrhosis, without overt encephalopathy were screened for the presence of sleep disturbances, by administering PSQI and ESS (Fig. 1).
Finally, 52 patients who fulfilled the inclusion and exclusion criteria were randomized to the zolpidem arm (n=26) and placebo arms (n=26). Standard medical care was continued in both the arms, which included beta-blockers and diuretics. As patients with prior history of overt hepatic encephalopathy were excluded, none of the patients were on lactulose, rifaximin or L-ornithine-L-aspartate. None of the patients were treated with antibiotics during the study period.
Baseline data
The therapy of 4 weeks was completed by 23 patients in zolpidem group (3 patients stopped treatment before completion of 4 weeks due to development of excessive daytime drowsiness) and 24 patients in placebo group (2 patients refused to continue in the study).
Changes in PSG findings after 4 weeks of therapy
Overall assessments of zolpidem efficacy
In the zolpidem group, after 4 weeks of therapy, as compared to baseline, there was significant increase in TST (from median [range] of 245.5 [120.3ŌĆō370.5] min to 370.3 [180.0ŌĆō435.5] min, PŌēż0.001 in zolpidem vs. 251.8 (123.3ŌĆō365.5) min to 200.4 (70.5ŌĆō438.5) min, P=0.440 in placebo]; and increase in sleep efficiency (from median [range] of 68.4 [19.8ŌĆō87.9]% to 78.9 [60.0ŌĆō92.2]%, PŌēż0.001 in zolpidem vs. 69.8 [19.9ŌĆō90.7]% to 68.9 [10.8ŌĆō227.8]%, P=1.000 in placebo).
Sleep initiation and maintenance
In the zolpidem group, after 4 weeks of therapy, as compared to baseline, there was significant decrease in sleep latency time, decrease in number of arousals per hour of sleep; decrease in wake time; and decrease in number of periodic limbs movements of sleep per hour (Table 3).
Sleep architecture and indices of apnea-hypopnea
After 4 weeks of therapy, as compared to baseline, there was no significant change in sleep architecture or indices of apnea-hypopnea (Table 3).
Changes in PSQI and ESS after 4 weeks of therapy
After 4 weeks of therapy, as compared to baseline, there was significant improvement in PSQI score in zolpidem group but not in placebo group (Table 3).
Changes in CFF threshold and arterial ammonia after 4 weeks of therapy
In the zolpidem group, after 4 weeks of therapy, as compared to baseline, there was significant decline in CFF threshold (from median [range] of 39.2 [33.6ŌĆō42.6] Hz to 38.4 [33.4ŌĆō40.6] Hz, P=0.031 in zolpidem vs. 39.7 [32.8ŌĆō43.0] Hz to 38.8 [31.4ŌĆō42.6] Hz, P=0.394 in placebo), however, there was no significant change in number of patients with CFF <39 Hz in either of the groups (Table 3). There was no significant change in arterial ammonia levels in either group after 4 weeks of therapy (Table 3).
Side effects of therapy
Three of 26 (11.5%) patients in zolpidem group had excessive day time drowsiness (that improved within 24 hours of stoppage of therapy), as compared to none in the placebo group (Table 4). The clinical profile of the 3 patients who developed excessive day time drowsiness is shown in Table 5.
Other side effects are shown in Table 4. None of the patients developed overt hepatic encephalopathy, hallucinations or other neuropsychiatric manifestation or complex behaviors during study period. Constipation was seen more frequently in zolpidem-treated patients (23.1%) as compared to placebo-treated patients (3.8%, P=0.054), which was managed by increased fiber intake in food in all and in none of them lactulose or lactitol was used.
DISCUSSION
This is the first double-blind, placebo-controlled randomized PSG trial assessing safety and efficacy of zolpidem in patients with cirrhosis and insomnia. In the zolpidem group, after 4 weeks of therapy, as compared to baseline, there was significant increase in TST (from median [range] of 245.5 [120.3ŌĆō370.5] min to 370.3 [180.0-435.5] min, PŌēż0.001 in zolpidem vs. 251.8 [123.3ŌĆō365.5] min to 200.4 [70.5ŌĆō438.5] min, P=0.440 in placebo); and increase in sleep efficiency (from median [range] of 68.4 [19.8ŌĆō87.9]% to 78.9 [60.0ŌĆō92.2]%, PŌēż0.001 in zolpidem vs. 69.8 [19.9ŌĆō90.7]% to 68.9 [10.8ŌĆō227.8]%, P=1.000 in placebo). There was also improvement in polysomnographic parameters of sleep initiation and maintenance (i.e., decrease in sleep latency time decrease in number of arousals per hour of sleep, decrease in wake time, and decrease in number of periodic limbs movements of sleep per hour). Overall, these findings suggest that zolpidem leads to improvement in overall sleep quality (improvememt in TST and sleep efficiency), decrease in time to initiation of sleep and is better able to maintain the sleep through the night. However the sleep architecture did not change. Also, after 4 weeks of therapy, as compared to baseline, there was significant improvement in subjective assessment of sleep quality by the patients as assessed by the PSQI score in zolpidem group. These findings are similar to other studies of zolpidem in non-cirrhotic patients [19,20].
Till date, only a few studies have been done using different drugs for sleep disturbances in patients with cirrhosis. In a study including 35 patients with cirrhosis and MHE and long-standing sleep difficulties, patients were randomized to histamine H1 blocker, hydroxyzine 25 mg at bedtime (n=17) or placebo (n=18) for a 10-day period. Objectively, 65% of hydroxyzine-treated patients vs. 25% of patients under placebo had a Ōēź30% increase in sleep efficiency as measured by wrist actigraphy (P=0.041). One patient developed an acute episode of encephalopathy which was reversible upon cessation of hydroxyzine [21].
In one study which assessed the effect of rifaximin for 28 days on sleep architecture parameters in 15 cirrhotic patients with recurrent hepatic encephalopathy (HE), it was found that on 24-h PSG, rifaximin improved HE scores, improved objective sleep architecture parameters, with no changes in the subjective quality of sleep and sleepiness [22].
In our study, 50% of those in the zolpidem group and 38.5% in the placebo group had minimal HE (based on CFF <39). Although there was significant decline in CFF threshold in zolpidem group at week 4 as compared to baseline; there was no significant change in number of patients with CFF <39 Hz in either zolpidem or placebo groups; and none of the patients treated with zolpidem developed overt HE. One report reviewing development of HE during zolpidem use [23] reported that since the approval of zolpidem in 1992 through September 2015, the Food and Drug Administration identified six spontaneous cases of HE associated with zolpidem in patients with hepatic insufficiency. Our study is not powered to detect development of significant side effects like overt HE development.
One intriguing finding in this study was that zolpidem reduced the number of periodic limb movements of sleep per hour. In fact there are some reports of development of periodic limb movement during zolpidem treatment especially in elderly females [24]. On the other hand, zolpidem has been found to be effective in a variety of movement disorders [25].
Constipation was seen more frequently in zolpidem-treated patients (23.1%) as compared to placebo-treated patients (3.8%, P=0.054). This finding is intriguing as previous studies in non-cirrhotics have found constipation in around 2% of zolpidem-treated patients [4].
The three patients who stopped zolpidem treatment due to severe daytime sleepiness were either female or old or (in case of patient 1) showed in addition definite signs of liver insufficiency. Perhaps female and older patients with cirrhosis may be started with a lower 2.5 mg dose instead of 5 mg/day dose.
However, the present study has a few limitations. The zolpidem groups were not significantly different from each other in study attrition, but the reasons for discontinuations were different. The placebo group had more voluntary discontinuations (n=2) than the zolpidem group (n=0). These discontinuations may reflect the participantŌĆÖs ability to discern that the study medication had little beneficial effect on their sleep and were more likely to stop taking study medication and discontinue the study. In the zolpidem group, all the discontinuations were due to excessive daytime sleepiness (n=3).
Only CTP class A and B cirrhosis (CTP score upto 9) were included. The safety in CTP class C cirrhosis remains unknown.
Zopidem is a drug with many concerns related to adverse effects. Especially in patients with hepatic impairment, gamma-aminobutyric acid agonists, such as zopidem, are well known as important precipitating factors for hepatic encephalopathy. The study has a relatively small number of patients to assess this safety. Also, a 4-week trial is insufficient to determine the safety of zolpidem in cirrhosis patients. A longer period and larger trial would be needed to uncover significant safety concerns. Another limitation of this study was that we did not use wrist actigraphy, which is less precise that PSG but has the the advantage of monitoring subjects while they perform their customary social activities, avoiding the constraints of the sleep laboratory. Also, this study did not study the improvement in daytime functioning and quality of life after therapy.
Four weeks of 5 mg daily zolpidem in CTP class A and B cirrhosis with insomnia leads to a significant increase in TST and sleep efficiency; improvement in polysomnographic parameters of sleep initiation and maintenance (i.e., decrease in sleep latency time decrease in number of arousals per hour of sleep, decrease in wake time, and decrease in number of periodic limb movements of sleep per hour), without any significant change in sleep architecture.
 PDF Links
 PubReader
 ePub Link
 Full text via DOI
 Full text via PMC
 Download Citation
 Print
Print