Taurocholic acid promotes hepatic stellate cell activation via S1PR2/p38 MAPK/YAP signaling under cholestatic conditions
Article information

Abstract
Background/Aims
Disrupted bile acid regulation and accumulation in the liver can contribute to progressive liver damage and fibrosis. However, the effects of bile acids on the activation of hepatic stellate cells (HSCs) remain unclear. This study investigated the effects of bile acids on HSC activation during liver fibrosis, and examined the underlying mechanisms.
Methods
The immortalized HSCs, LX-2 and JS-1cells were used for the in vitro study. in vitro, the adeno-associated viruses adeno-associated virus-sh-S1PR2 and JTE-013 were used to pharmacologically inhibit the activity of S1PR2 in a murine model of fibrosis induced by a 3,5-diethoxycarbonyl-1,4-dihydrocollidine (DDC) diet. Histological and biochemical analyses were performed to study the involvement of S1PR2 in the regulation of fibrogenic factors as well as the activation properties of HSCs.
Results
S1PR2 was the predominant S1PR expressed in HSCs and was upregulated during taurocholic acid (TCA) stimulation and in cholestatic liver fibrosis mice. TCA-induced HSC proliferation, migration and contraction and extracellular matrix protein secretion were inhibited by JTE-013 and a specific shRNA targeting S1PR2 in LX-2 and JS-1 cells. Meanwhile, treatment with JTE-013 or S1PR2 deficiency significantly attenuated liver histopathological injury, collagen accumulation, and the expression of fibrogenesis-associated genes in mice fed a DDC diet. Furthermore, TCA-mediated activation of HSCs through S1PR2 was closely related to the yes-associated protein (YAP) signaling pathway via p38 mitogen-activated protein kinase (p38 MAPK).
Conclusions
TCA-induced activation of the S1PR2/p38 MAPK/YAP signaling pathways plays a vital role in regulating HSC activation, which might be therapeutically relevant for targeting cholestatic liver fibrosis.
Graphical Abstract
INTRODUCTION
Cholestasis is mainly characterized by disturbances in bile salt synthesis, secretion and excretion, which lead to intrahepatic accumulation of bile salts and progressive liver damage or fibrosis [1]. Cholestasis is a prominent manifestation of endstage liver cirrhosis [2]. The extension of fibrotic lesions to other bile ducts and the hepatic sinusoidal system around the portal area can hinder the secretion and excretion of bile and cause local hepatic tissue microcirculation disorders, further exacerbating cholestasis in a vicious cycle [3]. Although tremendous efforts have been invested in the clinical management of these diseases and some promising agents are in development, the underlying pathogenesis and biomarkers of disease progression remain poorly understood [4].
Growing evidence indicates elevated bile acid levels in cholestasis are an independent profibrogenic factor [5-7]. High bile acid concentrations in cholestatic liver disease cause liver parenchymal injury by inducing apoptosis and necrosis in hepatocytes. Unlike hepatocytes, hepatic stellate cells (HSCs), which are the major cellular source of matrix protein-secreting myofibroblasts, show increased proliferation in response to elevated bile acid concentrations and are resistant to bile acid-mediated cell death [8]. However, few studies have explored the potential direct activation of HSCs by bile acids, and the molecular pathways mediating bile acid-induced effects in HSCs remain elusive. Svegliati-Baroni et al. [8] found that bile acids promoted cell proliferation through epidermal growth factor receptor (EGFR) in HSCs [8], but the authors did not investigate the effects of bile acids on the myofibroblast-like functions of HSCs, such as cell migration, contraction and extracellular matrix protein secretion. How bile acid signals regulate the key events involved in HSC activation and liver fibrosis under cholestatic conditions is not well understood.
As important signaling molecules, bile acids usually regulate hepatic metabolism by activating nuclear receptors (farnesoid X receptor [FXR], liver X receptor [LXR]) or cell membrane receptors (GPBAR1 [TGR5], sphingosine 1-phosphate receptor 2 [S1PR2]) [9]. Given that HSCs lack bile acid transporters and thus cannot take up bile acids [10], they can only be taken up into the cell through the cell membrane receptors involved in HSC activation under cholestatic conditions. Recent studies have identified S1PR2 as a bile acid-activated receptor that plays a unique role in liver pathophysiology [11-13]. S1PR2 activation is a critical component of cholangiocyte proliferation under cholestatic conditions [13]. In the serum of murine obstructive cholestasis models and liver cirrhosis patients, taurocholic acid (TCA) is one of the most abundant bile acids [7,14]. Previous studies using homology modeling identified TCA as an agonist predicted to hydrogen bond to Leu173 of S1PR2 [15]. However, whether bile acids such as TCA and S1PR2 are correlated in HSC transdifferentiation and activation remains unclear.
In the current study, we examined the effect of bile acids, especially TCA, on the activation of HSCs and the progression of fibrosis under cholestatic conditions. Our findings suggest that TCA/S1PR2-mediated signaling pathways play key roles in HSC activation and cholestatic liver fibrosis. We also described the principles of HSC activation under cholestatic conditions and identified prospects for novel diagnostics and therapies among patients with cholestatic liver fibrosis.
MATERIALS AND METHODS
Reagents and antibodies
Taurocholate acids and diethyl 1,4-dihydro-2,4,6-trimethyl-3,5-pyridinedicarboxylate (DDC) were purchased from Sigma‒ Aldrich (St. Louis, MO, USA). Recombinant human TGF-β, Y27632, U0126 and SB203580 were obtained from MCE Med-ChemExpress (Monmouth Junction, NJ, USA). JTE-013 and CAY1044 were purchased from Cayman Chemicals (Ann Arbor, MI, USA). The α-SMA, collagen 1, p-YAP (Ser127), and YAP antibodies were obtained from Cell Signaling Technology (Danfoss, MA, USA). β-actin, S1PR2 and Lamin B1 antibodies were purchased from Santa Cruz Biotechnology (Dallas, TX, USA). HRP-linked anti-mouse and anti-rabbit IgG antibodies were obtained from Beyotime Biotechnology (Nanjing, China).
Cell lines and cell culture
The human HSC line LX-2 and the mouse HSC line JS-1 were obtained from FengHui Biological Co., Ltd. (Hunan, China). HepG2 cells were obtained from the China Cell Bank (Shanghai, China). All cells were maintained in Dulbecco’s modified Eagle’s medium (DMEM) containing 10% FBS and penicillin‒streptomycin at 37°C in a 5% CO2 incubator.
Cell viability assay
LX-2, JS-1 or HepG2 cells were cultured in 96-well plates in serum-free medium overnight and were treated with various concentrations of TCA (0, 12.5, 25, 50, 100, 200, 400, 800 μM) in the presence or absence of specific antagonists of individual S1PRs for 24 h. Cell Counting Kit-8 (Vazyme Biotech, Nanjing, China) assays were used to evaluate cell viability. The OD values at 450 nm were measured using a multilabel plate counter (Perkin Elmer, Waltham, MA, USA).
Wound healing assay
Three parallel lines were drawn on the bottom of each well of a 24-well plate, and then cells were seeded in the 24-well plate and cultured overnight (to more than 80% confluence). A pipette was used to form wounds in each well. The cells were treated with TCA (100 μM) in the presence or absence of specific antagonists of individual S1PRs. During the experiment, typical kinetic updates were recorded at 4 hours intervals, and photographs of the wounds were obtained. Cell migration was determined by measuring the decrease in the width of the corresponding scratch using ImageJ software as described previously [16].
Collagen gel contraction assay
Type I collagen from rat tails (5 mg/mL; Absin Bioscience Inc., Shanghai, China), PBS (10×) reconstitution buffer and the cell suspension were adjusted according to the manufacturer’s protocol. The final cell concentration was 4×10⁵ cells/mL. After gelation, medium containing 100 μM TCA was added to the gel in each well and incubated for 24 hours. The gels were photographed, and the collagen gel area was measured.
Western blot analysis
Total proteins were extracted from liver tissue and cells using RIPA lysis buffer (Beyotime Biotechnology), quantified by the BCA method (Beyotime Biotechnology), and analyzed by Western blot using specific primary and secondary antibodies, and the immunoreactive bands were visualized using an ECL chemiluminescent kit (Absin Bioscience Inc.) and ImageJ software.
Quantitative real-time polymerase chain reaction
Total RNA was extracted from liver tissue and cells by TRIzol reagent, reverse-transcribed using a HiScript II Q RT SuperMix for qPCR kit (Vazyme Biotech) and a ChamQ Universal SYBR qPCR Master Mix kit (Vazyme Biotech). β-actin was used as an internal control. The relative expression level of each target gene was calculated by the 2-ΔΔCT method. The primer sequences used are presented in Supplementary Table 1.
Cellular YAP translocation assay
The cells were plated on coverslips, cultured overnight and treated with TCA (100 μM) in the presence or absence of JTE-013 (10 μM) for 4 hours. Then, the cells were fixed with 4% paraformaldehyde, permeabilized with 0.2% Triton X-100, blocked with 5% BSA for 1 hour, and incubated with YAP antibodies (1:200 dilution) overnight at 4°C. After the coverslips were washed, Alexa Fluor 488 secondary antibodies were added and incubated for 1 hour at 37°C. Finally, the coverslips were sealed with an anti-fluorescence quencher containing DAPI, and the cells were observed and photographed with a Carl Zeiss LSM880 microscope.
RNA interference
The cells were cultured overnight to 50% confluence and transfected with a shRNA lentivirus vector targeting the S1PR2 or YAP gene. The primer sequences used are presented in Supplementary Table 2. After 48 hours, the cells were used for further experiments.
Animals and experimental design
All animal experiments were approved by the Animal Research Committee of Jiangnan University (JN.No20190 930i0501210[252]) and were performed in accordance with the principles of care and the use of laboratory animals. ICR mice (male, 8 weeks) were purchased from Cavens Laboratory Animal Co. Ltd. (Changzhou, China). For the JTE-013 interference model, the mice were fed a control diet or a DDCsupplemented diet (0.1%) for 4 weeks to induce advanced biliary fibrosis. Then, 10 mg/kg B.W. JTE-013 was administered intraperitoneally one day before DDC diet administration and three times per week for 4 weeks (n=7 per group). For the S1PR2 knockdown mouse model, the mice were injected via the tail vein with adeno-associated virus (AAV8) carrying the S1PR2-targeting shRNA or scramble control shRNA (SHX211125A2; KeyGEN Biotech Company, Nanjing, China). After one week, cholestatic liver fibrosis was induced by DDC in accordance with our study.
Determination of hepatic enzyme levels
ALT levels, AST activity and total bile acids (TBA) in serum were analyzed using ALT, AST and TBA kits (Nanjing Jiancheng Bioengineering Institute, Nanjing, China), respectively.
Determination of hepatic hydroxyproline levels
Hepatic hydroxyproline levels were quantified using a kit (Nanjing Jiancheng Bioengineering Institute) according to the manufacturer’s protocol.
Liver histopathology
Liver tissues were fixed in 4% paraformaldehyde and sectioned at a thickness of 5 μm. The sections were stained with H&E to evaluate the degree of liver injury using light microscopy. For Masson’s trichrome staining, the sections were stained with a Masson’s trichrome stain kit (Absin Bioscience Inc.) according to the kit directions.
Statistical analysis
Statistical analysis was carried out using GraphPad Prism 8 software, and all data are expressed as the mean±SEM. Comparisons among multiple groups were conducted using oneway analysis of variance followed by Bonferroni’s multiple comparison test. A P-value less than 0.05 was considered statistically significant.
RESULTS
Taurocholate acid promotes HSC activation in vitro
To further investigate the role of TCA in HSC transdifferentiation and activation, we selected two hepatic stellate cell lines: LX-2 and JS-1. As shown in Figure 1A, TCA dose-dependently stimulated HSC proliferation, as shown by CCK-8 assays. HSC proliferation became evident at low concentrations of TCA (12.5–200 μM) in LX-2 cells compared with that in the control and at high concentrations of TCA (>200 μM) in JS-1 cells (Fig. 1A). In contrast, TCA at the same concentration (>200 μM) both increased the number of HepG2 cells and induced considerable cell death (Fig. 1A). These results indicated that high bile acid concentrations under cholestatic conditions stimulated HSC proliferation and induced apoptosis in hepatocytes.
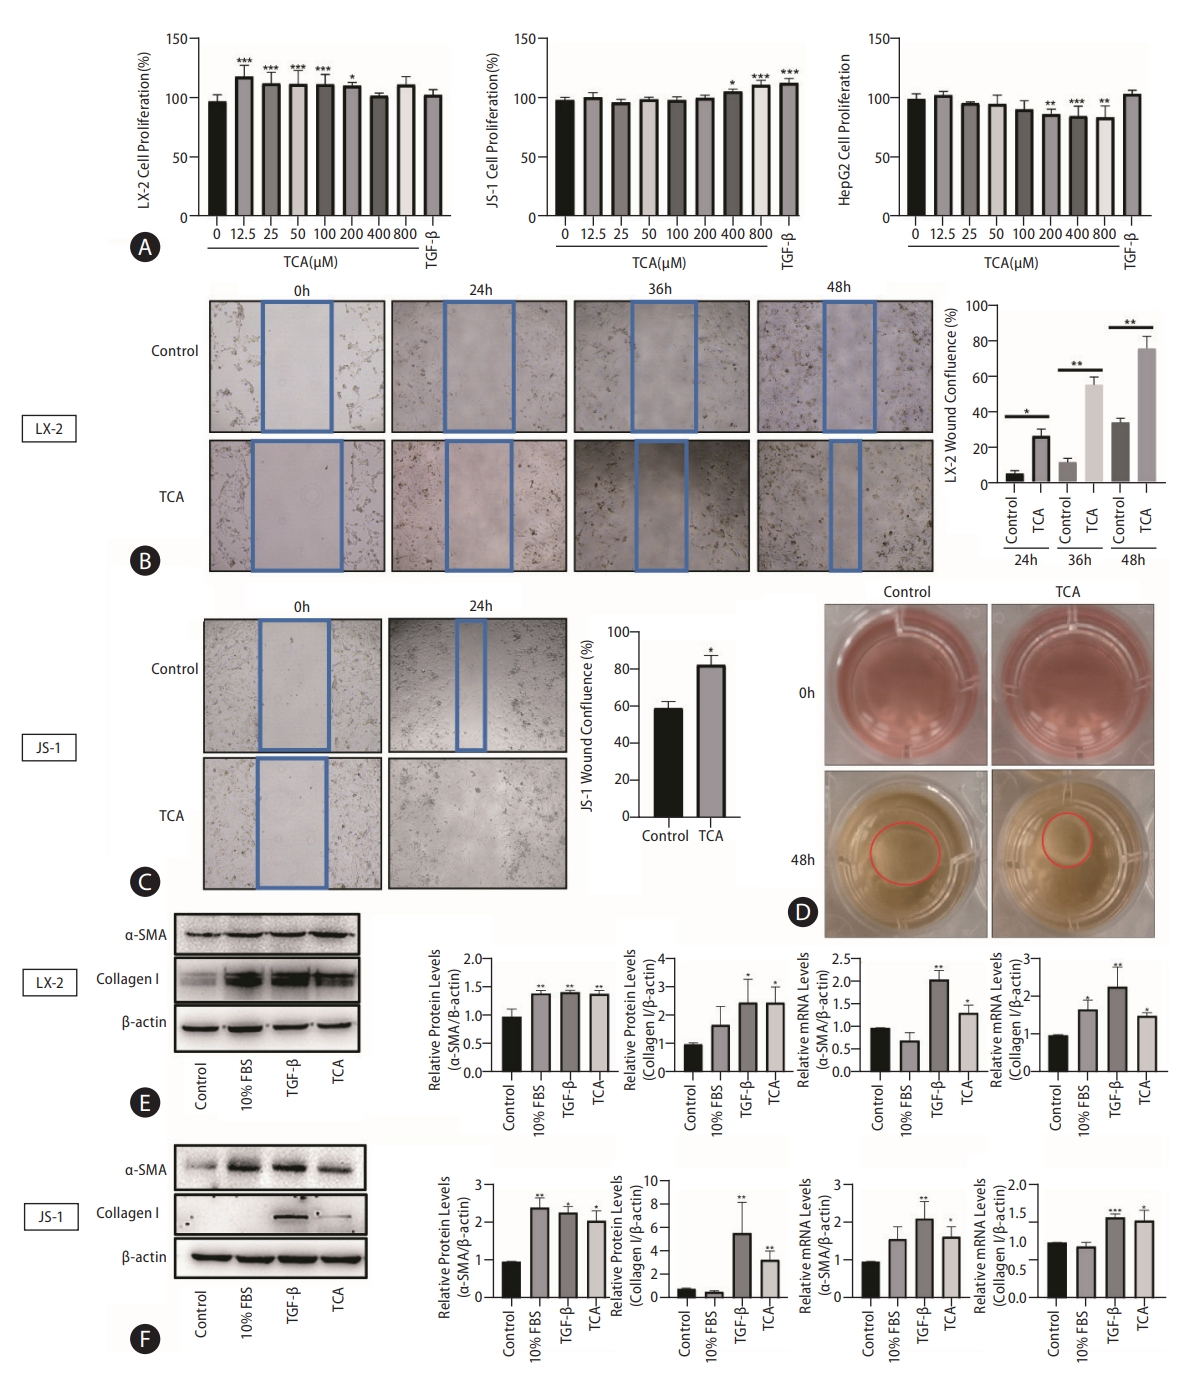
TCA stimulates HSC activation. Cell viability was examined in response to different concentrations of TCA in LX-2, JS-1 or HepG2 cells (A). Cell motility was examined in response to TCA (100 μM) in LX-2 (B) and JS-1 (C) cells. Cell contractility was examined in response to TCA (100 μM) in LX-2 (D) cells. Protein and mRNA levels of α-SMA and collagen 1 in LX-2 (E) and JS-1 (F) cells after TCA treatment (100 μM). The data shown are the mean±SEM. TCA, taurocholic acid; HSCs, hepatic stellate cells; α-SMA, α-smooth muscle actin. *P<0.05, **P<0.01, ***P<0.005 compared with the control group; n=4.
Next, we sought to determine whether TCA plays a role in HSC motility and contractility, which are two common features of myofibroblasts, by using wound healing assays and collagen gel contraction assays, respectively. As expected, TCA (100 μM) administration greatly increased the number of migrated LX-2 cells, especially after 36 hours (Fig. 1B). Similar to the findings in JS-1 cells, TCA markedly promoted cell migration at 24 hours compared to that in the control (Fig. 1C), indicating that TCA increased HSC mobility. Moreover, treatment with TCA clearly reduced the gel surface area compared to that in the control LX-2 cells, confirming that TCA enhanced collagen gel contractility (Fig. 1D).
Given that the fibrogenic functions of activated HSCs are critical initiators of hepatic fibrosis, western blot was used to assess the protein levels of α-smooth muscle actin (α-SMA) and collagen 1 after TCA administration in HSC. We found that TCA increased the protein expression of α-SMA and collagen 1 in LX-2 and JS-1 cells, and expression of these factors was upregulated in the positive control groups grown with serum (10% fetal bovine serum [FBS]) or treated with TGF-β (10 ng/mL) (Fig. 1E, F). Moreover, real-time PCR showed that the mRNA levels of α-SMA and collagen 1 were dramatically increased by TCA in LX-2 and JS-1 cells, respectively (Fig. 1E, F). Taken together, these results indicate that TCA activated quiescent HSCs into proliferative, migratory, contractile, and fibrogenic myofibroblasts.
S1PR2 is the predominant S1PR expressed in HSCs and is upregulated under cholestatic conditions
First, we examined the dynamic expression of bile acid-related receptors and found that the levels of the bile acid importer Sodium taurocholate cotransporting polypeptide (NTCP) and nuclear receptor FXR were extremely low in quiescent and activated HSCs (Supplementary Fig. 1), which inhibited bile acid uptake by HSCs. Therefore, bile acids can promote HSC activation only through cell membrane receptor signaling pathways. TGR5 and S1PR2 are the main G protein-coupled membrane receptors that are responsive to bile acids (Supplementary Fig. 2). TGR5 is expressed only in activated HSCs (Supplementary Fig. 2) and is activated by unconjugated bile acids [17,18]. Our previous study showed that S1PR2 is the predominant S1PR in hepatocytes and cholangiocytes and that S1PR2 mediates TCA-induced cholangiocyte proliferation [13,15]. In this study, PCR analysis and agarose gel electro-phoresis showed that S1PR1, S1PR2, and S1PR3 were expressed at detectable levels, and that S1PR2 and S1PR3 were the most abundant S1PRs in LX-2 and JS-1 cells (Fig. 2A).
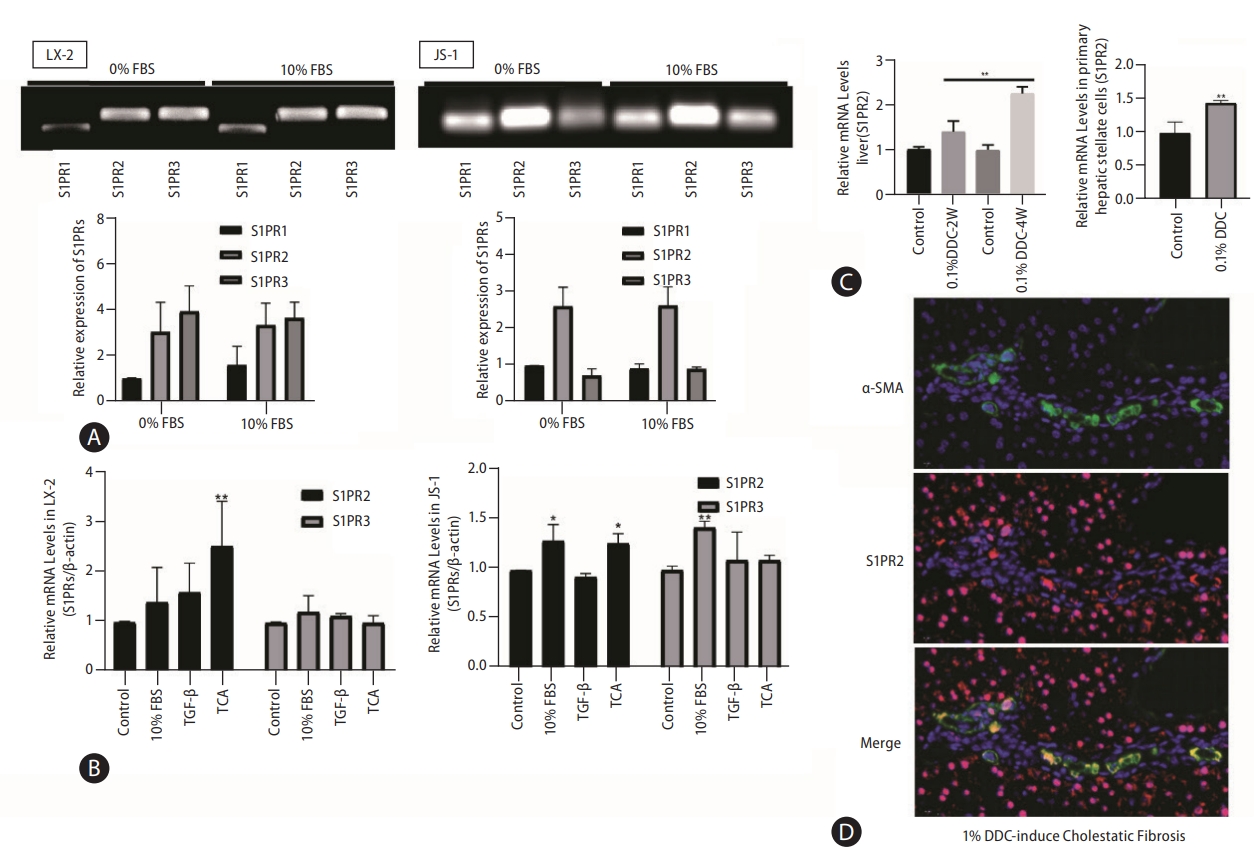
S1PR2 is the predominant S1PR expressed in HSCs and is upregulated under cholestatic conditions. S1PR expression in LX-2 and JS-1cells was examined by PCR and agarose gel electrophoresis (A). Dynamic mRNA expression of S1PR2 and S1PR3 in quiescent and activated LX-2 and JS-1 cells(B). ICR mice were subjected to 0.1% DDC feeding for two weeks or four weeks. Total RNA wasisolated. Mouse primary HSCs were isolated from sham control or DDC-fed mice (4 weeks) (C). The mice were fed a control diet or a DDC-supplemented diet (0.1%) for 2 or 4 weeks to induce advanced biliary fibrosis. S1PR2 mRNA levels were detected by real-time RT-PCR and normalized using GAPDH. Immunofluorescence analysis of hepatic α-SMA (green) and S1PR2 (red) in mice with DDC-induced liver fibrosis (D). The data shown are the mean±SEM. S1PR2, sphingosine 1-phosphate receptor 2; HSCs, hepatic stellate cells; DDC, 3,5-diethoxycarbonyl-1,4-dihydrocollidine; α-SMA, α-smooth muscle actin; FBS, fetal bovine serum; TCA, taurocholic acid. *P<0.05, **P<0.01 compared with the control group; n=3.
Given that HSC activation is a hallmark of hepatic fibrosis, we further correlated S1PR expression with HSC activation. Treatment with 10% FBS, TGF-β or TCA was used to activate HSCs in vitro. As demonstrated by real-time PCR, expression of only S1PR2 was significantly increased in activated LX-2 and JS-1 cells, especially after TCA treatment (Fig. 2B). Subsequently, we determined whether S1PR2 expression was altered in mice with cholestatic liver fibrosis by feeding them a 0.1% DDC-supplemented diet for 2 weeks or 4 weeks (Supplementary Fig. 3). Interestingly, the mRNA expression of S1PR2 was significantly upregulated in the liver and primary HSC in the DDC-stimulated groups, and the highest response occurred at 4 weeks (Fig. 2C). Finally, we performed immunofluorescence analysis of hepatic S1PR2 (red) and α-SMA (green) in 0.1% DDC-treated mice with cholestatic liver fibrosis. As shown in Figure 2D, S1PR2 protein expression was high in activated HSCs under cholestatic conditions.
S1PR2 mediates HSC activation induced by TCA
We next used specific S1PR antagonists to determine which S1PR subtypes are involved in TCA-induced HSC activation. As shown in Fig. 3A, pretreatment with the S1PR2 antagonist JTE-013 reversed TCA-induced cell proliferation, whereas the specific S1PR3 antagonist CAY10444 failed to induce this effect in LX-2 or JS-1 cells. The administration of JTE-013 abrogated the migratory response of HSCs by TCA in LX-2 and JS-1 cells (Fig. 3B). In contrast, stimulation with CAY10444 had little effect on TCA-induced HSC migration, and the inhibitory effect of CAY10444 on the HSC migratory response induced by TCA was much lower than that of JTE-013 (Fig. 3B). In LX-2 cells, pretreatment with JTE-013 or CAY10444 inhibited the potent increase in the contraction of HSC-embedded collagen gel in response to TCA (100 μM) and increased collagen gel surface area compared to that in the TCA-alone group, but the inhibitory effect of JTE-013 was greater than that of CAY10444, indicating that S1PR2 mediated the effect of TCA on HSC contraction (Fig. 3C).

S1PR2 mediates HSC activation induced by TCA. The viability of LX-2 or JS-1 cells that were preincubated with or without JTE-013 or CAY10444 and stimulatedwith TCA (12.5, 25, 50, 100 µM) (A). The motility of LX-2 or JS-1 cellsthat were preincubatedwith or without JTE-013 or CAY10444 and stimulated with TCA (100 µM) (B). The contractility of LX-2 cells(C) that were preincubated with or without JTE-013 or CAY10444 and stimulated with TCA (100 µM). The protein and mRNA levels of α-SMA and collagen 1 in LX-2 (D) and JS-1 (E) cells that were preincubated with or without JTE-013 and stimulatedwith TCA (100 μM). RT-PCR analysis of S1PR2, collagen 1 and α-SMA mRNA levelsin LX-2 (F) and JS-1 cells (G) treated with lentivirus expressing S1PR2 shRNA or vector control after TCA treatment (100 μM). The data shown are the mean±SEM. S1PR2, sphingosine 1-phosphate receptor 2; HSCs, hepatic stellate cells; TCA, taurocholic acid; α-SMA, α-smooth muscle actin; FBS, fetal bovine serum. *P<0.05, **P<0.01, ***P<0.005 comparedwith the control group. #P<0.05, ##P<0.01, ##P<0.005 comparedwith the TCA-only group; n=4.
Similar to the effects on extracellular matrix protein production, JTE-013 completely blocked TCA-induced protein expression of α-SMA and collagen 1 in LX-2 and JS-1 cells (Fig. 3D, E). RT-PCR showed that the TCA-induced increase in α-SMA and collagen 1 mRNA levels was inhibited by JTE-013-mediated downregulation of S1PR2 expression (Fig. 3D, E). S1PR2 shRNA also inhibited these TCA-induced fibrogenic effects of activated HSCs (Fig. 3F, G). RT-PCR confirmed the specific suppression of S1PR2 by this shRNA (Fig. 3F, G), and treatment with TCA failed to produce similar effects. Taken together, these data showed that TCA acts through S1PR2 to regulate HSC proliferation, migration, contraction, and production of extracellular matrix proteins.
Pharmacological inhibition of S1PR2 by JTE-013 alleviated the severity of liver injury in mice with DDC-induced liver fibrosis
Given the effect of S1PR2 signaling on HSC activation and the role of HSCs in fibrotic responses, we next assessed the potential impact of S1PR2 antagonists on cholestatic liver fibrosis. We fed mice a 0.1% DDC diet in the presence or absence of JTE-013 for 4 weeks (Fig. 4A). Serum levels of aspartate aminotransferase (AST) and alanine aminotransferase (ALT), which are markers of liver injury, were decreased by the administration of JTE-013 in the DDC model group (Supplementary Fig. 4). H&E- and Masson’s trichrome-stained liver sections from all groups of mice indicated that treatment with JTE-013 significantly decreased bile duct proliferation, inflammatory cell infiltration and fibrotic regions in injured livers (Fig. 4B). The level of hydroxyproline in liver tissues was markedly attenuated in JTE-013-treated mice compared with DDC model mice ([122.9±7.18] vs. [98.49±2.97] μg/g, P<0.05) (Fig. 4C). The mRNA expression levels of fibrosis markers (collagen α1, TIMP-1, TGF-β) and CYP2E10 were markedly elevated in the livers of mice fed a DDC-containing diet, and S1PR2 blockade after JTE-013 exposure decreased these responses (Fig. 4D). Finally, we performed immunofluorescence analysis of hepatic α-SMA (green), which confirmed that JTE-013 administration reversed the increase in the number of α-SMA-positive cells (activated HSCs) in mice with DDC-induced liver fibrosis (Fig. 4E, Supplementary Fig. 5). These results showed that pharmacologic inhibition of S1PR2 by JTE-013 attenuated liver injury and fibrogenesis in vivo.
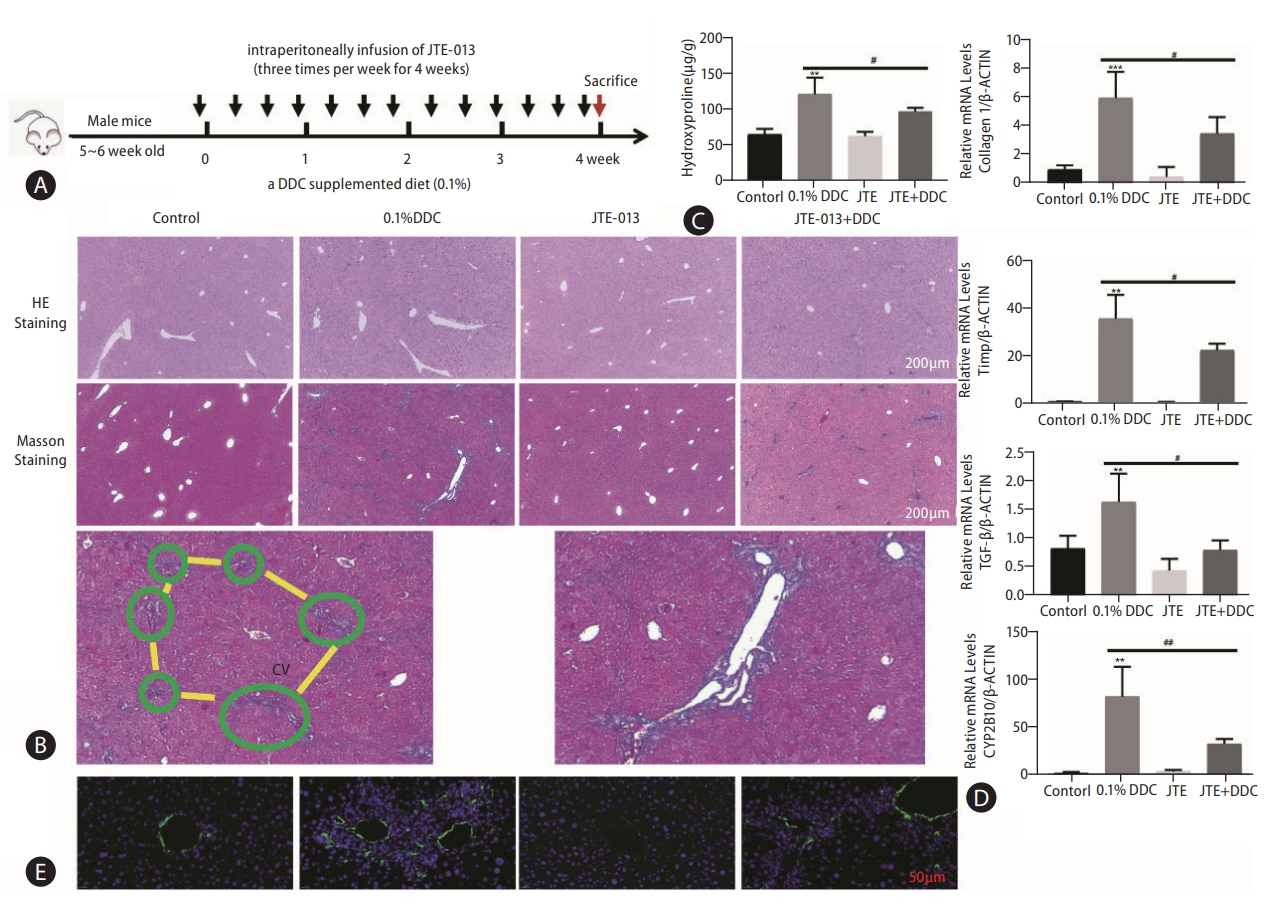
Pharmacological inhibition of S1PR2 by JTE-013 alleviated the severity of liver injury in mice with DDC-induced liver fibrosis. A scheme of the mouse model isshown (A). Representative images of hepatic H&E staining and Masson’s trichrome staining are shown (B). Scale bars, 100 μm. Note the collagen fiber in the liver lobule (framed in green) preceding the development of portal-portal fibrous bridges (highlighted in yellow). Higher magnification view. Hepatic hydroxyproline levels (C). RT-PCR analysis of hepatic collagen 1, TIMP-1, TGF-β and CYP2B10 mRNA levels was carried out (D). Immunofluorescence staining showing hepatic α-SMA expression (E). The data shown are the mean±SEM. S1PR2, sphingosine 1-phosphate receptor 2; DDC, 3,5-diethoxycarbonyl-1,4-dihydrocollidine; cv, central vein; α-SMA, α-smooth muscle actin. **P<0.01, ***P<0.005 compared with the control group. #P<0.05, ##P<0.01 compared with the DDC model group; n=5-7.
S1PR2 knockdown alleviated liver injury in mice with cholestatic liver fibrosis
Considering the possible off-target effects of JTE-013, we next used gene delivery methods with recombinant adenoassociated virus (AAV) vectors to inhibit S1PR2 function (Fig. 5A). Wild-type mice injected with recombinant adenovirus carrying S1PR2 via the tail vein had significantly decreased S1PR2 expression compared to mice that received Ad-Vector (Fig. 5B). Serum levels of ALT and AST and the levels of proinflammatory cytokines, including TNF-α and IL-6, were also increased in the DDC model group but were decreased in AAV-shS1PR2 mice (Supplementary Fig. 6). Silencing S1PR2 dramatically alleviated bile duct proliferation and inflammatory cell infiltration in AAV-S1PR2 shRNA-DDC mice compared to DDC model mice (Fig. 5C). Masson’s trichrome staining showed a significant reduction in collagen deposition in the livers of AAV-S1PR2 shRNA-infected mice compared to those of single DDC model mice (Fig. 5C), which was consistent with decreased hepatic hydroxyproline levels (Fig. 5D). DDC mice treated with AAV-S1PR2 shRNA exhibited a significant decrease in hepatic mRNA expression of fibrosis markers, including collagen 1, TIMP-1, TGF-β, and CYP2B10, compared to that in DDC model mice (Fig. 5E). Finally, immunofluorescence staining for hepatic α-SMA (green) confirmed that the number of α-SMA-positive cells (activated HSCs) in DDC mice treated with AAV-S1PR2 shRNA was less than that in DDC mice treated with Ad-Vector (Fig. 5F). These results suggest that S1PR2 expression is essential for the development of liver fibrogenesis.

S1PR2 knockdown alleviated liver injury in mice with cholestatic liver fibrosis. Schematic showing the mouse model (A). RT-PCR analysis of S1PR2 levelsin the liver and primary HSC (B). Representative imagesfollowing hepatic H&E staining and Masson’strichrome staining (C). Scale bars, 100 μm. Hepatic hydroxyproline levels (D). RT-PCR analysis of hepatic collagen 1, TIMP-1, TGF-β and CYP2B10 mRNA levels (E). Immunofluorescence staining showing hepatic α-SMA expression (F). The data shown are the mean±SEM. S1PR2, sphingosine 1-phosphate receptor 2; HSCs, hepatic stellate cells; AAV, adeno-associated virus; DDC, 3,5-diethoxycarbonyl-1,4-dihydrocollidine. *P<0.05, **P<0.01, ***P<0.005 compared with the control group. #P<0.05 compared with the DDC model group of AAV-scramble mice; n=4.
YAP mediates TCA/S1PR2 signaling during HSC activation and cholestatic liver fibrosis
Based on the report [19] that the transcriptional coactivator yes-associated protein (YAP) is a powerful regulator of activated HSCs and to further investigate the role of YAP in the TCA-mediated S1PR2-related signaling pathway, LX-2 and JS-1 cells were treated with TCA for 4 h with or without JTE-013 stimulation. (Figure 6A show that TCA decreased phospho-YAP (p-YAP) levels in the cytosol and increased nuclear YAP levels, strongly demonstrating TCA-induced YAP transactivation in LX-2 and JS-1 cells. As expected, JTE-013 significantly decreased TCA-induced YAP nuclear localization in LX-2 and JS-1 cells (Fig. 6A). Moreover, as demonstrated by immunofluorescence analysis, YAP was uniformly distributed throughout the entire cell in the control group, whereas after treatment with 100 μM TCA for 4 hours, YAP translocated to the nucleus in most HSCs (Fig. 6B, Supplementary Figs. 7, 8). However, when S1PR2 was blocked by JTE-013, YAP remained in the cytoplasm of HSCs (Fig. 6B, Supplementary Figs. 7, 8). Similarly, YAP target genes (e.g., CTGF and CyclinD1) were strongly expressed in HSCs that were treated with TCA and were weakly expressed in cells that were pretreated with JTE-013 or S1PR2 shRNA (Fig. 6C, D). Similarly, in DDC-supplemented mice, significantly fewer AAV-S1PR2 shRNA-infected mice showed nuclear YAP compared with the vehicle control group (Fig. 6E). This result, together with the data that AAV-S1PR2 shRNA infection led to lower CyclinD1 and CTGF levels, further shows that TCA-mediated S1PR2 activation and triggered YAP nuclear translocation and downstream effects (Fig. 6F). Finally, downregulation of YAP using a lentiviral shRNA specific to YAP completely blocked TCA-induced upregulation of CTGF and collagen 1 in JS-1 cells (Fig. 6G).
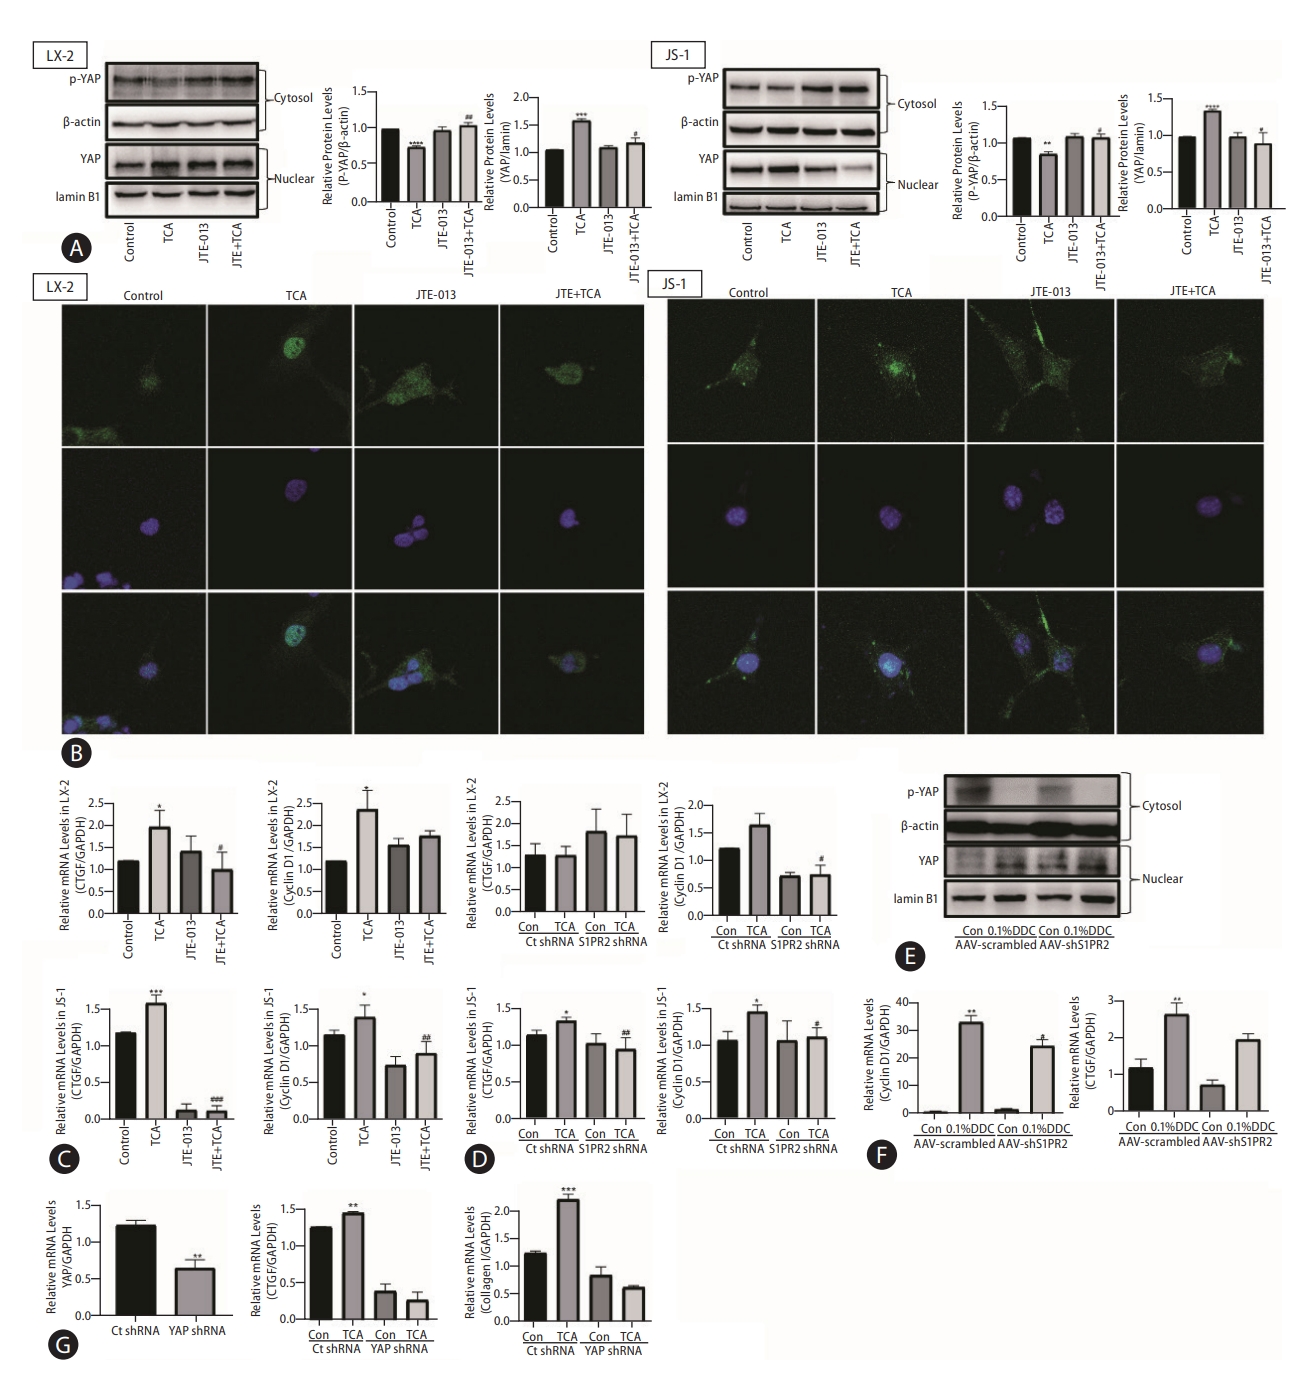
YAP mediates TCA/S1PR2 signaling during HSC activation and cholestatic liver fibrosis. Western blot showing p-YAP and YAP levels in HSC (A). The YAP (green) distribution in the cells was observed by immunofluorescence staining (B). The nuclei of the cells were labeled with DAPI (blue). The mRNA levels of CTGF and CyclinD1 in LX-2 cells that were preincubated with or without JTE-013 and stimulated with TCA (100 μM) (C). RT-PCR analysis of CTGF and CyclinD1 mRNA levels in LX-2 cells treated with lentivirus expressing S1PR2 shRNA or vector control after TCA treatment (100 μM) (D). ICR mice were injected via the tail vein with adeno-associated virus carrying S1PR2-targeting shRNA or scramble control shRNA and were subjected to 4 weeks of DDC feeding as described in the Methods. Western blot showing p-YAP and YAP levels in the mice (E). RT-PCR analysis of hepatic cyclin D1, CTGF mRNA levels(F). JS-1 cells were treated with lentivirus expressing YAP shRNA or vector control after TCA treatment (100 μM). The mRNA levels of YAP, CTGF and collagen 1 were detected by real-time RT-PCR (G) and normalized to GAPDH, which acted as an internal control. The data shown are the mean±SEM. YAP, yes-associated protein; p-YAP, phospho-YAP; TCA, taurocholic acid; S1PR2, sphingosine 1-phosphate receptor 2; HSCs, hepatic stellate cells. *P<0.05 compared with the control group. #P<0.05 compared with the TCA-alone group; n=4.
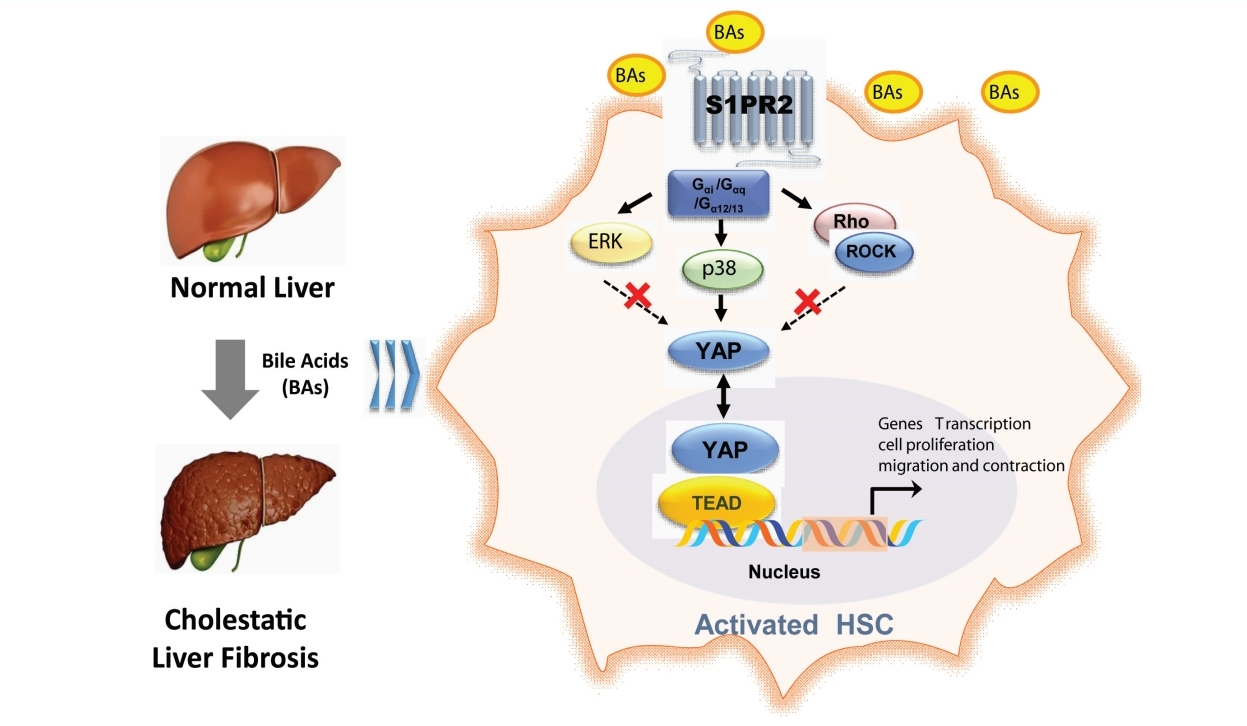
As a G protein-coupled receptor, S1PR2 couples with several different G-alpha subunits, such as Gα(i/o), Gαq, and Gα(12/13), and activates Rho kinase (ROCK), Erk or p38 MAPK [20]. Our results showed that the selective p38 MAPK inhibitor SB203580 inhibited the TCA-induced increase in nuclear YAP protein levels in JS-1 and LX-2 cells (Fig. 7A). Moreover, Y27632 (a ROCK inhibitor) and U0126 (an ERK inhibitor) did not significantly inhibit the nuclear translocation of YAP. These results were consistent with the effect on YAP-target genes (e.g., CTGF and CyclinD1) and collagen 1 in JS-1 cells (Fig. 7B).
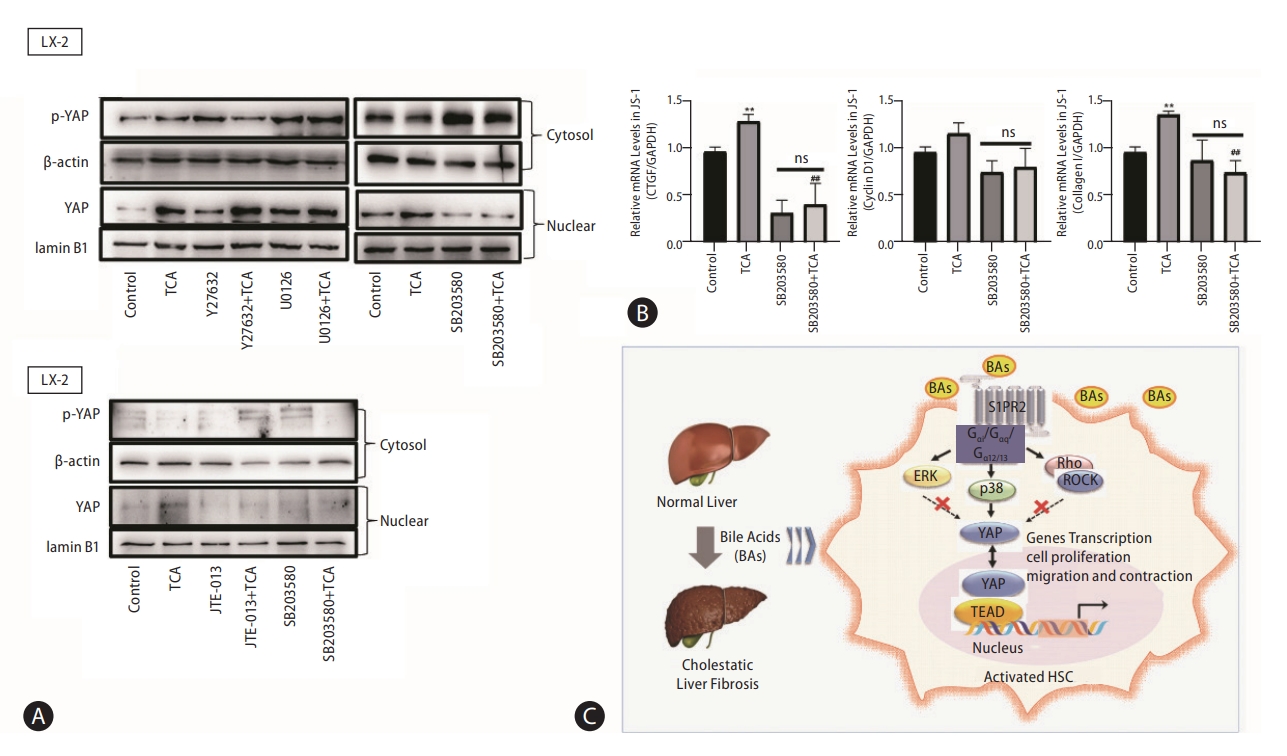
p38 mitogen-activated protein kinase pathways mediate YAP nuclear translocation and HSC activation by TCA. Western blot showing p-YAP and YAP levels in JS-1 and LX-2 cells that were preincubated with or without Y27632 (a ROCK inhibitor), U0126 (an ERK inhibitor) or SB203580 (a p38 inhibitor) and stimulated with TCA (100 μM) (A). mRNA levels of CTGF, CyclinD1 and collagen 1 in JS-1 cells that were preincubated with or without SB203580 and stimulated with TCA (100 μM) (B). Schematic diagram of the mechanism by which TCA activation of the S1PR2/p38 MAPK/YAP signaling axis in HSCs is essential for cholestatic liver fibrosis (C). The data shown are the mean±SEM. YAP, yes-associated protein; p-YAP, phospho-YAP; HSCs, hepatic stellate cells; TCA, taurocholic acid; S1PR2, sphingosine 1-phosphate receptor 2; ns, OOO. **P<0.01 compared with the control group. ##P<0.01 compared with the TCA-alone group; n=4.
DISCUSSION
HSCs are resident perisinusoidal cells with slow proliferative rates that are distributed in the subendothelial space of Disse throughout the liver [21]. Once liver injury occurs, signals sent from surrounding parenchymal cells, such as elevated bile acid concentrations, activate HSCs and promote HSC differentiation into proliferative, contractile, and fibrogenic myofibroblasts to repair the injured liver [22,23]. A recent study demonstrated that HSCs were the main sources of fibroblasts (82–89%) in cholestatic-induced liver fibrosis models [24]. However, it is unclear which signals are involved in HSC transdifferentiation under cholestatic conditions.
In this study, we demonstrated that the accumulation of bile acids, as occurs in obstructive jaundice, correlates with HSC transdifferentiation and the progression of fibrosis associated with cholestatic liver disease. We identified that bile acids, especially TCA, are profibrogenic factors that play essential roles in regulating the myofibroblast-like function of HSCs during cholestatic liver repair. Svegliati-Baroni et al. [8] found that the effect of bile acids on HSC proliferation was closely related to their concentration. Under normal, noncholestatic conditions, bile acid concentrations such as 5 μM do not induce HSC proliferation; however, bile acids can promote HSC proliferation at concentrations that are commonly found in chronic cholestasis (approximately 200 μM). Consistent with these results, in the present study, the concentration of TCA (>200 μM) that dose-dependently stimulated HSC proliferation did not increase cell number or induce death in HepG2 cells (Fig. 1A). In addition, under pathological conditions (100 μM), TCA markedly promoted HSC transdifferentiation into proliferative, migratory and contractile myofibroblasts, thus inducing profibrogenic transcriptional and secretory properties in human LX-2 and mouse JS-1 cells (Fig. 1). These results suggested that HSCs were resistant to the bile acid–induced signaling pathway, which could be attributed to a lack of the critical bile acid importer, suggesting that bile acid was not internalized. Sommerfeld et al. [25] showed that cholestatic bile acids led to EGFR phosphorylation, triggered rapid NADPH oxidase activation and induced HSC proliferation in quiescent HSCs [25]. In this study, S1PR2, a transmembrane G protein-coupled receptor, was required for TCA-induced proliferation, migration, contraction, and production of extracellular matrix proteins in LX-2 and JS-1 cells. Expression of S1PR2, the most abundant S1PR expressed in HSC, was significantly upregulated after HSC activation, especially after TCA treatment (Fig. 2). Previous studies have identified an affinity between TCA and S1PR2. JTE-013, a specific antagonist of S1PR2, and a shRNA specific to S1PR2 blocked TCA-induced HSC activation (Fig. 3). In addition, both S1PR2 deficiency induced by the injection of recombinant adenovirus carrying S1PR2 and antagonism of S1PR2 by JTE-013 selectively reduced hepatic fibrogenesis in mice with DDC-induced liver fibrosis (Figs. 4, 5). Kageyama et al. [26] reported that an S1PR2 antagonist reduced portal vein pressure without affecting mean arterial pressure in rats with cirrhosis caused by bile duct ligation.
An earlier article published in Gut first described the presence of sodium-dependent taurocholate cotransporting polypeptide (Slc10a1/NTCP) on human liver HSCs obtained from liver fibrosis patients, and a positive correlation between NCTP expression levels and the severity of hepatic fibrosis was reported [27]. Another study investigated how HSC NTCP mediated the uptake of bile acids and activated HSC function [27]. Kunst et al. [10] then used a specific and well-characterized NTCP inhibitory peptide (Myrcludex B) to perform bile salt uptake assays in LX-2 and U2OS cells overexpressing human NTCP. The results showed that unlike that of U2OS cells overexpressing human NTCP, the uptake of 3H-TCA in LX2 cells occurred at background levels and could not be blocked with Myrcludex B [10]. In addition, when the cells were incubated with FITC-labeled Myrcludex B, TGF-β-activated LX2 cells did not show plasma membrane labeling, in contrast to NTCP-positive U2OS cells [10]. These results suggest that no NTCP-positive cells were present in this cell population. Therefore, we detected the levels of NTCP and other bile acid-related receptors in quiescent and activated HSCs, which were extremely low (Supplementary Fig. 1). We agree with Kunst et al. [10] that the experiments performed by Salhab et al. [27] do not show a direct role of NTCP activity in stellate cells that contributes to fibrosis, and that further evidence is still needed. Interestingly, NTCP not only extracts the majority of conjugated bile acids but also mediates the entry of hepatitis B virus (HBV) into the liver [28-30]. Myrcludex B and its ability to interfere with viral entry into hepatocytes are currently being tested in HBV/HDV clinical trials [31,32].
Obeticholic acid (OCA), the most potent FXR agonist, has been approved by the FDA and EMEA for the treatment of ursodeoxycholic acid (UDCA)-resistant patients with PBC [33]. More recently, the results from a planned interim analysis of an ongoing phase 3 study of OCA for nonalcoholic steatohepatitis (NASH) showed that 25 mg of OCA significantly improved liver fibrosis (≥1 stage), compared to that in 12% of placebo patients [34]. Although the phase III clinical trial of OCA for liver fibrosis with NASH reached one of its primary clinical endpoints, the response rate was not optimal. OCA was suggested to exert beneficial effects by activating FXR in hepatocytes and intestinal epithelial cells [35,36]. More importantly, hepatocytes are highly expressed with more abundant FXR expression than seen in HSCs. Hepatocytes may regulate the activation of HSCs via the secretion of bile acids and apoptotic bodies, which suggests that FXR ligands also impede HSC activation indirectly by targeting FXR in hepatocytes. Moreover, OCA cannot directly protect hepatocytes from death receptor-engaged apoptosis, which is a core pathological event involved in stimulating fibrotic development [35]. FXR protein levels are also reduced with the progression of fibrotic development and inflammation. In addition to FXR signaling, OCA directly inhibits NLRP3 inflammasome activation in macrophages, further suppressing inflammasome activationelicited hepatic lipid accumulation and contributing to the amelioration of NASH [37]. Some studies have shown that FXR is expressed in HSCs, where it functions as a transcription factor that regulates expression of the small heterodimer partner (SHP) gene and microRNA-29a, thereby reducing the expression of profibrotic genes, including Acta2 (encoding αSMA), transforming growth factor β1 (Tgfb1), collagen 1a1 (Col1a1), Col1a2, tissue inhibitor of metalloprotease 1 (Timp1), and Timp2 [38-40]. However, these results were contradicted by later studies showing that culture-activated HSC were not responsive to FXR agonists; the expression of both SHP and ACTA2 in culture-activated HSCs remained unaffected after 24 h of in vitro stimulation with 1 or 100 μM OCA [41,42]. In addition, a study from Fickert et al. [42] showed undetectable FXR protein expression in HSCs and myofibroblasts in five mouse models of liver fibrosis of different etiologies and unchanged SHP mRNA expression in FXR ligand-treated myofibroblasts. Our experimental results are in accordance with previous studies; we also found that mRNA expression levels of FXR were very low, but did not remain unaffected after 24 hours of in vitro stimulation with 100 μM TCA (Supplementary Fig. 1). In 2020, Zhou et al. [43] reported that enhanced SUMOylation of FXR in the process of HSC activation and fibrogenesis strongly compromises FXR signaling, providing insight into why OCA alone has limited effects against liver fibrosis. All in all, due to the low FXR expression levels and enhanced SUMOylation of FXR in HSCs, it seems rather unlikely that HSCs can be directly targeted by FXR ligands.
As a central component of Hippo signaling, YAP is an important regulator of development and homeostasis in multiple tissues. YAP is relatively inactive in the healthy liver but is substantially activated in HSCs in response to liver injury [19]. In vitro, YAP siRNA or the YAP inhibitor verteporfin block the differentiation of HSCs into myofibroblasts; in vivo, verteporfin slows liver fibrosis in mice [44]. Mechanical signals such as ECM stiffness stimulate the Rho/ROCK pathway in the cytoplasm, promote YAP translocation, and activate downstream signaling pathways to induce cell differentiation into myofibroblasts [45]. In addition, YAP activation stimulates glutaminolysis to direct quiescent HSC transdifferentiation and myofibroblastic HSC proliferation [46]. These findings further confirm that YAP activation regulates HSC activation. In the signaling pathway upstream of YAP, several factors, including G-protein-coupled receptor signaling, mechanical signaling, and adhesive junctions, are well known to impact the activity of YAP [47,48]. In this study, we demonstrated that YAP-mediated HSC activation under cholestatic conditions occurred through S1PR2. Given that p38 MAPK was activated downstream of multiple S1PR2 signaling pathways and SB203580 (a p38 MAPK inhibitor) abrogated the TCA-induced increase in nuclear YAP protein levels, we concluded that the S1PR2/p38 MAPK/YAP signaling pathways regulated TCA-induced HSC activation (Fig. 7).
In summary, we found that conjugated bile acids stimulate the progression of liver fibrosis via S1PR2. These findings further highlight a promising correlation between accumulation of bile acids and progressive liver fibrosis, suggesting S1PR2 inhibition as a potential therapeutic target in cholestatic liver disease. Further studies are needed to confirm these results and explore their clinical implications.
Notes
Authors’ contribution
JY and LX conceived the study and designed the project. XT, ZL, and MC carried out the experiments and interpreted the data. XT wrote the paper. JY and LX revised the paper. All authors approved the final version of the manuscript.
Conflicts of Interest
The authors have no conflictsto disclose.
Acknowledgements
This work wassupported by Grantsfrom the National Natural Science Foundation of China (No. 81900560, 81873084).
Supplementary materials
Supplementary material is available at Clinical and Molecular Hepatology website (http://www.e-cmh.org).
The expression of bile acid-related receptors NTCP and FXR in HSCs. Amplification plot of NTCP (A) and FXR (B) expression in LX-2 cells by real-time RT-PCR. NTCP and FXR (C) mRNA levels in quiescent and activated LX-2 cells. FXR, farnesoid X receptor; HSCs, hepatic stellate cells; TCA, taurocholic acid; FBS, fetal bovine serum.
The expression of bile acid-related cell surface receptors TGR5 and S1PR2 in HSCs. Amplification plot of S1PR2 and TGR5 expression in LX-2 cells by real-time RT-PCR (A). TGR5 mRNA levels in quiescent and activated HSCs (B). TGR5, GPBAR1; S1PR2, sphingosine 1-phosphate receptor 2; HSCs, hepatic stellate cells; TCA, taurocholic acid; FBS, fetal bovine serum.
Cholestatic liver fibrosis mice by feeding of the 0.1% DDC-supplemented diet for 2 weeks, 4 weeks. The representative images of hepatic H&E staining and Masson’s trichrome staining (A). Scale bars, 100 μm. RT-PCR of hepatic collagen 1 (B), TIMP-1 (C), TGF-β (D) and TGR5 (E). mRNA levels in liver tissues. Data shown are the mean±SEM. TGR5, GPBAR1; DDC, 3,5-diethoxycarbonyl-1,4-dihydrocollidine. *P<0.05, **P<0.01, ***P<0.005 compared with the control group.
Pharmacologic inhibition of S1PR2 by JTE-013 alleviates the severity of liver injury in DDC-induced liver fibrosis mice. Serum levels of alanine aminotransferase (ALT, A) and aspartate aminotransferase (AST, B). Hepatic CCL2 (C) mRNA levels on RT-PCR. S1PR2, sphingosine 1-phosphate receptor 2; DDC, 3,5-diethoxycarbonyl-1,4-dihydrocollidine. ***P<0.005 compared with the control group. #P<0.05 compared with the DDC model group.
Immunofluorescence staining showing hepatic α-SMA expression (nuclei indicated by the red arrows). α-SMA, α-smooth muscle actin.
S1PR2 knockdown obviously alleviates liver injury in cholestatic liver fibrosis mice. AST (A) and ALT (B) levels in serum of WT mice and S1PR2-/- mice. Pro-inflammatory factors including TNF-α (C), IL-6 (D) in serum on ELISA. S1PR2, sphingosine 1-phosphate receptor 2; DDC, 3,5-diethoxycarbonyl-1,4-dihydrocollidine; AST, aspartate aminotransferase; ALT, alanine aminotransferase. ***P<0.005 compared with the control group. #P<0.05 compared with the DDC model group.
YAP (green) distribution in the LX-2 cells was observed by immunofluorescence staining. YAP, yes-associated protein; TCA, taurocholic acid.
YAP (green) distribution in the JS-1 cells was observed by immunofluorescence staining. YAP, yes-associated protein; TCA, taurocholic acid.
List of Real-Time primer sequences used in this study
Sequences for siRNAs
Abbreviations
HSCs
hepatic stellate cells
AAV
adeno-associated virus
DDC
3
TCA
taurocholic acid
YAP
yes-associated protein
p-YAP
phospho-YAP
p38 MAPK
p38 mitogen-activated protein kinase
EGFR
epidermal growth factor receptor
FXR
farnesoid X receptor
LXR
liver X receptor
S1PR2
sphingosine 1-phosphate receptor 2
α-SMA
α-smooth muscle actin
FBS
fetal bovine serum
AST
aspartate aminotransferase
ALT
alanine aminotransferase
ROCK
Rho kinase
HBV
hepatitis B virus
OCA
obeticholic acid
UDCA
ursodeoxycholic acid
NASH
nonalcoholic steatohepatitis
SHP
small heterodimer partner
TBA
total bile acids
References
Article information Continued
Notes
Study Highlights
• TCA activated quiescent HSCs into proliferative, migratory, contractile, and fibrogenic myofibroblasts.
• TCA promotes hepatic stellate cell activation via S1PR2/p38 MAPK/YAP signaling under cholestatic conditions.
• S1PR2 is the predominant S1PR expressed in HSCs and is upregulated under cholestatic conditions.
• Blockage of S1PR2 attenuated liver injury and fibrogenesisin DDC-induced liver fibrosis.
• S1PR2 is a potential therapeutic target in cholestatic liver disease.