Hepatitis B virus pre-genomic RNA and hepatitis B core-related antigen reductions at week 4 predict favourable hepatitis B surface antigen response upon long-term nucleos(t)ide analogue in chronic hepatitis B
Article information

See the commentary-article "New biomarkers of hepatitis B virus (HBV) infection: HBV RNA and HBV core-related antigen, new kids on the block?" on page 118.
Abstract
Background/Aims
We investigated the dynamics of serum HBV pre-genomic RNA (pgRNA) and hepatitis B core-related antigen (HBcrAg) in patients receiving nucleos(t)ide analogues (NAs) and their predictability for favourable suppression of serum hepatitis B surface antigen (HBsAg).
Methods
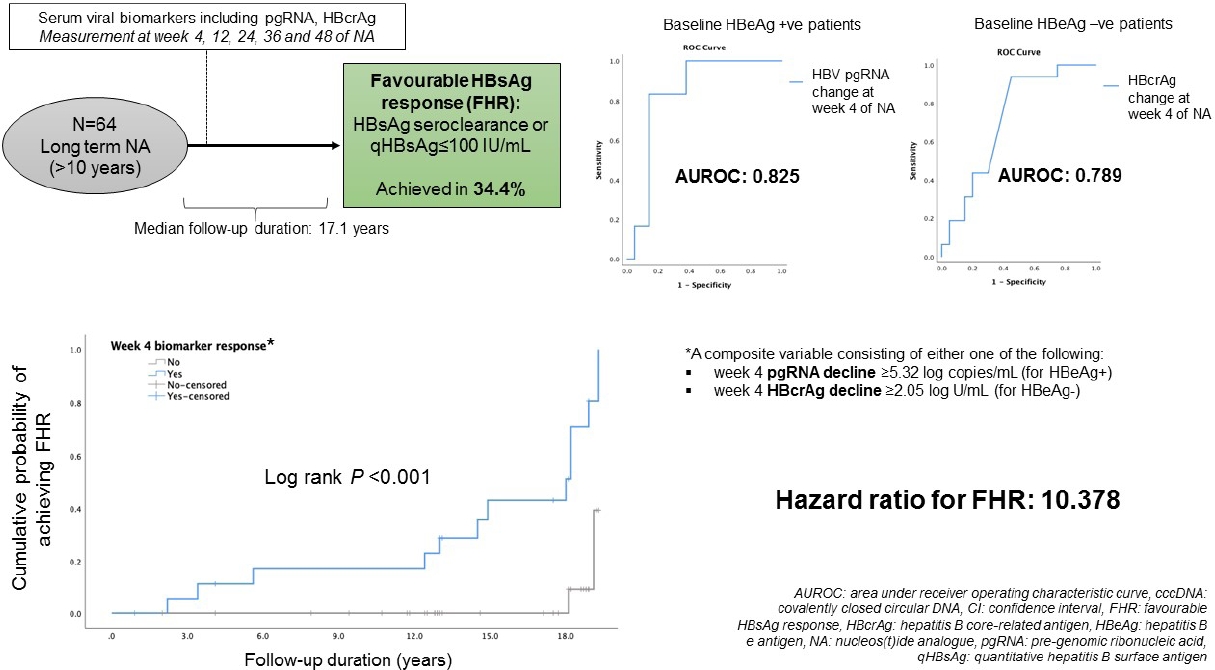
Serum viral biomarkers were measured at baseline, weeks 4, 12, 24, 36, and 48 of treatment. Patients were followed up thereafter and serum HBsAg level was measured at end of follow-up (EOFU). Favourable HBsAg response (FHR) was defined as ≤100 IU/mL or HBsAg seroclearance upon EOFU.
Results
Twenty-eight hepatitis B e antigen (HBeAg)-positive and 36 HBeAg-negative patients (median, 38.2 years old; 71.9% male) were recruited with median follow-up duration of 17.1 years (interquartile range, 12.8–18.2). For the entire cohort, 22/64 (34.4%) achieved FHR. For HBeAg-positive patients, serum HBV pgRNA decline at week 4 was significantly greater for patients with FHR compared to non-FHR (5.49 vs. 4.32 log copies/mL, respectively; P=0.016). The area under the receiver-operating-characteristic curve (AUROC) for week 4 HBV pgRNA reduction to predict FHR in HBeAg-positive patients was 0.825 (95% confidence interval [CI], 0.661–0.989). For HBeAg-negative patients, instead of increase in serum HBcrAg in non-FHR patients, FHR patients had median reduction in HBcrAg at week 4 (increment of 1.75 vs. reduction of 2.98 log U/mL; P=0.023). The AUROC for week 4 change of HBcrAg to predict FHR in HBeAg-negative patients was 0.789 (95% CI, 0.596–0.982).
Conclusions
Early on-treatment changes of serum HBV pgRNA and HBcrAg at 4 weeks predict HBsAg seroclearance or ≤100 IU/mL in NA-treated CHB patients upon long-term FU.
Graphical Abstract
INTRODUCTION
Despite the availability of an effective vaccine, hepatitis B virus (HBV) infection is still a global problem, with an estimate of 292 million people being infected [1]. Currently approved antiviral treatment against chronic hepatitis B (CHB), in the form of nucleos(t)ide analogues (NAs), is very effective in suppression of serum HBV DNA, thereby normalization of liver functions, histological improvement, and reduction in risk of hepatocellular carcinoma and mortality [2-6]. However, a more desirable treatment endpoint i.e., functional cure, defined as hepatitis B surface antigen (HBsAg) seroclearance, is still a rare event (about 1% per year) even with long-term NA treatment [7-9]. Moreover, there is a high rate of virological relapse if NA is stopped before achieving functional cure. Therefore, most patients need to take NA on a long-term basis. Little is known about which patients can achieve functional cure so that NA can be stopped after a finite duration. A number of HBV serum markers have been shown to be suppressed by NA and are associated with post-NA cessation virological control. The most-studied markers are HBsAg level, hepatitis B core-related antigen (HBcrAg) and HBV pre-genomic RNA (pgRNA). According to several natural history of disease studies, patients with HBsAg levels <100 IU/mL had a good chance of subsequent loss of HBsAg upon continuation of follow-up [10-13]. However, the rate of HBsAg decline on NA is modest (0.107 log IU/mL per year) [14] and it will take decades to reach the preferable target of HBsAg level lower than 100 IU/mL.
HBcrAg is a composite measure of three HBV proteins, namely the hepatitis B core antigen, hepatitis B e antigen (HBeAg) and a 22 kDa precore protein [15,16]. HBcrAg has been shown to correlate with covalently closed circular DNA (cccDNA) levels [17,18], and is suppressed by NA treatment [14,19,20]. Recent studies have suggested that HBV pgRNA can be detected in the serum of CHB patients and can serve as a marker for viral replication [21-26]. Serum HBV pgRNA levels correlate with the levels and transcriptional activity of cccDNA, and is suppressed by NA therapy [22,27-29]. It is not known whether the effect of long-term NA-treatment on HBsAg suppression could be reflected by the early on-treatment changes of HBV serum markers such as HBV pgRNA and HBcrAg.
Therefore, in the present study, we primarily aimed to study the dynamic changes of serum HBcrAg, HBV pgRNA and other serum markers in the first year of NA treatment and investigate whether they can predict favourable HBsAg response (FHR) in the long run. The secondary aim included the investigation of whether serum HBV markers could reflect intrahepatic viral replicative activity.
MATERIALS AND METHODS
Patients
Between January 2002 and April 2009, 215 CHB patients had taken part in three international phase III, randomized, double blind trials in our centre, namely the BEHoLD trials, comparing between entecavir and lamivudine [30,31]; the GLOBE trial, comparing between telbivudine and lamivudine [32]; and the QUASH trial, comparing between clevudine and adefovir. Among them, 124 patients had available paired liver biopsies taken at baseline and year 1 of treatment in our centre [33]. Of these, 67 had available stored serum samples (stored at -20°C) collected at baseline, week 4, week 12, week 24, week 36, and week 48 for analysis in the present study. Of these 67 patients, three were lost to long-term follow-up, leaving 64 patients for final analysis. The primary outcome of this study was the predictors for FHR at end of follow-up (EOFU) upon long-term NA. FHR was defined as HBsAg seroclearance or HBsAg ≤100 IU/mL at EOFU. Written informed consent were obtained from these patients for the analysis of liver tissue and blood samples. This study was approved by the Institution Review Board, The University of Hong Kong and Hospital Authority Hong Kong West Cluster (UW 18-021).
Analysis of serum HBV markers
Serum HBV DNA was measured by the COBAS HBV Test (Roche Diagnostics GmbH, Mannheim, Germany), with a lower limit of detection (LLOD) of 20 IU/mL. HBsAg was measured by the Elecsys HBsAg Quant II assay (Roche Diagnostics, Indianapolis, IN, USA) with a LLOD of 0.05 IU/mL (the LLOD per the manufacturers’ user manual is 0.04 U/mL in Paul-Ehrlich-Institute standard and 0.1 U/mL in World Health Organization standard). HBcrAg was measured with the Lumipulse HBcrAg assay (Fuijrebio Inc., Tokyo, Japan), with a linear range of 1,000 to 10,000,000 U/mL, while the LLOD was 100 U/mL. Values above the LLOD (i.e., 100–1,000 U/mL) are also presented for statistical analysis. This methodology has been verified and used in our previous studies [19,34,35]. Circulating HBV RNA was quantified by real-time polymerase chain reaction (PCR) using the Roche HBV RNA investigational assay (IA) for use on the cobas® 6800/8800 Systems (Roche Diagnostics, Pleasanton, CA, USA). The HBV RNA assay is a quantitative nucleic acid test (lower limit of quantification 10 copies/mL; linearity range 10 to 10×109 copies/mL on armored RNA template) to enable the detection and quantification of HBV RNA in EDTA plasma or serum of HBV-infected patients. Analytical verification was completed at Roche Development (RKZ) and included genotypes A, B, C, D. Additionally, in-silico analysis indicated the design would perform equivalently on all genotypes. All tests were performed by trained operators in accordance with the manufacturers’ specifications [36,37]. Runs were considered valid if internal controls were valid and no protocol deviations or incidents occurred that might affect the validity of the data. If a run was considered invalid, all samples included in that run were retested wherever possible. HBV genotyping was performed by PCR amplification of the HBV S region, followed by direct sequencing and phylogenetic comparison with reference HBV sequences in the National Center for Biotechnology Information (NCBI) GenBank, as previously described [38].
Analysis of intrahepatic HBV markers
The extraction of DNA from liver tissues, as well as the data and methods of measurement of intrahepatic total HBV DNA and cccDNA have been reported previously [18,33]. Briefly, intrahepatic total HBV DNA and cccDNA were isolated by either QIAamp DNA Mini-Kit or the Allprep DNA/RNA/protein (both Qiagen) according to manufacturer’s instructions, and measured by real-time PCR using hybridization probes and primers targeting the S regions and those targeting the nicked region of the HBV DNA genome for intrahepatic total HBV DNA and cccDNA, respectively, with lower limit of quantification of 0.001 and 0.005 copies/cell, respectively.
Detection of integrated HBV DNA
Liver DNA extraction
Degree of HBV DNA integration were studied in 17 patients with adequate liver tissue samples. Total liver DNA was extracted using the QIAamp DNA Mini kit (Qiagen, Hilden, Germany), according to manufacturer’s instructions. DNA quality and quantity were assessed using both the Qubit DNA quantification assay and the NanoDrop™ 2000c spectrophotometers (both from Thermo Fisher Scientific, Waltham, MA, USA).
Inverse PCR
HBV DNA integration and the estimation of hepatocyte clone size were measured by inverse PCR [39,40]. Inverse PCR relies on the selective use of restriction enzymes (NcoI in this case) to cut at both HBV DNA (near the DR1-DR2 region) and the human genome. Following re-ligation of the restricted fragments and further cutting by a second restriction enzyme (BsiHKAI), the fragments were amplified by nested-PCR. In order to detect HBV-human chimeric DNA in small hepatocyte clones, the restricted fragments were serially diluted and PCR-amplified in replicates of 12. The sequence of the primers for the first round PCR were OF1 (nt 1585–1603) 5′ -TTCGCTTCACCTCTGCACG-3′ and OR1 (nt 1422–1405) 5′ -AAAGGACGTCCCGCGCAG-3′; and those for the second round were IF2 (nt 1605–1623) ′-CGCATGGAGACCACCGTGA-3′and IR2 (nt 1390–1372) -CACAGCCTAGCAGCCATGG-3′. The identities of the amplicons were confirmed by Sanger sequencing.
Identification of viral-host junction and hepatocyte clone size calculation
Sequencing results were aligned with both HBV genome (NCBI accession number: NC_003977.1) and Human Reference Genome (GRCh38) for the identification of viral-host junctions and integration sites.
Determination of cell number in liver tissues
The number of cells in the liver tissues were determined by measurement of the human genomic DNA content in the extracted liver DNA using the Light-Cycler Control DNA kit (Roche Molecular Systems), based on an estimation of 6.667 pg human genomic DNA per cell. Intrahepatic total HBV DNA and cccDNA were log transformed and expressed in log copies/ liver cell, whereas HBV DNA integration frequency was expressed in integrants/1,000 liver cells.
Statistical analysis
Statistical analyses were performed by using IBM SPSS ver. 27.0 (IBM, Armonk, NT, USA) unless otherwise specified. Continuous variables were logarithmic transformed and compared using the Mann-Whitney U test. Related variables were compared by using the Wilcoxon signed rank test. For variables that showed statistical significance at comparison, area under receiver operating curve (AUROC) analysis was performed to assess the overall prediction accuracy. The optimal cut-off values for predicting FHR were derived by maximizing the Youden’s index (sensitivity + specificity − 1) from the AUROC analysis. The time-dependent AUROC was estimated by Inverse Probability of Censoring via package “timeROC” in R (version 4.1.2). To determine whether a biomarker profile was independently associated with FHR, multivariate binary logistic regression was performed using variables that were significant at univariate analysis, with odds ratio (OR) and 95% confidence interval (95% CI) calculated. Time-to-event analysis by Cox regression was performed on the entire cohort after excluding patients with undetectable baseline pgRNA or HBcrAg, with results expressed in hazard ratio (HR) and 95% CI. We were able to determine the time of HBsAg seroclearance from the cohort. For patients who remained HBsAg+ but achieved quantitative HBsAg (qHBsAg) <100 at EOFU, longitudinal qHBsAg data was not available; therefore the time of achieving the ‘event’ was arbitrarily taken as the time of last FU for these low qHBsAg patients. Kaplan-Meier survival analysis was performed to compare the probability of FHR in pre-defined groups, with differences tested for statistical significance by log rank test. A two-tailed P<0.05 was considered statistically significant.
RESULTS
Baseline characteristics
A total of 64 patients (71.9% male) were recruited for analysis. At baseline, i.e., NA initiation, the median age of the cohort was 38.2 (interquartile range [IQR], 29.4–47.2) years, with 28 (43.75%) being HBeAg-positive. The median HBcrAg, HBV pgRNA, HBV DNA and HBsAg were 3.54 log U/mL (IQR, 2.3–4.78), 4.00 log copies/mL (IQR, 2.98–4.88), 6.60 log IU/mL (IQR, 5.84–8.24), and 3.48 log U/mL (IQR, 2.89–3.77), respectively. The median total intrahepatic HBV DNA and cccDNA were 140.5 and 3.37 copies/cell, respectively. The frequency of HBV DNA integration per 1,000 liver cells was 0.94 (IQR, 0.51–2.24) (Table 1). Six patients had undetectable serum HBV pgRNA at baseline (HBeAg-positive, 1; HBeAg-negative, 5) and 12 HBeAg-negative patients had undetectable serum HBcrAg at baseline. Among these 12 patients with undetectable serum HBcrAg, four also had undetectable serum HBV pgRNA (Supplementary Table 1).
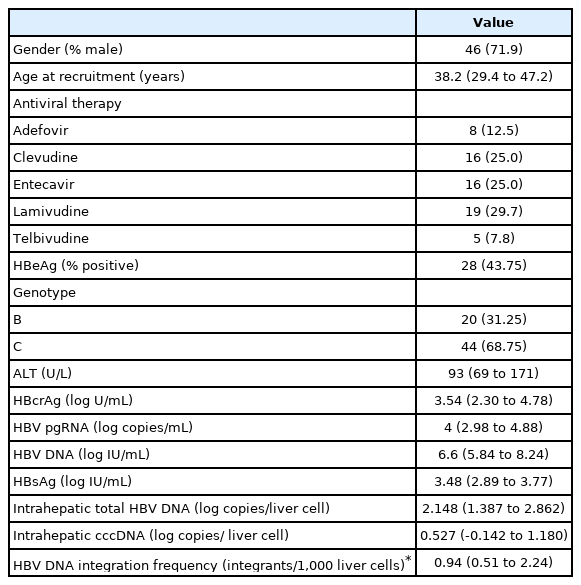
Baseline characteristics (n=64)
The median duration from start of NA to EOFU was 17.1 (IQR, 12.8–18.2) years. At EOFU, 22/64 patients (34.4%) achieved FHR, including eight patients with HBsAg seroclearance (median duration from NA, 11.9 years [IQR, 3.97–15.96]), and 14 patients with HBsAg ≤100 IU/mL. No significant differences in achieving FHR were observed between ETV-treated and non-ETV-treated patients (43.8% vs. 31.3%, P=0.269). Since the levels of HBV biomarkers are highly dependent on HBeAg status [19,34,41], analyses were performed in HBeAg-positive and HBeAg-negative patients separately.
HBeAg-positive patients
Kinetics of viral markers during initial 48 weeks of NA therapy
At baseline, median serum HBV pgRNA was 3 logs lower than HBV DNA level (4.92 log copies/mL vs. 8.13 log IU/mL, respectively). After 4 weeks of NA, both markers were reduced but a bigger decline was observed for HBV DNA compared to HBV pgRNA, leading to narrowing of the gap between the two markers (4.10 log copies/mL for HBV pgRNA vs. 4.33 log IU/mL for HBV DNA). At week 12, HBV pgRNA caught up with the level of HBV DNA (3.01 log copies/mL vs. 3.07 log IU/mL, respectively) and after which the relationship reversed that serum pgRNA levels were higher than HBV DNA levels at week 24 (2.61 log copies/mL vs. 2.22 log IU/mL, respectively) and week 36 (2.54 log copies/mL vs. 1.83 log IU/mL, respectively). At week 48, the median serum levels of both markers were undetectable. Overall, there was a gradual reduction of median serum HBcrAg level except with two blips at week 12 and week 36. At week 48, there was a 5.15 log U/mL reduction of serum HBcrAg from baseline, and was still detectable at a median level of 3.04 log U/mL (Fig. 1A, Supplementary Table 2).

Median levels of HBV pgRNA, HBV DNA and HBcrAg during initial 48 weeks of nucleos(t)ide analogues therapy. Lower limit of quantification for HBV pgRNA = 10 copies/mL (i.e., 1 log10 copies/mL); lower limit of detection for HBV DNA = 20 IU/mL (i.e., 3 log10 IU/mL); lower limit of detection for HBcrAg = 100 U/mL (i.e., 2 log10 U/mL). (A) HBeAg-positive patients. (B) HBeAg-negative patients. HBeAg, hepatitis B e antigen; pgRNA, pre-gen/omic RNA; HBV, hepatitis B virus; HBcrAg, hepatitis B core-related antigen.
Kinetics of viral markers in FHR vs. non-FHR
Among 28 HBeAg-positive patients, 26 patients (92.9%) achieved HBeAg seroclearance as of EOFU. Six of the 28 patients (21.4%) achieved FHR at EOFU (three achieved HBsAg seroclearance and the other three had HBsAg level ≤100 IU/mL). There were no statistical differences in the baseline demographics including age and gender, the duration of follow-up as well as the median levels of HBcrAg, HBV DNA and HBsAg. Notably, patients with FHR had a higher baseline median HBV pgRNA level compared with patients with non-FHR. All these parameters at baseline and during the initial 48 weeks of NA therapy are shown in Supplementary Table 3. Supplementary Figure 1A, B shows the levels of HBcrAg and HBV pgRNA at each time point.
Association between early on-treatment changes of serum viral markers and FHR
One patient with baseline undetectable serum HBV pgRNA was excluded from the individual biomarker analysis. Compared to non-FHR, FHR patients had higher median decline in most serum HBV markers including HBcrAg, pgRNA and HBV DNA at all the time points measured during the first year of NA treatment (Table 2). These differences reached statistically significant level at all treatment time points throughout for pgRNA. Importantly, pgRNA decline was significantly greater in FHR patients compared to non-FHR patients starting as early as week 4 (5.49 vs. 4.32 log copies/mL decline, P=0.016) (Table 2, Fig. 2A) despite a higher median HBV pgRNA level at baseline (5.63 vs. 4.43 log copies/mL, P=0.024) (Supplementary Table 3).
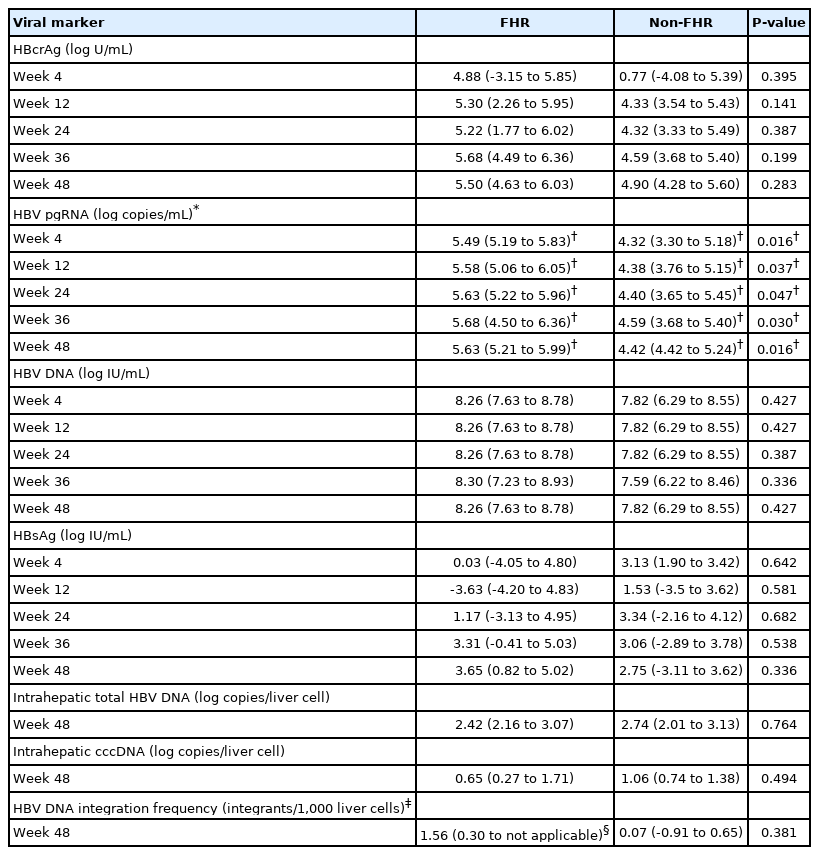
Median reduction in serum and intrahepatic viral markers at different time points during initial 48 weeks of NA therapy among initially HBeAg-positive patients

Median log reduction of HBcrAg and HBV pgRNA in (A) initially HBeAg-positive and (B) initially HBeAg-negative patients during initial 48 weeks of nucleos(t)ide analogues. HBcrAg, hepatitis B core-related antigen; HBV, hepatitis B virus; FHR, favourable hepatitis B surface antigen response; HBeAg, hepatitis B e antigen; pgRNA, pre-genomic RNA. *Denotes statistical significance between the two groups at specified time point. †Excluded 1 patient with undetecatable baseline HBV pgRNA. ‡Excluded 12 patients with undetectable baseline HBcrAg. §Excluded 5 patients with undetectable baseline HBV pgRNA.
ROC analysis was performed to assess the performance characteristics of decline in serum HBV pgRNA at various time points to predict FHR at EOFU. The AUROC values were highest and identical for week 4 and week 48 decline, both being 0.825 (95% CI, 0.661–0.989, P<0.001) (Supplementary Table 4). For week 4 decline in serum pgRNA, adopting the Youden’s index to identify the cut-off level of ≥5.32 log copies/mL reduction, the sensitivity and specificity for FHR at EOFU were 83.3% and 85%, respectively. Using the cut-off of ≥5.32 log copies/mL drop at week 4, 62.5% patients developed FHR compared to 5.6% remaining patients (P=0.004). For week 48 decline in serum pgRNA, using a cut-off level of >5.31 log copies/mL reduction, the sensitivity and specificity for FHR at EOFU were 83.3% and 85%, respectively. Using the cut-off of ≥5.31 log copies/mL drop at week 48, 62.5% patients developed FHR compared to 5.6% remaining patients (P=0.004). Time-dependent AUROC was performed on for week 4, 12, 24, 36, and 48 drop of HBV pgRNA and the results are shown in Supplementary Table 5.
Intrahepatic viral markers and FHR
The levels of intrahepatic total HBV DNA, cccDNA and the frequency of HBV DNA integration at baseline were not significantly different between FHR and non-FHR patients (Supplementary Table 3). For all HBeAg-positive patients, upon 48 weeks of NA therapy, the median level of cccDNA reduced from 1.096 to 0.005 log copies per cell (P<0.001), while that for intrahepatic total HBV DNA reduced from 2.648 to 0.554 log copies per cell (P<0.001). The frequency of HBV integration decreased from 3.96 (IQR, 0.82–NA) at week 0 to 2.40 (0.52–NA) integrants/1,000 liver cells at week 48 for FHR group (P=0.18), compared to 1.48 (IQR, 0.82–2.00) to 1.10 (0.52–2.49) integrants/1,000 liver cells for non-FHR group (P=0.31). No significant differences in the degree of decline in intrahepatic viral markers or HBV DNA integration frequency were observed between FHR and non-FHR patients (Table 2).
HBeAg-negative patients
Kinetics of viral markers during initial 48 weeks of NA therapy
At baseline, median serum HBV pgRNA was 3 log lower than HBV DNA level (3.34 log copies/mL vs. 6.20 log IU/mL, respectively). At week 12, the median serum levels of HBV pgRNA, HBV DNA and HBcrAg were undetectable (Fig. 1B, Supplementary Table 2).
Kinetics of viral markers in FHR vs. non-FHR
Among 36 HBeAg-negative patients, 16 patients (44.4%) achieved FHR at EOFU (five achieved HBsAg seroclearance and the other 11 had HBsAg level ≤100 IU/mL). The baseline characteristics of patients and the median levels of HBcrAg, HBV pgRNA, HBV DNA and HBsAg during the initial 48 weeks of NA therapy were compared between FHR and non-FHR patients and shown in Supplementary Table 6. Patients who achieved FHR were significantly younger at baseline (41.5 vs. 46.4 years old, P=0.026) and had longer duration of follow-up (18.1 vs. 13.1 years, P=0.033) compared to non-FHR patients (Supplementary Table 6). Supplementary Figure 1C, D shows the levels of HBcrAg and HBV pgRNA at each time point.
Association between early on-treatment changes of serum viral markers and FHR
Patients with baseline undetectable serum viral biomarker (5/36 for HBV pgRNA and 12/36 for HBcrAg) were excluded from the individual biomarker analysis. Compared to non-FHR patients, FHR patients had median reduction in HBcrAg at week 4 (increment of 1.75 vs. reduction of 2.98 log U/mL; P=0.023) (Fig. 2B). There were no significant differences in the median log reduction for HBV pgRNA, HBV DNA and HBsAg (Table 3).
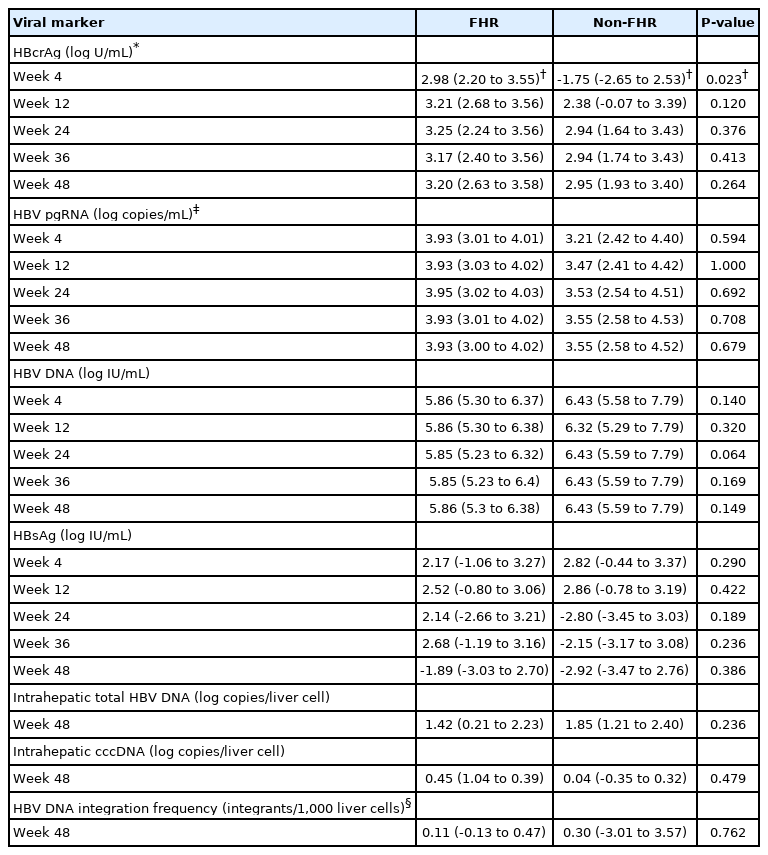
Median reduction in serum and intrahepatic viral markers at different time points during initial 48 weeks of NA therapy among initially HBeAg-negative patients
ROC analysis was performed to assess the performance characteristics of week 4 change in serum HBcrAg to predict FHR at EOFU. The AUROC is 0.789 (95% CI, 0.596–0.982; P=0.003). Using a cut-off level of ≥2.05 log U/mL decline, the sensitivity and specificity for FHR at EOFU were 75% and 62.5%, respectively. Using the cut-off of ≥2.05 log U/mL decline in HBcrAg at week 4, 63.6% patients developed FHR compared to 7.7% remaining patients. Binary logistic regression inputting the factors of age, duration of follow-up and week 4 HBcrAg decline showed that only week 4 HBcrAg decline of ≥2.05 log U/mL remained significantly associated with FHR at EOFU (OR, 16.919; 95% CI, 11.245–229.964; P=0.034).
Intrahepatic viral markers and FHR
The levels of intrahepatic total HBV DNA, cccDNA and the frequency of HBV DNA integration at baseline were not significantly different between FHR and non-FHR patients (Supplementary Table 6). For all HBeAg-negative patients, upon 48 weeks of NA therapy, the median level of cccDNA reduced from 0.041 to -0.832 log copies per cell (P<0.001), while that for intrahepatic total HBV DNA reduced from 1.792 to 0.114 log copies per cell (P<0.001). The frequency of HBV integration was 0.71 (IQR, 0.41–1.86) at week 0 and 0.70 (0.34–1.50) integrants/1,000 liver cells at week 48 for FHR group; P=0.46, whereas for non-FHR group the integration frequency non-significantly increased from 1.60 (IQR, 0.32–4.48) to 2.15 (0.08–4.10) integrants/1,000 liver cells; P=0.60. No significant differences in the degree of decline in both intrahepatic viral markers or the frequency of HBV DNA integration were observed between FHR and non-FHR patients (Table 3).
Serum HBV markers and cccDNA reduction
We analysed the decline of various serum HBV biomarkers with respect to cccDNA reduction at week 48. As it was previously reported that the magnitude of cccDNA decline after 1 year of antiviral therapy was about 1 log copy/cell [42], we performed subgroup analysis for patients with ≥1 log copy/cell reduction (n=17) vs. <1 log copy/cell reduction (n=47) of cccDNA at 48 weeks of NA. Compared to patients with <1 log decline of cccDNA, patients with ≥1 log decline of ccDNA had significantly bigger reductions in serum HBV RNA (week 12, 24, and 48), HBcrAg (week 12, 24, 36, and 48) and HBV DNA (week 4, 12, 24, 36, and 48) (Table 4).
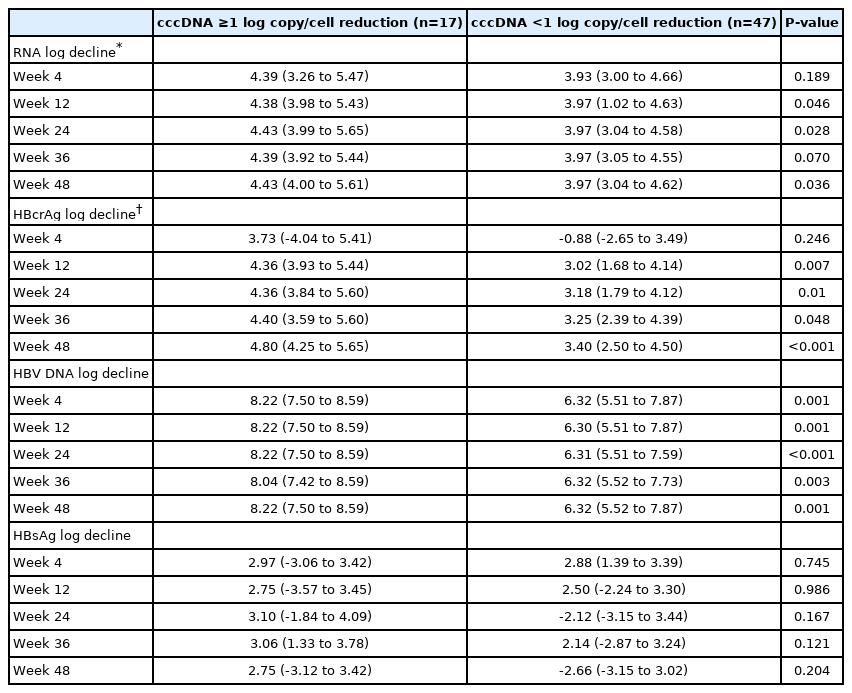
Differential reductions of serum viral markers at week 48 with respect to cccDNA decline
Composite endpoint and time-to-event analysis
A composite variable ‘week 4 biomarker response’ consisting of either week 4 pgRNA decline ≥5.32 log copies/mL for HBeAg+ or week 4 HBcrAg decline ≥2.05 log U/mL for HBeAg- was computed into the analysis. The result showed that ‘week 4 biomarker response’ was significantly associated with FHR (HR, 10.378; 95% CI, 2.312–46.589; P=0.002) (Fig. 3).
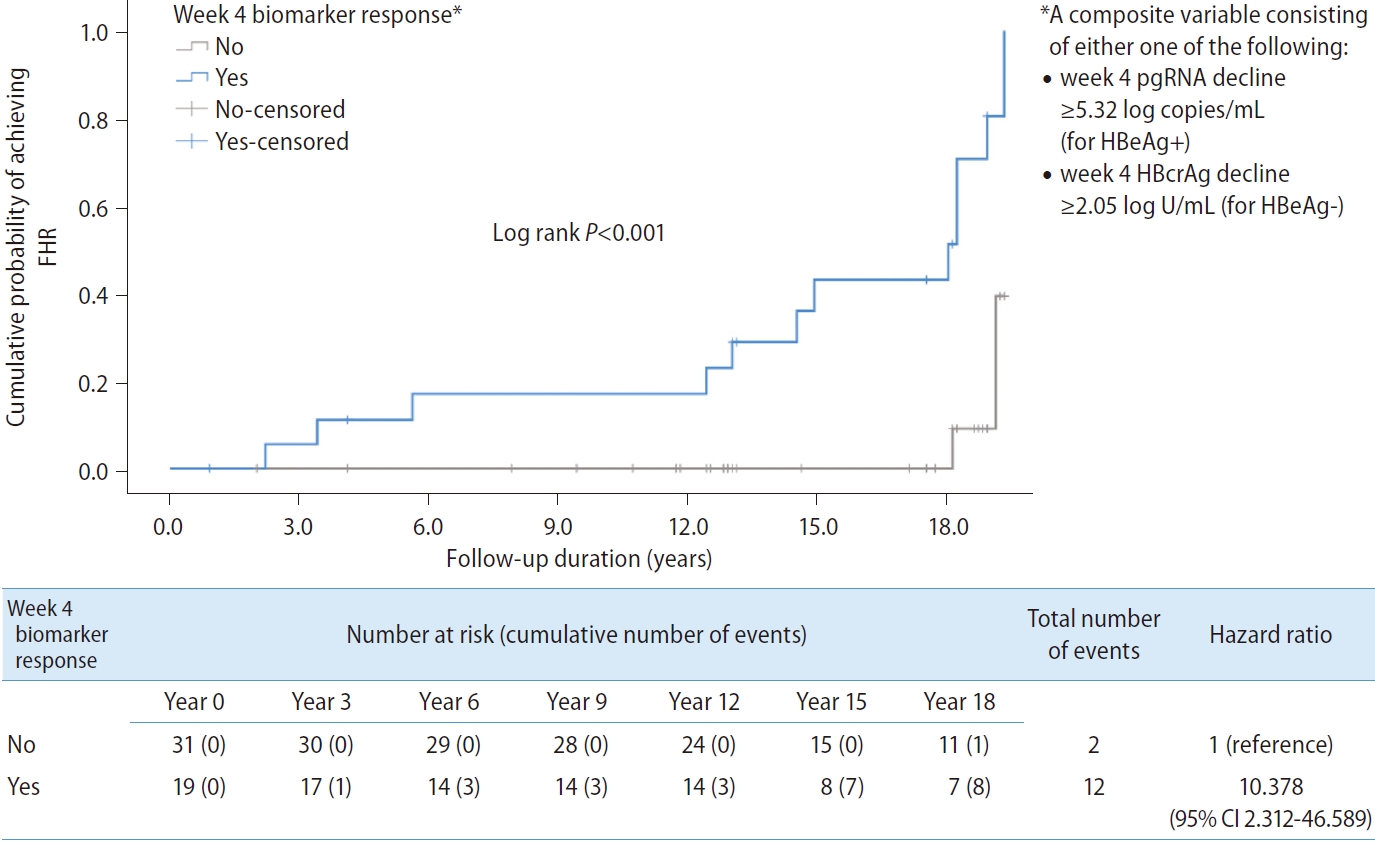
Kaplan-Meier analysis and Cox regression comparing patients who achieved the composite endpoint (defined as either week 4 pgRNA decline ≥5.32 log copies/mL for HBeAg-positive patients, or week 4 HBcrAg decline ≥2.05 log U/mL for HBeAg-negative patients) during early phase of nucleos(t)ide analogues. FHR, favourable hepatitis B surface antigen response; pgRNA, pre-genomic RNA; HBeAg, hepatitis B e antigen; HBcrAg, hepatitis B core-related antigen; CI, confidence interval.
DISCUSSION
Functional cure is a desirable endpoint yet a rare occurrence in CHB patients on long-term NA therapy. The ‘stop-to-cure’ approach has been adopted to induce host immunity triggered by recurrence of HBV replication. The probability of NA cessation-induced functional cure is increased if cccDNA transcriptional activity has been silenced to some degree during treatment [43]. The end-of-treatment viral biomarkers including HBsAg and HBV pgRNA have been reported to predict post NA-cessation virological flare [44,45]. Importantly, the end-of-treatment HBsAg titre is a crucial factor that determines the fate after antiviral therapy cessation. In this study, we studied the early on-treatment viral markers in a group of CHB patients who were started on NA with long-term follow-up. We found that among those who achieved HBsAg seroclearance or low HBsAg (≤100 IU/mL) after on NA >10 years, the early on-treatment changes in serum viral biomarkers were significantly different compared to those who did not achieve a low HBsAg level. Specifically, for HBeAg-positive patients, all viral biomarkers (except HBsAg) showed the same trend (albeit statistically insignificant for HBV DNA and HBcrAg) that a bigger decline in the individual biomarkers were observed in FHR patients compared to non-FHR. Importantly, serum HBV pgRNA was the most useful in detecting early on-treatment differences – a high statistical power was observed despite a limited number of patients were included. For HBeAg-negative patients, both serum HBcrAg and HBV pgRNA showed similar pattern that a bigger decline in the individual biomarkers were observed in FHR patients compared to non-FHR. Due to the fact that a sizable proportion of HBeAg-negative patients had undetectable HBcrAg (12/36, 33.3%) or HBV pgRNA (5/36, 13.9%) at baseline, the statistical power of these serum biomarkers was further reduced. Nevertheless, this is the first study to describe the role of early on-treatment viral markers in prediction of favourable HBsAg suppression in NA-treated CHB patients.
In HBeAg-negative patients, we noted that those who achieved FHR were significantly younger at baseline and had longer duration of follow-up compared to patients who did not achieve FHR. It is unknown whether initiating NA at an earlier age is associated with higher chance of HBsAg seroclearance. Also, extension of follow-up duration would potentially identify more cases with HBsAg seroclearance. We additionally performed multivariate analysis which showed that the week 4 decline in HBcrAg was the only significant factor associated with FHR among HBeAg-negative patients (Supplementary Table 7).
Among the four serum biomarkers, HBsAg levels were the least suppressed by NA (Table 2, Supplementary Table 2). Because HBsAg is not a direct target of NAs and that it can be expressed from integrated HBV DNA [46], the decline of HBsAg by NAs is often very small [14,47]. Therefore, HBsAg remained relatively static (3–4 logs for HBeAg-positive and 2–3 logs for HBeAg-negative patients) during the initial 48 weeks of NA therapy in contrast to the substantial reduction in serum HBV DNA (direct target of NA), HBcrAg and HBV pgRNA (both are surrogate markers of cccDNA transcriptional activity). Also, while the differential reductions of other three markers (HBV pgRNA, HBcrAg and HBV DNA) were reflective of whether cccDNA was suppressed effectively, HBsAg levels did not show similar trends (Table 4). Therefore, early on-treatment HBsAg kinetics could not predict subsequent levels upon long-term NA nor the degree of cccDNA suppression.
Intrahepatic viral markers were significantly suppressed upon initial 48 weeks of NA therapy and was consistent with other reports in the literature [33,48]. In contrast to serum biomarkers, the dynamics of intrahepatic total HBV DNA or cccDNA during initial 48 weeks of NA were not predictive of FHR. It was previously reported that most patients develop virological rebound despite undetectable cccDNA after >10 years of NA [49]. It is tempting to speculate that what matters most is the degree of cccDNA silencing, instead of the absolute amount of viral template that is still present, that determines the ultimate fate of whether NA can be used in a finite manner. In turn, the degree of cccDNA silencing can be reflected by the magnitude of reduction of serum viral biomarkers, namely HBcrAg or HBV pgRNA, during the course of NA. The fact that the rapid reduction of these biomarkers as early as week 4 might indicate a high degree of cccDNA silencing which was clinically translated into a long term favourable HBsAg response to NA (Fig. 4). Achieving HBsAg ≤100 IU/mL is the pre-requisite for consideration of stopping NA and is expected to have favourable rate of subsequent HBsAg seroclearance. However, our study cannot address whether early biomarker response can help to predict successful off-NA virological control. We propose that for subjects without week 4 biomarker response—indicating a low chance of achieving functional cure or a low HBsAg titre by long-term NA alone—NA should be continued and they should be prioritized for clinical trials with novel anti-HBV therapies within the HBV functional cure program (Fig. 4) [50]. Currently, many trials that are designed for NA-treated CHB patients would like to consider qHBsAg and/or HBV DNA as the inclusion criteria [51-53], while the role of other biomarkers is seldom explored. Early on-NA biomarker response will help to identify patients potentially eligible for clinical trials who would otherwise be embarked on indefinite duration of NA therapy. Of note, a high frequency of HBV DNA integration events at baseline was observed in both HBeAg-positive and HBeAg-negative patients. FHR was found to be independent of the degree of HBV DNA integration at baseline. Our group previously reported that HBV DNA integration frequency significantly decreased after long-term NA >10 years [54]. It will be worth investigating whether the reduction in HBV DNA integration is associated with FHR after long-term NA therapy.

Schematic diagram illustrating the relationship between NA-induced cccDNA silencing and long-term effects on HBsAg suppression. During early phase of NA therapy, HBsAg levels remain relatively static despite marked reduction in transcriptional activity as reflected by early biomarker response (i.e., week 4 HBV pgRNA and HBcrAg). The long-term effects of NA on HBsAg production can potentially be predicted using early changes in serum viral biomarkers. HBsAg, hepatitis B surface antigen; HBV, hepatitis B virus; cccDNA, covalently closed circular DNA; pgRNA, pre-genomic RNA; HBcrAg, hepatitis B core-related antigen. *Week 4 biomarker response: a composite variable consisting of either one of the following: 1) week 4 pgRNA decline ≥5.32 log copies/mL (for HBeAg+) and 2) week 4 HBcrAg decline ≥2.05 log U/mL (for HBeAg-).
In the six patients with baseline undetectable HBV pgRNA, four had undetectable HBcrAg, while the HBcrAg levels were 3.07 and 5.63 log U/mL for the remaining two patients. The serum HBV DNA was 2.82, 5.23, 5.85, 6.46, 7.99, and 8.32 log IU/mL for these six patients (Supplementary Table 1). This RNA-DNA dissociation was mainly observed in HBeAg-negative patients. The use of serum viral biomarkers especially HBV pgRNA to predict FHR would therefore be more useful in HBeAg-positive patients. Assays with higher sensitivity, i.e., lower limits of detection are likely helpful to quantify the serum viral biomarkers in HBeAg-negative patients. There are a few potential reasons for the observed difference in roles for HBV pgRNA and HBcrAg in predicting FHR in HBeAg-positive and HBeAg-negative patients, respectively. Firstly, because HBeAg is part of the HBcrAg protein, HBeAg expression might have outnumbered HBcrAg expression in the blood for HBeAg-positive patients. Secondly, although both HBV pgRNA and HBcrAg come from cccDNA, their mechanisms of production are slightly different. The production of HBV pgRNA reflects the transcriptional activity, while the production of HBcrAg is affected by both transcription and post-transcriptional (e.g., translational) regulation. Although it is just a speculation, it is possible that different translation efficiencies of HBcrAg exist between HBeAg-positive and HBeAg-negative patients. Thirdly, the small sample size of this study might have masked any true predictive power of either biomarker in patients with different HBeAg status.
The present study has a few limitations. First, we did not have serial blood stored after 48 weeks of NA to study the longitudinal changes of viral biomarkers. Data from previous reports (NA up to 5 years) showed that HBcrAg and HBV pgRNA will continue to decline with increasing duration of therapy [19,45]. Second, the limit in the amount of available liver tissues precluded the measurement of intrahepatic HBV pgRNA levels, which would have provided a more comprehensive picture of the impact of NAs on intrahepatic HBV replication. Third, this study is limited to only patients with HBV genotypes B and C and is limited by a small number of patients with available serum and liver biopsies. Besides, the statistical comparisons were limited to non-parametric tests between FHR and non-FHR groups due to multi-collinearity of the biomarkers at different time points. Theoretically, a one-off measurement (instead of multiple timepoints) of biomarker in the early phase of NA might be sufficient to compare the change from baseline and decide if a patient would likely achieve FHR or not in the long run. Therefore, these findings need to be validated by future studies with larger sample size. Lastly, the present study employed only an IA for serum HBV pgRNA measurement, as a standardized serum HBV pgRNA assay is not available at present. Although there is lack of data concerning the stability of serum samples for HBV pgRNA analysis upon long-term storage, previous studies have demonstrated feasibility of this approach [19,36], which is further supported by the overall pattern of pgRNA mirroring that of serum HBV DNA in the current study (Fig. 1). Future studies addressing these technical issues would be helpful to improve utilization of pgRNA assays.
In conclusion, this study demonstrated that early on-treatment viral biomarkers (HBV pgRNA or HBcrAg) can potentially predict low/ undetectable HBsAg after long-term NA therapy. Patients without early biomarker response likely need indefinite duration of NA therapy, therefore should be prioritized for enrolment into clinical trials.
SUPPLEMENTARY MATERIAL
Supplementary material is available at Clinical and Molecular Hepatology website http://www.e-cmh.org.
Profile of viral biomarkers at baseline and outcome among patients with undetectable baseline serum HBcrAg or HBV pgRNA
Median log values of serum viral markers at different timep oint during initial 48 weeks of nucleos(t)ide analogues
Baseline characteristics and median log values of serum and intrahepatic viral markers at different time point during initial 48 weeks of NA among initially HBeAg-positive patients
Results of AUROC analysis on the performance of serum HBV pgRNA decline in prediction of FHR in initially HBeAg-positive patients
Time-dependent AUROC analysis for log reductions of HBV pgRNA at different timepoints in predicting FHR among initially HBeAg-positive patients
Baseline characteristics and median log values of serum and intrahepatic viral markers at different time point during initial 48 weeks of NA among initially HBeAg-negative patients
Binary logistic regression for factors associated with FHR for initially HBeAg-negative patients
Box-plot showing levels of HBcrAg and HBV pgRNA at different time points in nucleos(t)ide analogues-treated patients achieving FHR vs. non-FHR. (A) HBcrAg in HBeAg-positive patients; (B) HBV pgRNA in HBeAg-positive patients; (C) HBcrAg in HBeAgnegative patients; and (D) HBV pgRNA in HBeAg-negative patients. Bars represent interquartile range, while whiskers represent 95% confidence interval. HBcrAg, hepatitis B core-related antigen; HBeAg, hepatitis B e antigen; FHR, favourable hepatitis B surface antigen response; HBV, hepatitis B virus; pgRNA, pre-genomic RNA.
Notes
Authors’ contribution
LYM and DW were responsible for data collection, data analysis and drafting of the manuscript. AK, MH, AH, NC and XM were responsible for data analysis, data interpretation, and critical revision of the article. WKS and MFY were responsible for conception of the work and critical approval of the article.
Conflicts of Interest
D Wong received speaker’s fees from Abbott Laboratories. A Kuchta and A Hamilton are employees of Roche Molecular Diagnostics. M Hilfiker is an employee of Roche Diagnostics Int. AG. WK Seto received speaker’s fees from AstraZeneca and Mylan, is an advisory board member of CSL Behring, is an advisory board member and received speaker’s fees from AbbVie, and is an advisory board member, received speaker’s fees and researching funding from Gilead Sciences. MF Yuen serves as advisor/consultant for AbbVie, Assembly Biosciences, Aligos Therapeutics, Arbutus Biopharma, Bristol Myer Squibb, Clear B Therapeutics, Dicerna Pharmaceuticals, Finch Therapeutics, GlaxoSmithKline, Gilead Sciences, Immunocore, Janssen, Merck Sharp and Dohme, Hoffmann-La Roche and Springbank Pharmaceuticals, Vir Biotechnology and receives grant/research support from Assembly Biosciences, Aligos Therapeutics, Arrowhead Pharmaceuticals, Bristol Myer Squibb, Fujirebio Incorporation, Gilead Sciences, Immunocore, Merck Sharp and Dohme, Hoffmann-La Roche, Springbank Pharmaceuticals and Sysmex Corporation. The remaining authors have no conflict of interests.
Acknowledgements
This study was supported by the General Research Fund, Research Grants Council, The Government of the Hong Kong Special Administrative Region (ref no: 17108921). HBV pgRNA and HBcrAg measurements are provided by Roche Molecular Systems, Inc. and Fujirebio, Inc., respectively.
Abbreviations
AUROC
area under receiver operating curve
cccDNA
covalently closed circular DNA
CHB
chronic hepatitis B
CI
confidence interval
EOFU
end of follow-up
FHR
favourable HBsAg response
HBcrAg
hepatitis B core-related antigen
HBeAg
hepatitis B e antigen
HBsAg
hepatitis B surface antigen
HBV
hepatitis B virus
HR
hazard ratio
IA
investigational assay
IQR
interquartile range
LLOD
lower limit of detection
NAs
nucleos(t)ide analogues
NCBI
National Center for Biotechnology Information
OR
odds ratio
PCR
polymerase chain reaction
pgRNA
pre-genomic RNA
qHBsAg
quantitative HBsAg
References
Article information Continued
Notes
Study Highlights
• Early on-treatment HBcrAg and HBV pgRNA showed differential rate of decline between those who achieved favourable HBsAg suppression and those who did not.
• Among those who achieved HBsAg seroclearance or low HBsAg after on antiviral therapy >10 years, week 4 HBV pgRNA or HBcrAg decline were strong predictors (AUROC 0.825 and 0.789, respectively).
• Intrahepatic cccDNA or total HBV DNA decline were not associated with favourable HBsAg suppression.
• Serum pgRNA and HBcrAg allowed the prediction of indefinite duration of therapy in patients put on NAs who should be prioritized for enrolment into clinical trials.