Effects of different exercise modalities on novel hepatic steatosis indices in overweight women with type 2 diabetes
Article information

Abstract
Background/Aims
Fatty liver is a clinical and pathologic condition in individuals with type 2 diabetes (T2D). The purpose of this study is to examine the effects of different exercise modalities on non-alcoholic fatty liver indices (fatty liver index [FLI], lipid accumulation product [LAP], hepatic steatosis index [HSI], and Framingham Steatosis Index [FSI]) in women with T2D.
Methods
Fifty-two women with T2D and a mean age of 55.07±5.92 yrs, body mass index (BMI) 28.94±4.09 kg/m2 , and hemoglobin A1c (HbA1c) 9.41±0.82% were randomized to a sprint interval training (SIT) (n=17), combined aerobic and resistance (A+R) training (n=17), or control group (n=18) for 10 weeks. Two-way repeated analysis of variance (ANOVA) was used to find differences between groups and the effects of time and Time×Group interactions after 10 weeks on non-alcoholic fatty liver indices. After this, ANOVA models were constructed to determine the effects of group allocation and change in non-alcoholic fatty liver indices.
Results
There were significant time interactions for FLI (P<0.001), HSI (P<0.001), and LAP (P<0.001). Also, there were significant Time×Group interactions for fasting blood glucose (P=0.034), and HbA1c (P=0.006).
Conclusions
Results highlight that exercise training, independent of mode of training, is an effective strategy to improve some indices related to hepatic steatosis and blood glucose profiles in women with T2D.
INTRODUCTION
Type 2 diabetes (T2D) is characterized by abnormal adipose tissue distribution and fat accumulation in the form of triglycerides in non-adipose tissues such as liver, skeletal muscle, heart and intra-abdomen [1].
Accumulation of fat in the liver is a very clinical and pathologic condition in individuals with T2D [2]. More than 80% of T2D patients have fatty liver [3] and it has been shown that chronic liver complications are a major cause of mortality in patients with T2D [4].
Many studies has been done to identify a large number of novel biomarkers, for predicting the hepatic steatosis and monitor responses to therapies [5,6]. A majority of clinical techniques have been used for non-alcoholic fatty liver disease (NAFLD) diagnosis are time-consuming, often very expensive and unavailable in many laboratories [7,8]. Recently, more simple risk prediction equations such as; fatty liver index (FLI), lipid accumulation product (LAP), hepatic steatosis index (HSI) and Framingham Steatosis Index (FSI) which are useful in primary prediction of hepatic disease have been developed [8-11].
It has been shown that exercise, medications and diet have changed the liver fat profile in individuals at risk of T2D [12]. Interestingly, exercise has been used as an important management strategy in this cohort [13]. It has been shown that FLI scores of 60 and above (>60) indicate as having NAFLD [14].
In addition, some studies have reported the effect of vigorous exercise training interventions in reducing fatty liver and hepatic steatosis in T2D [15-17]. However, there is a lack of information about FLI, LAP, HSI and FSI and exercise training in individuals with T2D. We hypothesized that sprint interval training (SIT) and aerobic and resistance (A+R) modalities reduce the level of these novel hepatic steatosis indices compared to control group in women with T2D.
MATERIALS AND METHODS
Study design
We conducted a 10-week single-blind randomized controlled trial (Iranian Registry of Clinical Trials [IRCT], trial registration number: IRCT 20141118019995N10; http://www.irct.ir/trial/17753) on the basis of the Consolidated Standards of Reporting Trials (CONSORT) Statement [18]. The study was approved by Shahrekord University Research Ethics Committee (Code No: SKU-94-210) on 30/01/2016. All participants provided written informed consent.
Participants and enrolment process
Participants were recruited from patients registered in the outpatient department of Shahrekord Hospital (Shahrekord, Iran). Inclusion criteria were: women, T2D, age 30–65 yrs, 48 kg/m2 >body mass index (BMI)>25 kg/m2, hemoglobin A1c (HbA1c) ≥6.5% (48 mmol/mol), fasting blood glucose (FBG) ≥126 mg/dL (7.0 mmol/L) and sedentary lifestyle. Sedentary was defined as no more than 20 minutes structured exercise of any type per week over the past 6 months or any level of SIT. Participants were excluded if they had resting blood pressure ≥160/100 mmHg, fasting triglyceride ≥5.7 mmol/L, a history of cardiovascular disease, thyroid disorder, cancer, endocrine disorder other than diabetes, servere kidney or servere liver disease (a history of acute/chronic hepatitis, drug-related liver diseases/steatosis, chronic hepatitis B and C, and autoimmune hepatitis), surgery, smoking or using recreational drugs or any alcohol.
After recruitment, among 150 registered women with diabetes type 2 only 52 patients met the all inclusion/exclusion criteria (Fig. 1). Eligible subjects were explained about the study protocol and were informed about the possible risks and benefits involved in the study both verbally and in writing. They were assured that all answers would be kept strictly confidential.
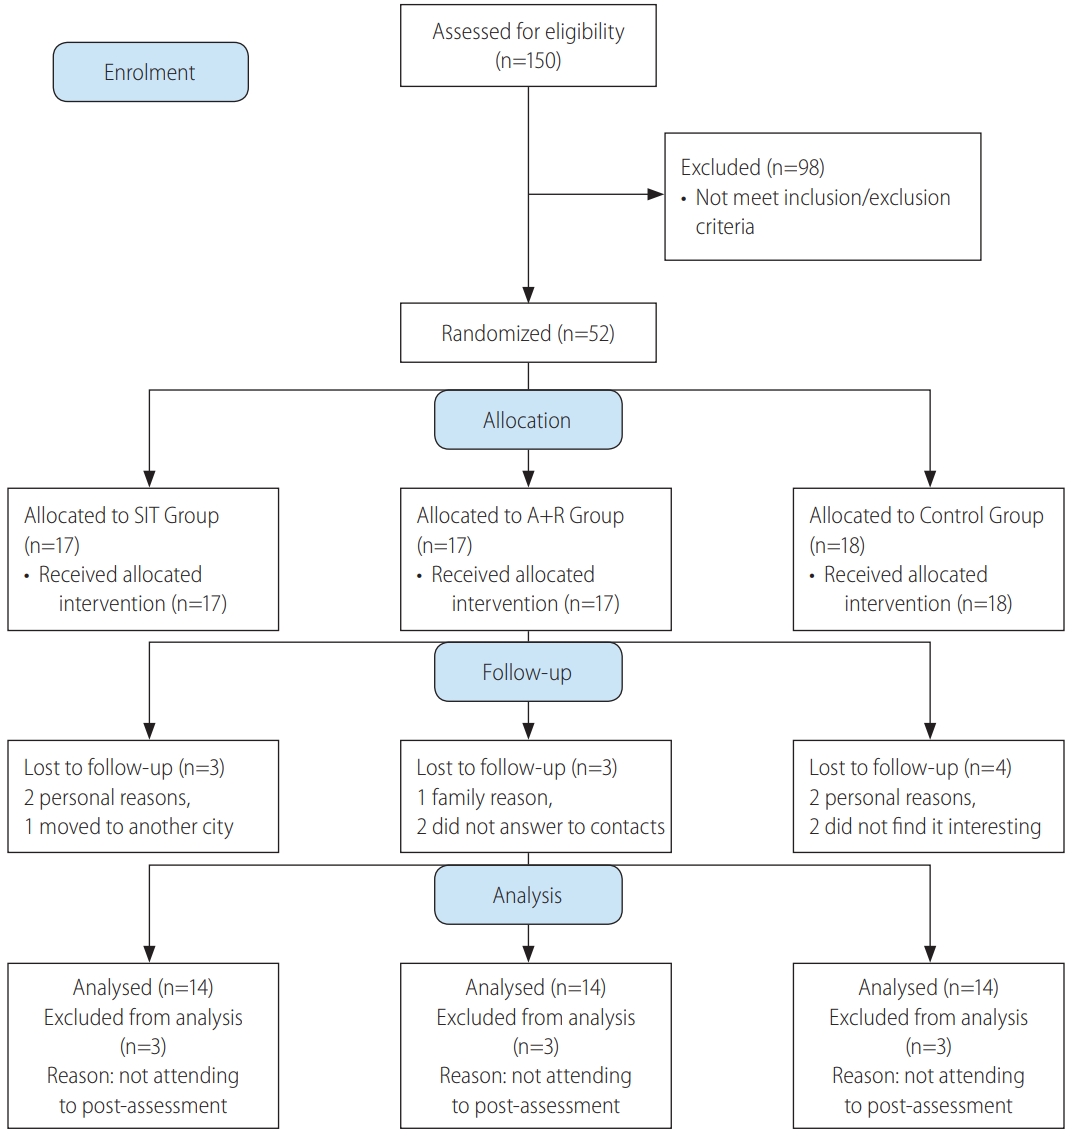
CONSORT 2010 flow diagram study of effects of different exercise modalities. SIT, sprint interval training; A+R, aerobic and resistance.
The patients were randomized through block allocation with a block size of 6 by a research assistant who was not involved in this research by using a computer-generated random number sequence. Participants were stratified according to two cut-offs for each stratification of age (30–50 or 51–60 yrs), BMI (25–35 or 36–48 kg/m2) and HbA1c (6.5–8.5% or ≥8.6%). Sequential treatment allocations were enclosed in numbered, opaque sealed envelopes, and distributed by this research assistant to each group after baseline assessment.
According to previous studies, HbA1c changes ranged in endurance training (0.30–1.50%) and resistance training (0.0–0.30%). We concluded that a minimum sample size between 20–25 will provide a statistical power 80% into the effect of SIT versus combined training clinically and can predict HbA1c difference between groups of 0.30±0.34 HbA1c units after a 10-week of training [19]. Power and sample size calculation of this study determined 17 subjects per groups based on an expected dropout rate of 20%.
The patients were randomized through block allocation with a block size of 6 by a research assistant who was not involved in this research by using a computer-generated random number sequence. Participants were stratified according to two cut-offs for each stratification of age (30–50 or 51–60 yrs), BMI (25–35 or 36–48 kg/m2) and HbA1c (6.5–8.5% or ≥8.6%). Sequential treatment allocations were enclosed in numbered, opaque sealed envelopes, and distributed by this research assistant to each group after baseline assessment. Participants were randomly assigned to SIT group (n=17), A+R group (n=17) or control group (n=18) (Fig. 1).
Exercise training protocols
Exercise interventions included a 10-week of combined training (A+R) or SIT training. Subjects exercised three times per week for 50 minutes according to American College of Sports Medicine (ACSM) guidelines [20] and training progressed in length and intensity (Table 1). Trainings were supervised by expert exercise physiologists at a clinical gym.

Exercise training interventions
Combined A+R trainings
Through aerobic training program, participants were free to exercise on a treadmill or ergometer. Aerobic training progressed from 20 min/session at 60% maximum heart rate (HR) in week 1–2 to 30 min/session at 70% Max HR in week 3–10. Hear rate monitors (Polar T31, Oy, Kempele, Finland) were used to adjust workload to achieve target HR. The aerobic training was personalized by individualized increments.
Resistance training was performed at one set of 15 max reps with 15 repetitions for the first 2 weeks. Then intensity was increased to 2–3 sets of 12 to 10 max reps with 12 to 10 repetitions between weeks 3–10 (Table 2) [21]. All resistance trainings were performed on weight machines and included bench press, leg press, bent over lateral pull down, bilateral biceps curl, and bilateral triceps push down.

Descriptive baseline characteristics of sprint interval training (SIT), combined A+R training, and control groups
SIT
The SIT training consisted of exercising on cycle ergometers (Ergomedic 894E Peak Bike, Monark EB; Varberg, Sweden). Each session consisted of a 5-minute warm-up, 4×30 seconds maximum intensity intervals at breaking wattage of the individual, and then followed by 2 minutes of recovery and 4 minutes of cooldown. Wattage adjusted upward by 10% based on performance and perceived effort in participants who completed the three intervals on the first SIT session. However, wattage was adjusted down by 10% based on the same criteria for those who were not capable of maintaining the required more than 120 rpm for any interval. In addition, during the 10 weeks of SIT, wattage was adjusted upward in 10% increments for ensuring that the maximum intensity was being exerted during each session if a patient completed three intervals maintaining more than 120 rpm on two consecutive sessions [22].
Anthropometric measures
Body fat percentage (BF %) was measured to nearest 0.5 mm at 3 sites: abdominal, thigh, and suprailiac (Lafayette Instrument Skinfold Caliper, model 01128) [23]. Height without shoes was measured using a portable stadiometer to the nearest millimeter and body mass was measured by a calibrated digital scale to the nearest 0.1 kg, BMI was calculated (kg/m2). Waist circumference was measured at the midpoint between the iliac crest and the lower rib margin and recorded to the nearest centimeter. Hip circumference was measured at the point of maximal gluteal protuberance from the lateral view to the nearest centimeter. Circumference waist of hip ratio (WHR) was calculated through dividing the waist circumference by hip circumference [24].
Blood analysis
Blood samples (10 mL) from the antecubital vein in a sitting position were collected 24 hours before exercise protocol and 48 hours after the last session of training program in 12 hours of fasting state.
FBG was measured using glucose oxidase method kit (Pars Azmoon, Tehran, Iran), through auto-analyzer devices (Hitachi®, model 704, 902, Tokyo, Japan). Serum insulin concentrations were determined by enzyme-linked immunosorbent assay (ELISA) technique using a microplate reader. Homeostasis model assessment of insulin resistance (HOMA-IR) was calculated by computing the following equation: (fasting glycemia [mmol/L]×fasting insulin [mIU/L])/22.5 [25]. Participants who used insulin injection were excluded for the HOMA-IR analysis.
Novel hepatic steatosis indices
Novel hepatic steatosis indices were calculated according to below equations:
FLI=(E0.953×log [triglycerides]+0.139×BMI+0.718×log [gamma-glutamyl transferase, GGT]+0.053×waist circumference-15.745)/(1+e 0.953×log [triglycerides]+0.139×BMI+0.718×log [GGT]+0.053×waist circumference-15.745)×100 [26].
LAP=(waist circumference [cm]-65)×(triglyceride concentration [mM]) for men, and (waist circumference [cm]-58)×(triglyceride concentration [mM]) for women [27,28].
HSI = 8 (alanine transaminase [ALT]/aspartate transaminase [AST]) ratio+BMI (+2 if diabetes mellitus [DM] status +2 if female) [8].
FSI=-7.981+0.011×age (y rs)–0.146×sex (female=1, male=0)+0.173×BMI (kg/m2)+0.007×triglycerides (mg/dL)+0.593×hypertension (yes=1, no=0)+0.789×diabetes (yes=1, no=0)+1.1×ALT/AST ratio ≥1.33 (yes=1, no=0) [29].
Statistical analyses
Data of 10 participants who did not attend to the post-test assessment was excluded and only available data of 42 participants who completed the pre and post assessment were analysed. A Kolmogorov-Smirnov test was used for checking normality of data. Baseline characteristics of the groups were compared with a one-way analysis of variance (ANOVA) or Kruskal-Wallis test when data was not normally distributed. Two-way ANOVA test was used to examine the impact of Time×Group. A post-hoc (Tukey post-hoc) test was used to identify differences between groups when a significant difference was observed. Data are presented as mean±standard deviation. Statistical significant was accepted when P<0.050. All the analyses were performed applying SPSS software (version 21; IBM Corp., Armonk, NY, USA).
RESULTS
Data of 10 participants who did not attend to the post-test assessment were excluded, the median drop out was 17.5% (interquartile range, 75% to 99%) for SIT and combined training sessions and 22.4% (interquartile range, 75% to 99%) for control group. Thus, the data of 42 participants who completed the pre and post assessment were analyzed, with mean age 55.07±5.92 yrs old. Participant flow through the study can be found in the CONSORT flowchart in Figure 1. The adherence of training sessions was 78% in SIT and 82% in A+R groups. Twenty-seven subjects were treated with oral hypoglycemic medications, 20 with insulin injections, and five with combination therapy of insulin injection and oral drugs. A baseline characteristic is represented in Table 2. A one-way ANOVA was used to show that there are no significant differences for baseline characteristics between groups (Table 3). Applying FLI (>60) as the reference method for NAFLD, Table 2 gives the characteristics of the subjects with fatty liver. Fatty liver was more frequent among subjects in SIR, A+R and control groups, respectively.
Effects of sprint interval training (SIT) and combined A+R training on primary outcome measures
Change in fatty liver profiles
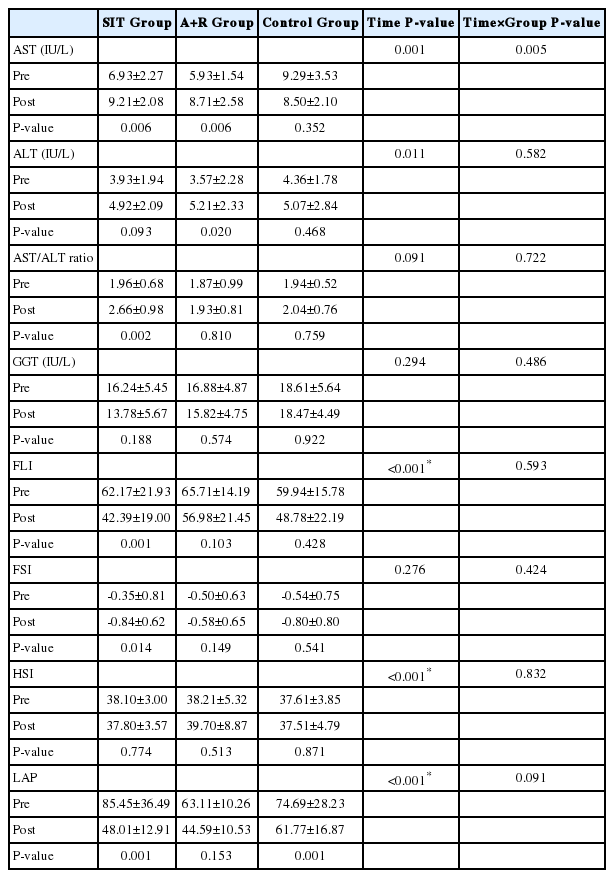
There were no significant improvements of FLI (P=0.593), FSI (P=0.424), HSI (P=0.832) and LAP (P=0.091) by Time×Group interactions in the groups (Table 3). However, there were significant improvements of FLI (P<0.001), HSI (P<0.001), and LAP (P<0.001) by Time interactions between the groups (Table 3).
Change in metabolic profiles
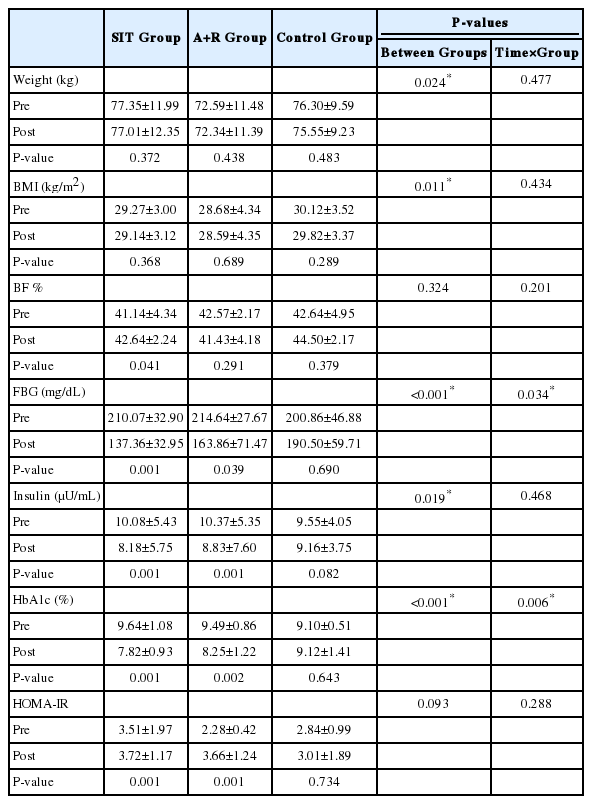
As hypothesized the level of FBG (P=0.034) and HbA1c (P=0.006) significantly decreased by Time×Group interactions in the SIT and A+R groups (Table 4).
Effects of sprint interval training (SIT) and combined A+R training on secondary outcome measures
Change in body composition
Over time weight (P=0.477), BMI (P=0.434) lean body mass (P=0.381) and BF % (P=0.201) not significantly reduced by Time×Group interactions in the SIT and A+R groups. The results were still same when an ANOVA was performed.
Adverse events
No clinically severs adverse events were identified and reported during a 10-week intervention. However, most patients reported muscle soreness in the legs during SIT (76%) and A+R trainings (82%).
DISCUSSION
There have been quite a few studies which compared the influence of SIT and combined A+R trainings on some novel non-invasive hepatic disorder-related equations in T2D. However, to the best of our knowledge, this is the first study to assess the effect of SIT and A+R trainings on the non-invasive indices; FLI, LAP, HSI and FSI in women with T2D. Our study showed no significant improvement of the non-invasive scores after 10 weeks of training in the groups in FSI.
We found FLI, HSI and LAP were significantly improved after 10 weeks of training in the groups. The improvement of some fatty liver indices through this present study may reflect the possible reduction of ectopic fat deposits that are responsible for improvement of insulin resistance (HOMA-IR) in diabetes type 2 [30]. However, in this study, patients did not change their habitual diet, and no changes in BF % were observed. There were no similar studies which tested the effects of exercise modalities on fatty liver indices in patients with DM.
The effect of SIT and combined training on HSI values is consistent with reported results showing that this exercise intervention was superior to another intervention in reducing hepatic-related parameters [31,32]. The mechanism which caused the improvement of some fatty liver indices by exercise is unclear. Available studies also suggested positive effects of exercise intervention on liver metabolic signaling pathways such as improved oxidative enzymes activity, increased fatty acid oxidation and reduced intracellular lipid accumulation in the liver [33-36]. Several observational studies indicated that the effect of high intensity short-term training on hepatic risk scores is mediated independently by no improvement in the abnormalities of BF % [37,38], as seen in this research.
Our study investigated that there was reduction in serum FLI in women with T2D after 48 hours of chronic SIT. But in another study, Barsalani et al, illustrated that following the 6-month intervention including isoflavone supplementation plus exercise training, FLI improved in overweight/obese postmenopausal women [39]. Other studies have demonstrated significant changes in FLI response following lifestyle intervention such as exercise training and diets [32,39]. In humans, it seems that exercise training decreases plasma free fatty acids and reduces intramuscular triglyceride (IMTG) content independent of alterations in body composition [40]. On the other hand, effect of SIT is mediated by a reduction in the abnormalities of BF % and dyslipidemia. In addition, independently of weight loss, SIT may reduce FLI through reduction of insulin resistance, increasing mitochondrial biogenesis, and body strength independently predicted the reduction in FLI in resistance training protocol [32]. Valuable information provided by our study is that the extent of improvements in FLI was dependent on intensity of exercise training, whereas the impact of volume was elusive. In fact, FLI showed a trend for improvement with increasing exercise intensity and also with increased extent of exercise traininginduced changes in BF %. It has been hypothesized that during high intensity training, due to increased circulating blood catecholamines, hepatic glucose metabolism is controlled by catecholamines [41].
A novel finding of the present study is that SIT markedly reduced FSI in type 2 diabetic patients. Until now, no randomized controlled trials have reported effects of these two training on FSI in patients with T2D. This difference might be explained by the higher exercise intensity of intervention, although in this current study there were no significant improvement in total BF %, and HOMA-IR. There is no published study directly assessing the effects of exercise training on FSI in adults. It can be speculated that SIT not A+R is likely sufficient to reduce FSI score in groups. Similarity, some studies showed that high intensity training can improve hepatic parameters, independent of body composition [38,42,43]. The results of the present study did not confirm the hypothesis that SIT improves FSI in a superior manner than combined A+R training in T2D.
The results of the present 10-week study conducted with T2D patients on hepatic disorders identified with FLI, FSI, LAP and HSI showed that there were no differences between 10-groups. It has been recently illustrated that a significant improvement in Bright Liver Score is achieved following a 6-month of Mediterranean diet [44], which may show a sufficient statistic approach that could improve hepatic risk score within a short-time duration (three months).
No significant improvements were demonstrated in serum insulin levels, and insulin resistance index (HOMA-IR) in combined and SIT groups compared to control group.
The above-mentioned findings seem to be inconsistent with those of studies found that high intensity training was accompanied by improved glycemic control in obese and/or patients with T2D [45-47].
Significant decreases in FBG and HbA1C in patients with T2D demonstrated a clinical importance. These are important results because they suggest that these kinds of exercise may have the potential to control glycemic indices related to insulin resistance.
Our study has several potential limitations. First, the small size of subjects can be considered as a limitation of the study. Second, according to we were not allowed to conduct a repeated liver biopsy for histology analysis. Therefore, the hepatic fat content was not measured by the laboratory. Third, we did not utilize ultrasonography to detect fatty liver, which is another limitation of our study. In addition, short duration of the study can be considered as the other limitation of present study.
Taken together, the results of present study support the importance of high intensity training and combined training program to improve T2D, and the fact that some studies showed that combined training (A+R) and SIT interventions could improve glucose homeostasis in women with T2D. Results highlighted that 10-weeks of exercise training independent of mode of training and body composition alteration (SIT vs. combined training) is an effective training method to improve hepatic steatosis and glycemic control in individuals with T2D.
Notes
Authors’ contribution
E. Banitalebi and M. Faramarzi designed the study. S. Nasiri and E. Banitalebi supervised exercise training protocols. E. Banitalebi and M. Faramarzi supervised laboratory exams and data collection. E. Banitalebi and M. Faramarzi analyzed and interpreted the data. E. Banitalebi, M. Faramarzi and S. Nasiri, M. Mardaniyan and V. Rabiee wrote the first draft of the manuscript. M. Faramarzi edited the paper. All authors contributed to the writing of the paper. All authors read and approved the final manuscript.
Acknowledgements
The authors acknowledge all the subjects who participated in this study.
Notes
Conflict of Interest
The authors have no conflicts to disclose.
Abbreviations
ACSM
American College of Sports Medicine
A+R
aerobic and resistance
BF
body fat
BMI
body mass index
FBG
fasting blood glucose
FLI
fatty liver index
FSI
Framingham Steatosis Index
HbA1c
hemoglobin A1c
HOMA-IR
homeostasis model assessment of insulin resistance
HSI
hepatic steatosis index
HR
heart rate
IMTG
intramuscular triglyceride
LAP
lipid accumulation product
NAFLD
non-alcoholic fatty liver disease
SIT
sprint interval training
T2D
type 2 diabetes
WHR
circumference waist of hip ratio
References
Article information Continued
Notes
Study Highlights
• High intensity training and combined training program to could improve type 2 diabetes (T2D).
• Independent of mode of training, sprint interval training (SIT) or combined aerobic and resistance (A+R) training are effective strategies to improve some indices related to hepatic steatosis in women with T2D.