Portal pressure gradient and serum albumin: A simple combined parameter associated with the appearance of ascites in decompensated cirrhosis treated with transjugular intrahepatic portosystemic shunt
Article information

Abstract
Background/Aims
In recent years, greater assessment accuracy after transjugular intrahepatic portosystemic shunt (TIPS) to ascertain prognosis has become important in decompensated cirrhosis due to portal hypertension. The aim of this study was to assess the ratio of the portal pressure gradient (PPG) pre-TIPS (pre-PPG) to albumin (PPA), which influence ascites formation in cirrhotic patients in the 6-months after TIPS placement, and is a metric introduced in our study.
Methods
This was a retrospective cohort study of 58 patients with decompensated cirrhosis admitted to an academic hospital for the purpose of TIPS placement. We collected the following data: demographics, laboratory measures, and PPG during the TIPS procedure. Then we analyzed the association between the above data and ascites formation postTIPS in cirrhosis patients.
Results
Twenty-two patients with ascites and 28 without ascites were evaluated. Univariate and binary logistic regression analysis were adjusted for the following variables: to determine prognosis; Child-Pugh scores, lymphocyte count, platelet count, hemoglobin level, albumin level and pre-PPG or PPA. The outcome showed that PPA was better than pre-PPG and albumin for predicting ascites according to area under receiver operating characteristic curves and a statistical model that also showed PPA’s influence 6-months post-TIPS.
Conclusions
The combined measurement of pre-PPG and albumin, defined as PPA, may provide a better way to predict post-TIPS ascites in decompensated cirrhosis, which underlines the need for a large clinical trial in the future.
INTRODUCTION
Portal hypertension (PH) is a progressive stage typical of advanced chronic liver disease and is responsible for most of the complications of cirrhosis [1], and decreasing portal pressure by portosystemic shunt, such as transjugular intrahepatic portosystemic shunt (TIPS), has been proven to relieve the complications, including ascites [2-4].
Ascites is the most common decompensating manifestation in patients with liver cirrhosis, with a mean 1-year occurrence of 7–10% and 60–70% within 10 years [1,5,6], which is associated with raised hydrostatic pressure in the portal venous bed and diminished serum oncotic pressure, characterized by portal pressure gradient (PPG) and serum albumin. Previous studies mainly used functional disability, model for end-stage liver disease (MELD), MELD-Na, urine sodium and platelet count to predict the mortality [7,8] or survival [9-11] after TIPS placement, few study showed the status of follow-up, such as ascites [12]. In fact, cirrhotic patients with ascites have a high risk of developing complications such as spontaneous bacterial peritonitis and acute kidney injury [13,14], and after the appearance of ascites the probability of survival is up to 85 and 57% at 1 and 5 years, respectively [13]. Therefore, we should take a more concern to the cirrhosis after TIPS with ascites who should have a lower rate of PH-related complications. In this study, our purpose was to further observe the relationship between portal pressure or serum albumin level and ascites formation in patients after TIPS, and attempted to find a suitable parameter as a more affecting factor on the ascites performance after TIPS. Herein, we present the effect of the ratio of pre-PPG to albumin (PPA) on the outcomes of ascites in 6 months after TIPS placement in cirrhotic patients.
PATIENTS AND METHODS
Study design and follow up
Consecutive patients with decompensated cirrhosis undergoing TIPS placement for the complications of PH were enrolled in the study, from December 2013 to October 2015. The surveillances of those after TIPS were followed in the outpatient clinic at 1, 3 and 6 months or whenever a clinical event occurred during follow-up. In our study, the observational endpoint was the presence of ascites at the post-TIPS 6-month. The time to observe outcome was set from June 2014 to September 2015. And the outcomes were ascites, gastrointestinal bleeding, hepatic encephalopathy, death and withdraw. Ethic approval for the study was granted by the Ethics Commitee of Anhui Medical University (Quick-PJ 2016-11-08).
Data collection
Fifty-eight patients were selected from a database of 87 consecutive patients who underwent elective TIPS procedures for PH complications. We electronically retrieved all patient demographics, detailed clinical history, TIPS procedures, laboratory tests, clinicians prescriptions, PPG during hospital admission and the outcomes of the 6 months after TIPS. Clinical data included the etiology of liver disease, indication for TIPS, such as ascites, gastrointestinal bleeding, and both, Child-Pugh scores, MELD, as well as laboratory data including white blood cell, lymphocyte, hemoglobin, albumin, total bilirubin (TB), serum creatinine, international normalized ratio (INR) and prothrombin time within 5–7 days pre-TIPS. At the same day, the MELD scores were calculated through the laboratory values of TB, serum creatinine, and INR [15]. In our study, patients with ascites were controlled with diuretics (spironolactone and/or furosemide), and the dosages were adjusted according to the amount of urine. Patients with serious hypoproteinemia were improved by albumin infusion, then discontinued until the liver function and other parameter were assessed to be stable. Occasionally, although clinicians prescribed beta-blocker to relieve PH, patients took it infrequently and irregularly.
Definitions
Cirrhosis
Decompensated cirrhosis of research group was defined based on clinical features, including a history consistent with chronic liver disease as well as a documented complication of chronic liver disease (i.e., ascites, gastrointestinal bleeding, hepatic encephalopathy), and/or imaging consistent with cirrhosis. The etiology of liver cirrhosis included as follows; (1) Viral cirrhosis: Cirrhosis of the liver is caused by hepatitis B virus (HBV) or hepatitis C virus infection. (2) Alcohol related liver cirrhosis: Alcohol consumption was defined as 40 grams/day for a period of 5 years or 80 g/day for a shorter period. (3) Other: Patients with other etiologies for cirrhosis. (4) Mixed etiologies: The patients have more than one causes for cirrhosis. Of the entire cohort, patients infected by chronic HBV were treated with oral nucleos(t)ide analogues (NUCs), the dose of antiviral agents was adjusted when used in patients with impaired renal function. In addition, all patients with alcoholic cirrhosis abstained from alcohol for more than one year.
Ascites
Ascitic fluid was classified as small, moderate, or large, based on physical exam and available imaging. In brief, Grade 1 ascites is mild ascites only detectable by ultrasound examination; Grade 2 or moderate ascites was defined as moderate symmetrical distention of abdomen described on the admission note; Grade 3 or large ascites was considered as obvious abdominal distention seen during physical exam or ultrasound [16]. Thus, in light of our study, the patients were divided into two groups: Group A (ascites, Grade 1 to Grade 3) and Group B (no ascites).
Indication for TIPS
TIPS has been an established procedure in the treatment of the complications of PH, including bleeding esophageal varices, refractory cirrhotic ascites, hepatic hydrothorax, hepatorenal syndrome and so on. However, despite these broad applications, refractory acute variceal hemorrhage and control of refractory cirrhotic ascites are the vital important indications subjected to numerous controlled trials. Our indications for TIPS included variceal bleeding, ascites and both.
Measurement of PPG
The procedures were performed under conscious general anesthesia in the angiography, and which were performed by an experienced radiologist using an established technique [17,18]. Before the right internal jugular vein was placed in the suprahepatic portion of the inferior vena cava and catheterized into the right hepatic vein, inferior vena cava pressure was measured when the tip of the catheter floated in the inferior vena cava at the junction with the hepatic vein. A needle and guide-wire were advanced through the liver parenchyma into a branch of the portal vein with fluoroscopic guidance, which was then followed by direct portography. During the TIPS procedure, the PPG was measured and intravenous heparin was given after the placement.
Statistical analysis
Calculations were performed with SPSS 21.0 (IBM Corp., Armonk, NY, USA). The statistical significance of differences between groups was tested by using Independent Student’s t-test for continuous normally distributed variables and by chi-square for qualitative data. Multivariate analysis was performed by means of logistic regression on parameters which were significantly different in univariate analysis in order to determine the variables independently associated with presence of ascites. Through cut-off value, quantitative data were translated into binary classification variables. Receiver operating characteristic curve (ROC) analysis was used to test the accuracy of continuous variables independently associated with prognosis. The best cut-off levels of pre-PPG, albumin and their ratio to predict the outcome of ascites were selected by using the Youden’s index, a well characterized objective method that maximised the sum of sensitivity and specificity [19]. The contribution of each variable to the risk of reaching the endpoint was expressed using the area under ROC (AUROC) and its corresponding 95% confidence interval. The comparison between AUROC was also assessed according to DeLong et al. [20] Patients who were lost from follow-up were considered censored. Results are expressed as the mean±standard deviation. All reported P-values are two-tailed, with values less than 0.05 considered significant.
RESULTS
Clinical, laboratory and the 6 months of follow-up characteristic
Fifty eight consecutive cirrhotic patients with TIPS were enrolled in the study, 5 patients withdrew and 3 patients died after TIPS for the 6 months of follow-up. Their clinical and laboratory characteristic were reported in Table 1. The outcome was 22 patients with ascites (Group A) and 28 patients with no ascites (Group B). In the two groups, the etiologic causes of cirrhosis was due predominantly to HBV (Group A 68.18% and Group B 87.5%), alcohol (Group A 9.09% and Group B 0). The mixed etiologies concluded HBV and alcohol, HBV and schistosomiasis, and alcohol and schistosomiasis. As shown in Table 1, the two study groups did not differ significantly according to age, gender, MELD scores and the etiology of cirrhosis. However, there were significant differences in Child-Pugh scores, pre-PPG and post-PPG between the two groups in clinical statistics (P<0.05). A comparison of two groups, the laboratory factors of lymphocyte, hemoglobin, platelet, albumin and PPA also showed significant difference (P<0.05), as well as TB expressed difference (P<0.10).
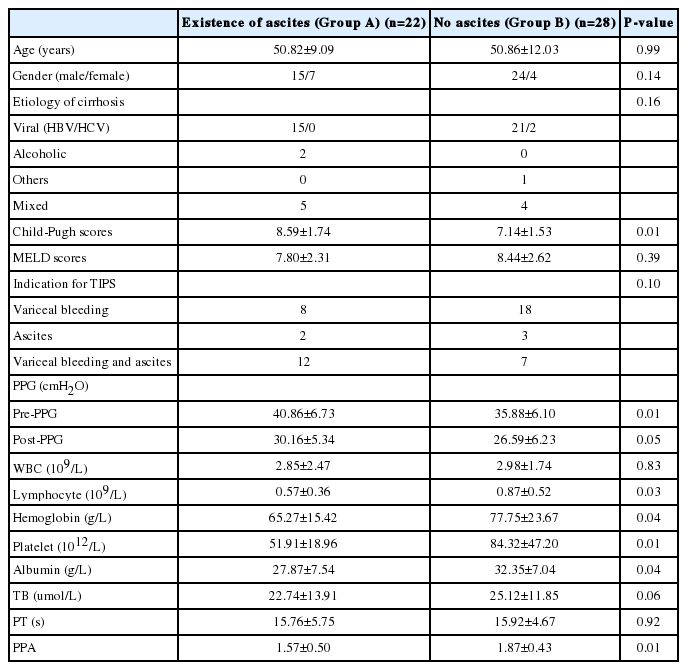
Main demographics and biochemical features for all study patients
Translate quantitative data to binary data by cut-off values
A univariate analysis of all quantitative parameters collected showed that, a positive linear correlation was found between the presence of ascites in the 6-month post-TIPS and pre-PPG, post-PPG, lymphocyte, hemoglobin, platelet, albumin, TB, as well as PPA respectively. Their cut-off values were respectively 34.50 cmH2O, 23.50 cmH2O, 0.57×10m9/L, 76.50 g/L, 91×109/L, 30.80 g/L, 12.66 μmol/L and 1.17. Among them, we analyzed pre-PPG, albumin and PPA associated with ascites of prognosis separately. Receiver operator characteristic analysis revealed that pre-PPG, albumin and PPA had an initial confidence interval for differentiating group A from group B. The area under the curve was 0.69 for pre-PPG, 0.71 for albumin and 0.75 for PPA (Fig. 1). According to the differences of AUROC, the parameter of PPA had a slightly higher probability of presence of ascites than pre-PPG and albumin in the 6 months after TIPS. However, the discriminative power between the PPA and pre-PPG was not present (Z=0.83, P=0.41).
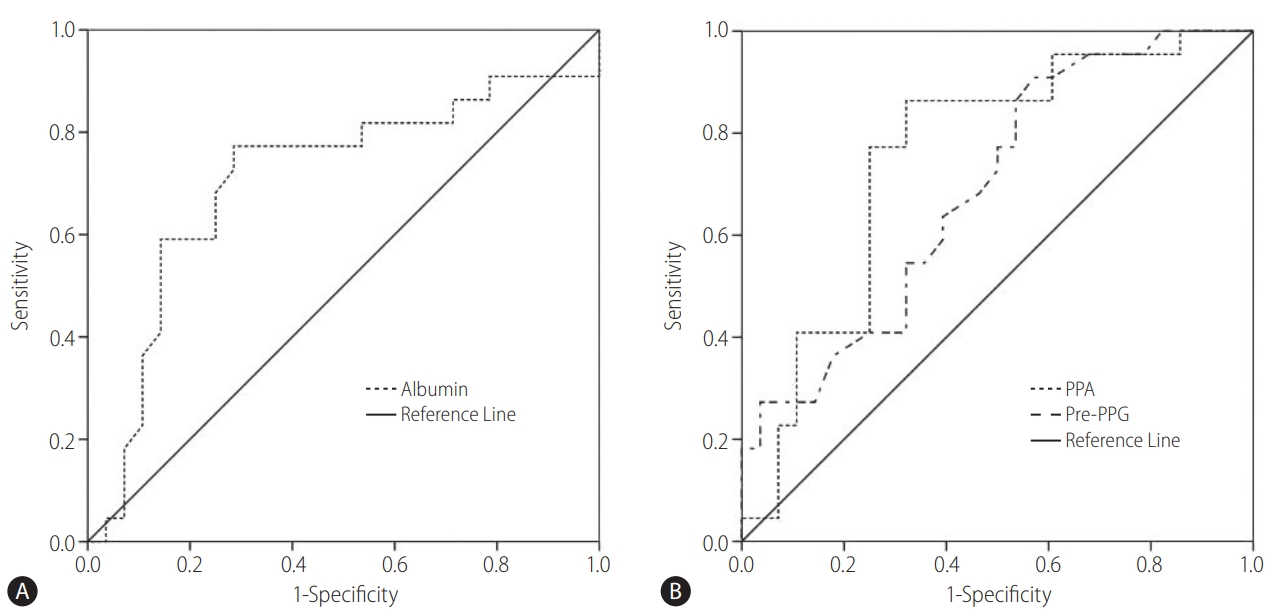
Receiver operating characteristic (ROC) curve predicts ascites in patient post-transjugular intrahepatic portosystemic shunt (post-TIPS). (A) ROC curve showing the prediction of no ascites with albumin in patients post-TIPS. The area under the ROC curve was 0.71 (95% confidence interval [CI] 0.55–0.86; P<0.01). (B) ROC curve showing ascites prediction with pre-portal pressure gradient (pre-PPG) and pre-PPG/albumin (PPA). The areas under the ROC curves were 0.69 (95 CI 0.54–0.84; P=0.02) and 0.75 (95 CI 0.62–0.90; P<0.01), respectively. The best cut-offs for albumin, pre-PPG, and PPA for predicting ascites were 30.80 g/L, 34.50 cmH2O, and 1.17, respectively
Factors associated with the presence of ascites by logistic analysis
Because pre-PPG, albumin and their ratio were thought to reflect the slightly different outcomes of ascites in 6 months post-TIPS, we performed a first exploratory binary logistic regression analysis to evaluate which variable among them better predected the existence of ascites. We performed two binary logistic regression models to identify clinical and laboratory variables that could have prognostic value for predicting the presence of ascites in the 6 months of fellow-up after TIPS. Univariate predictors of occurrence of ascites included the following: gender, Child-Pugh scores, indication for TIPS, lymphocyte count, hemoglobin level, platelet count, albumin level, TB level, pre-PPG, post-PPG and PPA. Except albumin level, pre-PPG and PPA, other variables were all introduced into the two models by backward method of logistic regression analysis. Albumin level and pre-PPG entered into model 1, while PPA entered into model 2. Both in the two models, the Child-Pugh scores, lymphocyte count, hemoglobin level and platelet count could not considered as independent impact factor of the appearance of ascites in patients after TIPS indication. In the model 1, patients with albumin below 30.80 g/L closed to show a tendency to produce ascites than those above 30.80 g/L (P=0.10). There was no evidence of an association between pre-PPG and occurrence of ascites during the 6 months after TIPS. However, patients with PPA showed a significant independent risk factor of occurrence of ascites (Table 2).

Parameters associated with ascites for two models using binary logistic regression
DISCUSSION
The methodology of TIPS corrects PH, and in patients who liver dysfunction is not too severe, is able to slowly clear ascites [21]. But, in other published article on the use of TIPS as a treatment for refractory ascites, there were a portion of patients who were either very slow or never cleared their ascites [22]. In recent years, greater accuracy of assessment of prognosis in cirrhosis has become important with the increasing use of TIPS. In this article, we would intend to detect the significative factors which influence the probability of ascites after TIPS in patients with cirrhosis.
In our study, HBV infection was the most common cirrhosis etiology among TIPS recipients which were all through a long-term treatment with oral NUCs that prevent the replication of fibrosis and improve the liver necroinflammation [23,24], and followed by the alcohol-related liver cirrhosis as a single or mixed cause. Although the causes of cirrhosis was not uniform, there was no statistical difference between the two groups in our setting. Additionally, we could not confirm the statistical difference of MELD scores on the ascites formation after TIPS, although the articles [25,26] suggested that the MELD score was considered as a predictor of shortterm outcome after TIPS creation. One interpretation may be that the independent of the MELD score is mainly associated with increased risk of death in liver transplant candidates.
However, this study emphasized that the two parameters of pre-PPG and serum albumin, indicative of the presence of PH related to complications, were significantly different in cirrhotic patients with ascites in the 6-month after TIPS as compared those without ascites. Under the AUROC, the PPA appeared better to affect the appearance of ascites than pre-PPG, as first report in this article. But an unfulfilling result was that they had little statistical significance. It is presumably that the small sample size may have been responsible for the surprising result, and we will further expand the sample size to identify in future studies. In addition, after performing the models through introduction of the variables such as the Child-Pugh scores, lymphocyte count, hemoglobin level, platelet count and pre-PPG, all factors except PPA could not considered as independent influence factor on the appearance of ascites in patients after TIPS indication. We therefore postulate that the PPA can be used as a sensitive factor to assess the risk of ascites development in the 6-month post-TIPS. However, prospective studies with cirrhosis related to PH for TIPS emphasizing a large numbers of subjects are necessary for verifying the precision of these initial estimates.
The most outpoints of our study are related to PPA, is the combinative parameters of pre-PPG and albumin. These two factors, high hydrostatic pressure and low oncotic pressure, would favour the passage of fluid from the intravascular compartment to the peritoneal cavity [27-29]. The previous article [17] demonstrated that the beneficial effect of portal pressure reduction protected from development or worsening of ascites in patients treated with TIPS. Apparently, our report confirmed that the correlation between ascites and PPG, especially the pre-PPG. In our study, albumin was also associated with ascites, but can’t clarify all questions. Many views put forward that the serum albumin should be responsible for the ascites formation. Human serum albumin is the most abundant protein in extracellular fluid and its oncotic capacity largely determines the fluid distribution in the body. Recent study [30] has clearly shown that albumin undergoes post-transcriptional abnormalities in patients with cirrhosis. These altered isoforms were independently associated with ascites of cirrhotic specific complications. It suggested that the presence of ascites was related not only to serum albumin concentration, but also to its structural integrity. We confirm that there are some intercommunity and differences in the formation of ascites between portal pressure and serum albumin. A series of literature [31-33] pointed out that the combinative measurement might offer better prognostic information than a single measurement. Thus, the combination of pre-PPG and albumin, first proposed, is superior to the performance of them alone for predicting ascites. A model based on PPA also performs well in associating with the presence of ascites in the 6 months post-TIPS. This is the first study exploring the association between the levels of pre-PPG and albumin and the outcomes of ascites as well as the possible value of their ratio in affecting the ascites in cirrhotic patients after TIPS in 6 months. In the regard, we prove that each variable is routinely identified by univariate analysis, further reliably applying the best cutoffs of the curves, and introduce these variables into a model by logistic regression analysis, and at last check-out the meaningful variables in affecting the ascites in 6 months after TIPS. Every step of design is logical and rigorous. Nevertheless, someone may question the output that the differences are not so distinct between the portal pressure and albumin from combination to alone (AUROC from 0.69 to 0.75). But so far, no document has reported any useful parameter is greater than the deduced result in affecting of ascites in the 6-month after TIPS. The independent ability of PPA should be verified in larger subjects, which is the limitation of our study.
These above parameters must be interpreted in the context of the study design. First, this is a retrospective study and along with incomplete information (such as medical co-morbidities, patients lost to follow-up, etc). As so, we could observe and analyze only clinically relevant parameters, such as the PPG or PPA in each stage post-TIPS was not investigated, which may play a decisive role on the changes of ascites. Second, our patients are restricted to a single center with small amounts of research objects. Additionally, the patients enrolled in the study were usually infected by HBV, hence, the study may have selection bias. Finally, we did not clarify the specific time of generation of ascites in 6-month post-TIPS.
In our study, PPA is considered closely related to ascites formation after TIPS in the 6-month. Particularly, our results strongly indicate that combinative PPA is a more appropriate way of expressing post-TIPS ascites beyond their single individual. These splendid yet preliminary outputs, should they be further verified by larger studies, not only provide complete information correlating prognosis, but also justify the result of prospective studies to testify this novel diagnostic approach.
Notes
Authors’ contribution
Professor Jiabin Li contributed substance to ideas and design; Dongmei Zhao analyzed and drafted the paper; Guobing Zhang and Mingquan Wang provided TIPS technical support; Chaoxue Zhang completed the part of the experiments. All authors agreed to publish the submitted version of the paper.
Conflicts of Interest The authors have no conflicts to disclose.
Abbreviations
AUROC
area under receiver operating characteristic curve
HBV
hepatitis B virus
INR
international normalized ratio
MELD
model for end-stage liver disease
NUCs
nucleos(t)ide analogues
PH
portal hypertension
PPA
the ratio of pre-PPG to albumin
PPG
portal pressure gradient
TB
total bilirubin
TIPS
transjugular intrahepatic portosystemic shunt
References
Article information Continued
Notes
Study Highlights
1. To assess the result of ascites formation in decompensated cirrhosis patients after transjugular intrahepatic portosystemic shunt (TIPS) placement.
2. Directly compare the differences between portal pressure gradient (PPG) pre-TIPS/albumin (PPA) and serum albumin with ascites formation after TIPS using area under receiver operating characteristic curve and a predictive statistical model.
3. This study is the first to put forward evidence that PPA provides a better way of predicting post-TIPS ascites than PPG and serum albumin.