Picroside II attenuates fatty acid accumulation in HepG2 cells via modulation of fatty acid uptake and synthesis
Article information

Abstract
Background/Aims
Hepatic steatosis is caused by an imbalance between free fatty acids (FFAs) uptake, utilization, storage, and disposal. Understanding the molecular mechanisms involved in FFAs accumulation and its modulation could drive the development of potential therapies for Nonalcoholic fatty liver disease. The aim of the current study was to explore the effects of picroside II, a phytoactive found in Picrorhiza kurroa, on fatty acid accumulation vis-à-vis silibinin, a known hepatoprotective phytoactive from Silybum marianum.
Methods
HepG2 cells were loaded with FFAs (oleic acid:palmitic acid/2:1) for 20 hours to mimic hepatic steatosis. The FFAs concentration achieving maximum fat accumulation and minimal cytotoxicity (500 μM) was standardized. HepG2 cells were exposed to the standardized FFAs concentration with and without picroside II pretreatment.
Results
Picroside II pretreatment inhibited FFAs-induced lipid accumulation by attenuating the expression of fatty acid transport protein 5, sterol regulatory element binding protein 1 and stearoyl CoA desaturase. Preatreatment with picroside II was also found to decrease the expression of forkhead box protein O1 and phosphoenolpyruvate carboxykinase.
Conclusions
These findings suggest that picroside II effectively attenuated fatty acid accumulation by decreasing FFAs uptake and lipogenesis. Picroside II also decreased the expression of gluconeogenic genes.
INTRODUCTION
Nonalcoholic fatty liver disease (NAFLD) is a major degenerative liver disorder caused by accumulation of excessive fat in hepatocytes, and has detrimental effect on hepatic fatty acid metabolism [1]. NAFLD covers a spectrum of clinical conditions beginning with simple steatosis to steatohepatitis, degenerative fibrosis and irreversible cirrhosis [2]. It is estimated that 63-33% of the world’s population, including children, is affected with NAFLD [3]. Hence it is imperative to prevent development of NAFLD at an early stage or regress it, such that an aggressive inflammatory condition like steatoheaptitis is avoided.
Despite its wide prevalence, there is limited understanding on the precise molecular mechanisms responsible for the development and progression of hepatic steatosis [4]. In a healthy individual, free fatty acids (FFAs) derived from either chylomicrons and/or adipose tissue (lipolysis) are taken up by hepatocytes. These FFAs are metabolized via β-oxidation or are esterified to triglycerides (TG) which are either stored as lipid droplets or secreted as very low density lipoprotein (VLDL) [5]. Hepatic steatosis ensues when there is an increase in FFAs uptake, lipogenesis, and storage of lipids with a concomitant decrease in VLDL-TG secretion [4].
Apart from life style modifications, current pharmacological therapies used for NAFLD have not proved to be very effective [6]. Ayurveda, the oldest system of traditional medicine in India, has a rich heritage of several medicinal plants and their formulations which are used for the treatment of liver disorders. Picrorhiza kurroa (P. kurroa) is a distinguished medicinal plant whose roots and rhizomes have shown beneficial effect in ameliorating obesity, jaundice, malaria, and asthma [7]. The hydrocholeretic activity of P. kurroa was first investigated in dogs with biliary fistula [8]. Later, its therapeutic activity was studied by our group in a double-blind, placebo-controlled trial in patients with viral hepatitis using Arogyawardhini [9]. Arogyawardhini, a formulation containing 50% P. kurroa, when administered for 14 days (750 mg thrice a day), significantly reduced all symptoms; hepatomegaly, serum bilirubin and glutamic-pyruvic transaminase levels [9]. The plant extract also provided protection against carbon tetrachloride, paracetamol, thioacetamide and galactosamine-induced fat deposition and liver damage in rats [10-13].
Since P. kurroa extract was found to be an effective hepatoprotective herb, it would be valuable to determine its active constituents for their novel therapeutic application. The active elements present in P. kurroa are the iridoid glycosides; picroside I, II and III. With the emerging challenge of NAFLD, the current study was aimed at exploring the effect of phytoactives, present in P. kurroa, picroside I and II on hepatic fatty acid accumulation vis-à-vis silibinin, a known hepatoprotective phytoactive from Silybum marianum [14].
MATERIALS AND METHODS
Cell culture
HepG2 cells (AddrexBio, San Diego, CA, USA) were cultured as monolayers in DMEM (Gibco, Life Technologies, Waltham, MA, USA) with 10% fetal bovine serum (Invitrogen, Waltham, MA, USA) and 1% of antibiotic-antimycotic solution (Gibco, Life Technologies, Waltham, MA, USA). Cells were maintained in a humidified incubator in 5% CO2 at 37 °C (Thermo Scientific, Waltham, MA, USA). All the experiments were performed when the cells reached ~75-80% confluence in 5% DMEM. The experiments were repeated individually for four to six times to confirm the reproducibility.
Bovine serum albumin-FFAs conjugate
Prior to overloading the cells with long chain FFAs, palmitic acid (Sigma-Aldrich, St. Louis, MO, USA) and oleic acid (Sigma-Aldrich, St. Louis, MO, USA) were conjugated individually with BSA (Sisco Research Laboratories Pvt Ltd, Mumbai, India). BSA favors transportation of FFAs inside the cells. FFAs-BSA conjugate was prepared as previously described with minor modifications in the protocol [15]. Briefly, 100 mM of FFAs stock was prepared in 0.1 M NaOH by heating at 70°C in a thermo mixer (Eppendorf, Hauppauge, NY, USA) for an hour. Simultaneously, 5% (wt/vol) BSA was dissolved in double distilled water. On complete dilution of FFAs stock in NaOH, the conjugate was prepared in an adjacent water bath at 55°C. FFAs-BSA conjugate stock of 10 mM was prepared and filtered using 0.45 μm pore size polyvinylidene fluoride hydrophilic membrane filter. The conjugate was later cooled to room temperature and stored at -20 °C. At this temperature the conjugate was found to be stable for 3-4 weeks. Since the FFAs were conjugated with 5% BSA, the control cells were also treated with 5% BSA.
Cell cytotoxicity detection
HepG2 cells (7×10³ cells/well) seeded in 96-well plates were treated with different concentrations of FFAs mixture of oleic and palmitic acid in the ratio of 2:1 (250 to 1,000 μM), picroside I and II (3 to 300 μM) (Natural Remedies Pvt Ltd, Bengaluru, Karnataka, India) and silibinin (3 to 300 μM) (Sigma-Aldrich, St. Louis, MO, USA) for 24 hours. Post treatment, the cells were incubated with 5 mg/mL of methyl thiazolyl tetrazolium (Sigma-Aldrich, St. Louis, MO, USA) for 4 hours. The blue colored formazan crystals formed were dissolved in dimethyl sulfoxide and absorbance was measured at 570 nm (Bio rad 680 Elisa Reader).
Colorimetric determination of lipid content with Oil Red O staining
HepG2 cells (7×10³ cells/well) were incubated with FFAs mixture in 96-well plates for 20 hours. After treatment, the cells were fixed (4% formaldehyde) and stained with Oil Red O (ORO) solution (3 mg/mL in 60% isopropanol) for 5 minutes. ORO stain (Sigma-Aldrich, St. Louis, MO, USA) is primarily used to detect and quantify intracellular lipids. The lipid accumulated within the cells was quantified by disrupting the cells with 100% isopropanol. The absorbance of the extracted solution was measured at 490 nm (Enspire - Multimode Plate Reader - PerkinElmer, Waltham, MA, USA). Once the FFAs model was standardized, inhibitory activity of the phytoactives was also examined with ORO colorimetric assay. HepG2 cells were pre-incubated with the bioactives prior to FFAs treatment at an optimum time of 2 hours as derived after three repeated experiments (data not shown).
Fluorimetric imaging with Nile red and Hoechst-3342 staining
Fluorescent dye, Nile red (Sigma-Aldrich, St. Louis, MO, USA) and Hoechst-33342 (Sigma-Aldrich, St. Louis, MO, USA) were used for detection of intracellular lipids and nuclei respectively. HepG2 cells (5×10⁴ cells/well) treated on 8 mm sterile cover slip in a 12 well plates were fixed (4% paraformaldehyde) and stained for 10 minutes in dark. The plates were then washed and mounted on a glass slide with a drop of polyvinyl alcohol and phenylenediamine mixture. The cover slips were later mounted on the glass slide with the cell surface facing the mowiol solution. The slides were allowed to dry and the images of the in vitro fatty liver model with pretreated phytoactives were captured using confocal microscope at 40×. The corrected total cell fluorescence of Nile red was measured using Image J software.
Quantitative Real time-Polymerase chain reaction (PCR)
Post treatment, HepG2 cells (1×10⁵ cells/well) were lysed using 1 mL Trizol reagent (Ambion, Life technologies, Waltham, MA, USA). Total RNA was isolated and complementary DNAs (cDNAs) were synthesized using cDNA reverse transcription kit as per manufacturer instructions using PCR thermal cycler (Applied Biosystems Inc-ABI, Waltham, MA, USA) [16]. Quantitative detection of fatty acid transport protein 5 (FATP5), stearoyl CoA desaturase (SCD), peroxisome proliferator activated receptor α (PPARα), carnitine palmitoyltransferase 1 (CPT1), forkhead box protein O1 (FOXO1), phosphoenolpyruvate carboxykinase (PEPCK) and β-actin were performed as shown in Table 1. Primer sequence of each gene synthesized by Sigma-Aldrich, India was used. RT-PCR amplification was performed in the total volume of 20 μL comprising of 10 μL SYBR Green (2×), 1 μL each of forward and reverse primer (10 μM), 4 μL nuclease-free water and 4 μL cDNA solution. PCR was run for 35 cycles using ABI-7500 Fast RT-PCR system. The conditions used were; denaturation at 95°C for 5 minutes, 35-40 cycles of 95°C for 15 seconds and annealing at 60°C for 1 minute, extension at 72°C for 1 minute and a final extension at 72°C for 5 minutes. The quantitative cycle (CQ) value of each gene was normalized with that of β-actin.
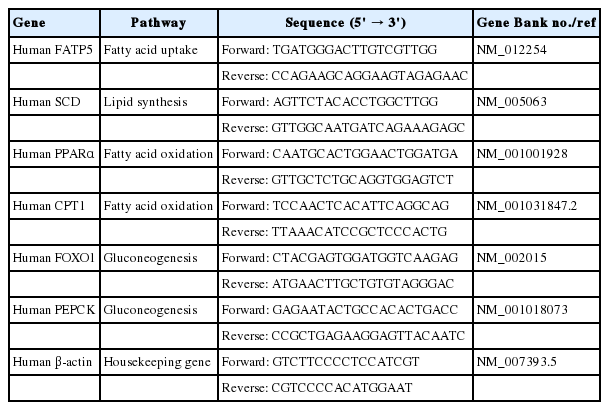
Gene-special primers used for real-time polymerase chain reaction
Western blot
The treated HepG2 (5×10⁵ cells/well) cells were harvested in RIPA buffer supplemented with anti-protease and anti-phosphate inhibitor cocktails (Sigma-Aldrich, St. Louis, MO, USA). Protein was quantified using BCA protein assay Kit (Thermo Fisher Scientific, Waltham, MA, USA). SDS-PAGE was performed using 40 μg of protein sample on a 10% denaturing SDS gel and transferred on polyvinylidene fluoride membrane (Bio-Rad Laboratories, Inc., Hercules, CA,USA) [17]. The blots were incubated with specific primary antibodies; anti-sterol regulatory element binding protein 1 (anti-SREBP-1) (Santacruz Biotechnology, Dallas, TX, USA, sc-366) (dilution 1:1,000), anti-PEPCK (Cell Signaling technology, Danvers, MA, USA, 6924) (dilution 1:1,000) and anti β-actin (Santacruz Biotechnology, Dallas, TX, USA, sc-81178) (dilution 1:1,000) followed by respective secondary antibody. The blot images were later captured using ChemiDoc™ XRS (Bio-Rad, Hercules, CA, USA). The blot intensity was quantified using Image J software.
Statistical analysis
The results are shown as the means±standard errors of mean (SEM). Differences were evaluated by one and two way analysis of variance (ANOVA) using Graph Pad Prism, Version 5 (GraphPad Software, Inc., La Jolla, CA, USA). A P-value <0.05(*), <0.01(**) and <0.001(***) was considered to be statistically significant.
RESULTS
Cytotoxic effect of FFAs, picroside I and II
The molecular structure of FFAs (oleic and palmitic acid), and phytoactives (picroside I, II and silibinin) are shown in Fig. 1A–D. HepG2 cells were treated with different concentrations of FFAs, 250 to 1,000 μM for 24 hours, to test for cytotoxicity. The FFAs mixture (oleic acid:palmitic acid/2:1) did not show any cellular damage at a concentration of 250 and 500 μM. At 1,000 μM, 21.2% cell death was observed. Since our aim was to study fatty liver model with minimal cytotoxicity, FFAs concentration of 250 and 500 μM was used for further work (Fig. 1E). The phytoactives, picroside I, II and silibinin (positive control), were also tested for their cytotoxic effects in HepG2 cells in the concentration range of 3 to 300 μM. Picroside I did not show any cell damage in HepG2 cells at a concentration range of 3 to 300 μM (Fig. 1F). On the other hand, picroside II inhibited cell growth by 24% at higher concentration of 300 μM (Fig. 1G). For both the phytoactives, optimal cell viability was observed up to 10 μM beyond which, some amount of cell death was observed. As reported earlier, silibinin was also found to inhibit cell growth by 23% at 300 μM (Fig. 1H) [14]. Therefore, a concentration of 10 uM was selected for phytoactive pretreatment.
Cytotoxic effect of FFAs and picroside I and II in HepG2 cells: The chemical structure of FFAs (A), picroside I (B), picroside II (C) and silibinin (D). HepG2 cells were loaded with different concentrations of FFAs (E), picroside I (F), picroside II (G), and silibinin (H) for 24 hours. Cytotoxicity was measured via MTT assay. Values are expressed as mean±SEM from four independent replicates. FFAs, free fatty acids; SEM, standard errors of mean. * P<0.05; ***P<0.001.
Lipid accumulation in HepG2 cells using FFAs
After treating HepG2 cells with 250 and 500 μM of FFAs for 20 hours, lipid accumulation was observed using ORO and Nile red stain. The morphological observations showed an increase in lipid accumulation with an increase in FFAs concentration (Fig. 2A). The quantitative analysis confirmed that the lipid accumulation was significantly higher at 500 μM (Fig. 2B, C). There was 14% and 50% increase in intracellular fat accumulation at 250 μM (ORO stain) and 500 μM respectively compared to control cells. The FFAs concentration of 500 μM, which resulted in highest lipid accumulation, was chosen for further analysis.
Effect of FFA challenge on lipid accumulation: HepG2 cells were loaded with FFA mixtures (250 and 500 μM) for 20 hours. Nile red and Hoechst-33342 staining (magnification 40×) (A), Nile red fluorescence intensity (B), and ORO colorimetric assay (C). The values are expressed as mean± SEM from six independent replicates. FFAs, free fatty acids; ORO, Oil Red O; SEM, standard errors of mean. * P<0.05; ***P<0.001.
Picroside II attenuates intracellular lipid accumulation
Two hours prior to FFAs challenge, the HepG2 cells were pretreated with picroside I, II and silibinin. Picroside I did not show any inhibitory activity on lipid accumulation and was thus not studied further. It was observed that picroside II reduced cellular lipids by 30% compared to FFAs treated group. Silibinin, a known hepatoprotective molecule, caused 22% reduction in lipid accumulation (Fig. 3).
Picroside II attenuates FFA-mediated lipid accumulation: HepG2 cells were pretreated with picroside II and silibinin at a concentration of 10 μM for 2 hours, followed by FFA (500 μM) challenge for another 20 hours. ORO staining (10×) (A), Nile red and Hoechst-33342 staining (B), ORO colorimetric assay (C), and Nile red fluorescence intensity (D). Values are expressed as mean±SEM from six independent replicates. FFAs, free fatty acids; ORO, Oil Red O; SEM, standard errors of mean. ***P<0.001.
Picroside II decreases transcription of genes involved in fatty acid uptake and synthesis
In order to examine the impact of FFAs loading on HepG2 cells, we investigated the expression of the genes involved in fatty acid metabolism. There was a 2-fold rise in the mRNA expression of FATP5 in FFAs treated cells as compared to control cells (Fig. 4A). On pretreatment with picroside II and silibinin, there was a significant downregulation in the expression of FATP5 compared to FFAs treated HepG2 cells.

Picroside II mitigates the transcription of genes involved in fatty acid uptake and synthesis: HepG2 cells were pretreated with picroside II and silibinin at a concentration of 10 μM, 2 hours prior to FFA (500 μM) loading for 20 hours followed by RT-PCR analysis of FATP5 (A), SCD (B) and Western blot analysis of SREBP-1 (C). Values are expressed as mean±SEM from four independent replicates. FFAs, free fatty acids; RT-PCR, reverse transcription polymerase chain reaction; FATP5, fatty acid transport protein 5; SCD, Stearoyl CoA desaturase; SREBP-1, sterol regulatory element binding protein-1; SEM, standard errors of mean. * P<0.05; **P<0.01; ***P<0.001.
Apart from an increase in FATP5 levels in FFAs treated group, a 2-fold rise in the mRNA expression of SCD was also observed (Fig. 4B). Concomitantly, there was an increase in SREBP-1 protein expression (Fig. 4C). Both picroside II and silibinin were found to significantly downregulate these lipogenic genes. There were no changes in the β-oxidation pathways as seen in the mRNA expression of CPT1 and PPARα in the FFAs treated group (Supplementary Fig. 1A, B). Picroside II and silibinin did not show any significant effect on the β-oxidation pathway.
Picroside II decreased activity of gluconeogenic genes
The mRNA expression of FOXO1 and PEPCK were significantly increased in the FFAs treated cells as compared to control cells (Fig. 5A, B). The upregulation in the protein expression of PEPCK was also observed (Fig. 5C). Pretreatment with picroside II and silibinin significantly downregulated the mRNA expression of FOXO1 and PEPCK compared to the FFAs treated HepG2 cells.
Picroside II decreases the expression of gluconeogenic genes: HepG2 cells were pretreated with picroside II and silibinin at a concentration of 10 μM 2 hours prior to FFA (500 μM) loading for 20 hours followed by RT-PCR analysis of FOXO1 (A), PEPCK (B), and Western blot analysis of PEPCK (C). Values are expressed as mean±SEM from four independent replicates. FFAs, free fatty acids; RT-PCR, reverse transcription polymerase chain reaction; FOXO1, forkhead box protein O1; PEPCK, phosphoenolpyruvate carboxykinase; SEM, standard errors of mean. * P<0.05; **P<0.01; ***P<0.001.
DISCUSSION
Considering the complexity of NAFLD and its rising prevalence globally, it is vital to find effective therapeutic modalities for its treatment. The current pharmacotherapies available for patients with NAFLD include thiazolidinediones, ursodeoxycholic acid, clofibrate, gemfibrozil, vitamin E, metformin, and betaine [6]. However, none of them have been proven to be efficient in clinical practice. Their limited efficacy in treating NAFLD, which involves deregulation of multiple pathways, could be because of their very specific target protein [18]. Additionally, life style management is also an alternative therapy used for treating NAFLD. Since the changes with diet and exercise are found to be short lived, long-term sustainability is a major challenge due to poor patient compliance [19,20].
In NAFLD, an increase in hepatic FFAs uptake, lipid synthesis, impaired β-oxidation, and decrease in lipid export facilitates accumulation of fat in the liver [21]. Hence, modulating the molecular mechanisms involved in hepatic lipid accumulation would provide competent therapeutic targets suitable for mitigating the scourge of NAFLD.
Over the past few years, phytochemicals from plants have received increasing attention for determining their activity and safety in basic model and clinical conditions [22]. With the use of Reverse pharmacology (RP) as a novel path to drug discovery from natural products, bedside observational hits can lead for bench side-exploratory studies (in vitro and in vivo ) and for subsequent use in clinical research [23]. Our group has been studying P. kurroa extensively for its hepatoprotective activity using RP [10-13]. In the present study too, we found that picroside II, an active constituent of P. kurroa , has the potential for halting lipid accumulation in NAFLD. Earlier, our group has demonstrated P. kurroa’s hepatoprotective activity in an in vivo Wistar rat model of NAFLD [24]. In this model, P. kurroa reversed hepatic fatty acid infiltration by decreasing liver lipid content and serum TG and cholesterol levels. P. kurroa also lowered alanine amino transferase and alkaline phosphatase levels, thereby signifying its anti-inflammatory activity in preventing NAFLD’s progression to NASH. However, in the above studies, the mechanism(s) by which P. kurroa’s constituents exerted their effect was not fully addressed. In support of our earlier work, the present study demonstrates that picroside II, decreased fatty acid accumulation by inhibiting FFAs uptake and synthesis.
Primary hepatocytes, derived from human liver samples, are an ideal in vitro model for studying hepatosteatosis. However, the paucity of obtaining normal clinical liver samples limits their use. As a consequence, the use of HepG2 cells as an alternative cellular model is considered acceptable [25]. Since oleic and palmitic acids are found in abnormally high concentration in liver TGs of steatotic patients, steatosis was simulated in HepG2 cells using these fatty acids [26]. We investigated the expression of genes involved in fatty acid uptake, lipogenesis, and utilization via β-oxidation. Several investigations have shown that FFAs enter the hepatocytes via facilitated transport via FATP5 [27]. FATP5 is a membrane-bound transport protein causing uptake of long chain FFAs across the plasma membrane. An increase in the expression of FATP5 has been reported in subjects with simple steatosis [28]. In our study too, we found a significant increase in the expression of FATP5 in response to FFAs treatment alone, suggesting an increase in hepatic FFAs uptake. Studies have shown that decreasing the expression of FATP5 could reduce lipid deposition in hepatocytes, in turn reversing steatosis. Also, knockdown of FATP5 in mice fed with a high fat diet reduced hepatic FFAs uptake, lipid accumulation, and decreased blood glucose levels [29]. We observed a remarkable reduction in the expression of FATP5 in picroside II intervention group, compared to FFAs treated group. This shows that picroside II attenuates the uptake of hepatic FFAs by decreasing the expression of FATP5 gene. Interestingly, as compared to silibinin, picroside II showed a greater trend in decreasing FFAs uptake and it needs to be studied further. Besides hepatic FFAs uptake, increased lipogenesis is known to contribute towards TG accumulation in the hepatocytes via activation of transcription factor SREBP-1 [30]. This in turn stimulates the expression of fatty acid synthase, acetyl CoA carboxylase and SCD causing an increase in lipogenesis [31]. In our FFAs treated HepG2 cells, we found a significant rise in the expression of SREBP-1 and SCD indicating an increase in formation and storage of TG in hepatic cytoplasm. Picroside II altered SREBP-1 and SCD dependent lipogenesis similar to silibinin. The decrease in the expression of SRBEP-1 and SCD highlights picroside II’s anti-lipogenic activity.
There is growing evidence that impaired mitochondrial β-oxidation contributes to increased liver lipid accumulation [32]. PPARα, a nuclear receptor expressed in liver, exerts its transcriptional effects on fatty acid oxidation genes. PPARα augments the transcription of CPT1, which is a rate limiting enzyme involved in fatty acid oxidation [33]. A decrease in PPARα and CPT1 limits the ability of the hepatocytes to oxidize FFAs leading to steatosis. Therefore, by modulating the expression of PPARα and CPT1 genes, hepatic steatosis can be alleviated. In our study, picroside II as well as silibinin did not cause any significant change in the β-oxidation pathway.
Hyperglycemia and/or insulin resistance are observed in patients with NAFLD increasing their probability to develop type 2 diabetes (T2D) [34]. In these cases, an increase in hepatic gluconeogenesis is observed due to increased expression of FOXO1 and PEPCK [35]. We observed that picroside II reduced the expression of FOXO1 and PEPCK significantly, like silibinin. These results underscore the potential of picroside II in mitigating the development of T2D in patients with NAFLD by decreasing gluconeogenic genes.
In the present study, picroside II attenuates hepatic lipid accumulation in HepG2 cells by decreasing FFAs uptake through FATP5, lipid synthesis via SREBP-1, and SCD. Further hepatic gluconeogenesis was downregulated with decrease in the expression of FOXO1 and PEPCK (Fig. 6). The activity of picroside II was found to be comparable to silibinin. The current findings suggest the need to study the activity of picroside II in other in vitro (primary hepatocytes, hepatic spherules or dual cell cultures with Kupffer cells) and in vivo models of NAFLD. Silibinin is a widely used hepatoprotective compound shown to prevent progressive liver injury by inhibiting lipotoxicity via modulation of oxidative stress and NFκB [36]. Since, overloading the hepatocytes with fatty acids increases oxidative stress, inflammation and mitochondrial dysfunction; it raises the need for further exploration of the efficacy of P. kurroa’s phytoactive in the NAFLD model system. These factors would be relevant to the progressive pathophysiology of NASH leading to chronic sequelae.
Proposed model for the protective action of picroside II in FFA-loaded HepG2 cells: Picroside II attenuated FFA accumulation in HepG2 cells via downregulation of FATP5, SREBP-1 and SCD, decreasing fatty acid uptake and lipid synthesis. Picroside II was also found to decrease the expression of FOXO1 and PEPCK resulting in decreased gluconeogenesis. Black dotted arrows indicates decrease in the expression of genes upon picroside II pretreatment. Red arrows indicates inhibitory activity of picroside II on the genes examined. FFAs, free fatty acids; FATP5, fatty acid transport protein 5; SREBP-1, sterol regulatory element binding protein-1; SCD, stearoyl CoA desaturase; FOXO1, forkhead box protein O1; PEPCK, phosphoenolpyruvate carboxykinase; IR, insulin resistance; CoA, coenzyme A; PPAR-a, peroxisome proliferator activated receptor α; TCA, tricarboxylic acid cycle.
Thus, our study shows that picroside II and silibinin remarkably decreases intracellular lipid content in FFAs treated HepG2 cells via modulation of free fatty acid uptake, lipogenesis and gluconeogenesis. Picroside II’s protective effect on inhibiting lipid accumulation highlights it as a potential molecular entity in reversing fatty liver.
Notes
Authors’ contribution
Conceptualization, Hiteshi Dhami-Shah and Ashok Vaidya; Investigation, Hiteshi Dhami-Shah (for Cell culture, ORO staining, MTT, Confocal imaging, RT-PCR, Western blot), Shiny Abhijit (for Confocal imaging), and Srividhya Raghavan (for Cell culture); Original draft, Hiteshi Dhami-Shah, Ashok Vaidya, Rama Vaidya, and Shobha Udipi; Funding acquisition, Hiteshi Dhami-Shah; Supervision, Muthuswamy Balasubramanyam, Ashok Vaidya, Rama Vaidya, Shobha Udipi, and Viswanathan Mohan.
Acknowledgements
We thank the Department of Science & Technology, Government of India, for the research grant under Women Scientist-A program (SR/WOS-A/LS-1135/2014). We also thank S.N.D.T Women’s University, Madras Diabetes Research Foundation and Kasturba Health Society for the support in terms of infrastructure and encouragement. A special thanks to Dr. Tandrika Chattopadhyay (Tata Institute of Fundamental Research) for guiding us with writing the manuscript.
Notes
Conflict of Interest
The authors have no conflicts to disclose.
SUPPLEMENTAL MATERIAL
Supplementary materials are available at Clinical and Molecular Hepatology website (http://www.e-cmh.org)
Picroside II effects on β-oxidation genes: HepG2 cells were pretreated with picroside II and silibinin at a concentration of 10 μM, 2 hours prior to FFA (500 μM) loading for 20 hours followed by RT-PCR analysis of PPARα (A) and CPT1 (B). Values are expressed as mean±SEM from four independent replicates. FFAs, free fatty acids; RT-PCR, reverse transcription polymerase chain reaction; PPARα, peroxisome proliferator activated receptor α; CPT1, carnitine palmitoyltransferase 1; SEM, standard errors of mean.
Abbreviations
cDNAs
complementary DNAs
CPT1
carnitine palmitoyltransferase 1
FATP5
fatty acid transporter protein 5
FFAs
free fatty acids
FOXO1
forkhead box protein O1
NAFLD
nonalcoholic fatty liver disease
ORO
oil red O
PEPCK
phosphoenolpyruvate carboxykinase
P. kurroa
Picrorhiza kurroa
PPARα
peroxisome proliferator activated receptor α
RP
reverse pharmacology
SCD
stearoyl CoA desaturase
SREBP-1
sterol regulatory element binding protein-1
TG
triglyceride
T2D
type 2 diabetes
VLDL
very low density lipoprotein