Biliary hamartoma presented as a single mass
Article information
INTRODUCTION
Biliary hamartoma or bile duct hamartoma is a rare benign hepatic lesion. It is also known as von Meyenburg complex, and is one of ductal plate malformation in adults.1 Pathologically, biliary hamartoma is composed of disorganized bile ducts and ductules and fibrocollagenous stroma.2 Biliary hamartoma usually presents as multiple small nodules.1-4 But in case of single or large hamartoma, its radiological diagnosis is very difficult, and the lesion is confused with metastasis or abscess. So histopahologic examination is required for final diagnosis.
In this report, two cases of biliary hamartomas that manifested as a single lesion making their pre-operative diagnosis difficult are presented.
CASE
Case 1
A 62-year-old female was admitted to hospital for the evaluation of incidentally detected hepatic lesion. She took health examination at local hospital, and a hepatic mass was detected on ultrasonography (US). She did not present specific symptoms such as abdominal pain or anorexia. Physical examination revealed no specific findings such as hepatomegaly.
The laboratory findings did not show abnormal finding. Hematologic study showed red blood cell (RBC) count of 4.7×10⁶ /mm3, hemoglobin level of 14.3 g/dL, and hematocrit of 42.1%. White blood cell (WBC) count was 5,100/mm3 and platelet count was 228,000/mm3. Biochemical tests showed that the serum level of alanine aminotransferase (ALT) was 22 IU/L, aspartate aminotransferase (AST) was 15 IU/L, and alkaline phosphatase (ALP) was 85 IU/L. Serum protein was 7.6 g/dL and albumin was 4.8 g/dL. Total bilirubin was 0.9 mg/dL. Alpha-fetoprotein (AFP) was 1.6 ng/mL, and carcinoembryonic antigen (CEA) was 2.5 ng/mL. The result for hepatitis B surface antigen (HBsAg) was negative and anti-HBs was positive.
US showed about a 4-cm sized cystic liver mass in right lobe (Fig. 1). It showed irregular margin with internally homogenous fluid-like echo with several peripheral echogenic septa-like structures. Precontrast computed tomography (CT) scan showed a lobulating contoured homogenous low attenuated mass in right lobe posterior superior segment. The attenuation was measured as about 10 Hounsfield number that indicated clear fluid. After contrast media injection, arterial phase and portal phase images were taken, and there was no contrast enhancement in the mass (Fig. 2A, 2B). Radiological diagnosis was biliary cystadenoma or cystadenocarcinoma. So operation was done. Pathologic specimen showed a subcapsular multilocular cystic mass. Final histopathologic diagnosis was biliary hamartoma with cystic dilatation.
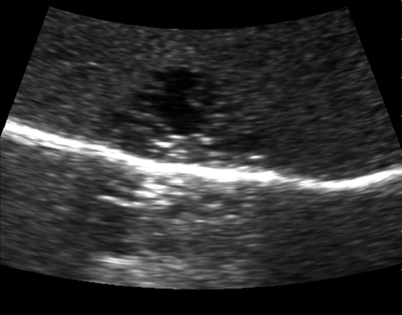
Ultrasonography scan of 62-year-old female (case 1) showeda a cystic mass in right lobe peripheral area. It had irregular margin and peripheral septa-like structures.
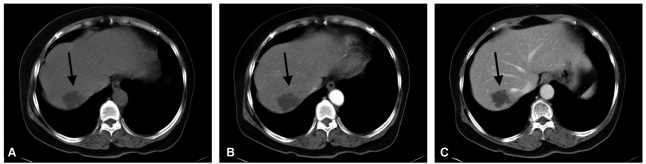
Dynamic CT scans of the above patient. (A) Precontrast scan showed homogenous low-attenuated mass in liver dome peripheral area. (B) Arterial phase and (C) portal phase of CT scan. After contrast enhancement, there was no enhancing portion of the lesion.
Case 2
A 79-year-old male was admitted with the complaint of bowel habit change. Sigmoidoscopy revealed a fungating mass at 20 cm above anal verge. Biopsy was done and the mass was confirmed as mucinous adenocarcinoma. He had lost 3 Kg weight during 2 months. Physical examination revealed no specific findings such as hepatomegaly.
The laboratory findings showed RBC count of 3.7×10⁶/mm3, hemoglobin level of 11.0 g/dL, and hematocrit of 33.9%. WBC count was 7,100/mm3 and platelet count was 178,000/mm3. Biochemical tests showed that the serum level of ALT was 10 IU/L, AST was 12 IU/L, and ALP was 86 IU/L. Serum protein was 7.3 g/dL and albumin was 3.7 g/dL. Total bilirubin was 0.7 mg/dL. AFP was not evaluated, and CEA was 1.7 ng/mL. The results for HBsAg and anti-HBs were negative.
For staging work up, US and CT scan were done. US showed a 1 cm-sized echogenic mass in right lobe anteriorinferior segment (Segment V) (Fig. 3). CT scan showed an ulcerofungating mass in sigmoid colon and several enlarged lymph nodes in mesosigmoid. The Liver nodule was presented as 1 cm sized, ill-defined low attenuated nodule in hepatic subcapsular area of segment V. The nodule showed peripheral subtle rim-like enhancement (Fig. 4). So it was suspected as hepatic metastasis.

Ultrasonography scan of 79-year-old male (case 2) showed a 1cm-sized round echogenic mass in liver subcapsular area (arrow).

CT scan presented the low attenuated nodule in liver. It showed subtle peripheral rim-like enhancement (arrow).
Magnetic resonance imaging (MRI) was taken (Fig. 5). The hepatic nodule showed low signal intensity on T1-weighted image, and high signal intensities on T2-weighted image and diffusion image. After contrast enhancement with Gadoxetic acid (gadolinium-EOB-DTPA, Primovist, Bayer-Schering, Berlin, Germany), it showed subtle rim-like enhancement. On hepatobiliary phase, and it showed hypointensity. Differential radiological diagnosis included the possibilities of metastasis or atypical hemangioma. Fluorodeoxyglucose positron emission tomography (FDG-PET) scan showed no hypermetabolic lesion in right lobe of liver.

MRI scans. (A) T1 weighted image showed low signal intensity nodule in segment V (arrow). (B) On T2 weighted image, the nodule showed high signal intensity (arrow). (C) Enhanced image after 50 seconds after contrast media injection, and (D) enhanced scan after 3 minutes. The nodule showed subtle peripheral enhancement (arrow). (E) On hepatobiliary phase, the nodule presented as hypointensity lesion in liver (arrow).
Anterior resection for sigmoid colon cancer was done, and tumorectomy was also done for hepatic nodule. The hepatic mass was well-demarcated, pinkish white solid mass without necrosis or hemorrhage. Histopathologic diagnosis was bile duct hamartoma.
DISCUSSION
The biliary hamartoma is a rare hepatic lesion described for the first time in 1918 by Von Meyenburg.1 It is consistent with biliary duct deformity and disorganization, forming cystic structures varying in sizes.3 It is hepatic malformations hypothesized to be a consequence of interrupted remodelling of the ductal plates during the late phase of embryologic development of the small intra-hepatic bile ducts.5 Histologically, they demonstrate focal disorderly collections of dilated intra-hepatic bile ducts, which are lined by a single layer of columnar, cuboidal, or flattened epithelium, embedded within a dense fibrous stroma.1 Its incidence is known as 0.69%.6 Biliary hamartoma is benign asymptomatic lesion without clinical significance, but malignant change to cholangiocarcinoma is also reported.7,8
Biliary hamartoma is usually multiple and small well-circumscribed nodules ranging from 1 mm to 1.5 cm. But in some cases, it may presents as a single mass or coalescent large mass. Radiologically it can present from single well-circumscribed small nodule to numerous nodules evenly scattered in liver parenchyma, or large nonspecific mass. However, usual biliary hamartoma presents as hamartomatosis with numerous nodules. US shows numerous echogenic or hypoechoic nodules in liver and the nodules can accompany comet tail artifact.4 When the nodules are innumerable, those heterogenous tiny nodules can mimic chronic hepatitis. Differences in echogenicity of each nodule may be due to the size of the dilated bile duct component, which, at a certain size, would behave like other microcystic structures and demonstrate echogenicity.1
CT demonstrates multiple small hypoattenuated nodules that scattered in whole liver parenchyma. Usually tiny nodules do not present contrast enhancement. But in some large nodules with abundant fibrous stroma, it can show contrast enhancement. On MRI, the nodules show low signal intensity on T1-weighted images, and high signal intensity on T2 weighted image.1,9 High signal intensity on T2-weighted image is due to cystic nature of the lesion, and numerous nodules in liver makes so-called "starry sky appearance" on T2-weighted image with multiple high signal intensity spots on dark background liver parenchyma. On MR cholangiopancreatography, the lesions do not demonstrate communications with bile duct, and bile duct shows normal appearance.4,9 After contrast enhancement, the lesions usually do not show enhancement, but sometimes it may demonstrate thin rim enhancement with gadolinium. This is considered due to the compressed liver parenchyma that surrounds the lesions and inflammatory cell infiltrates at histological analysis.9
The practical problem of biliary hamartoma is that multiple hamartomas can be confused with metastasis, microabscess, simple cysts and even lymphoma. MRI can help to differentiate with metastasis. On heavily T2 weighted image, hamartomas show still bright high signal intensity unlike metastasis. Because of higher tissue contrast resolution of MRI than CT, MRI can demonstrate tiny nodules with high signal intensity on T2 weighted image better than CT. Consequently, the lesions can be manifested as "starry sky" appearance in the case of usual numerous hamartomatosis. So, most of biliary hamartomatosis does not require pathological confirmation nowadays when it presents typical radiological appearance. But, when the lesion presents peripheral enhancement like the case 2, or when the lesion presents a large single lesion like the case 1, it can cause diagnostic confusion even with MRI. It is true especially when the patient have another known malignancy. In those atypical cases such as single or enhancing lesion, pathological confirmation may be required for final diagnosis.
SUMMARY
Usual biliary hamartomatosis presents as numerous small, non-enhancing nodules in liver. However, in some cases, it can presents as a single solid or cystic mass with various contrast enhancement pattern.
Abbreviations
CT
computed tomography
FDG-PET
fluorodexoyglucose positron emission tomography
MRCP
MR cholangiopancreaticography
MRI
magnetic resonance imaging
US
ultrasonography