The usefulness of metabolic score for insulin resistance for the prediction of incident non-alcoholic fatty liver disease in Korean adults
Article information

Abstract
Background/Aims
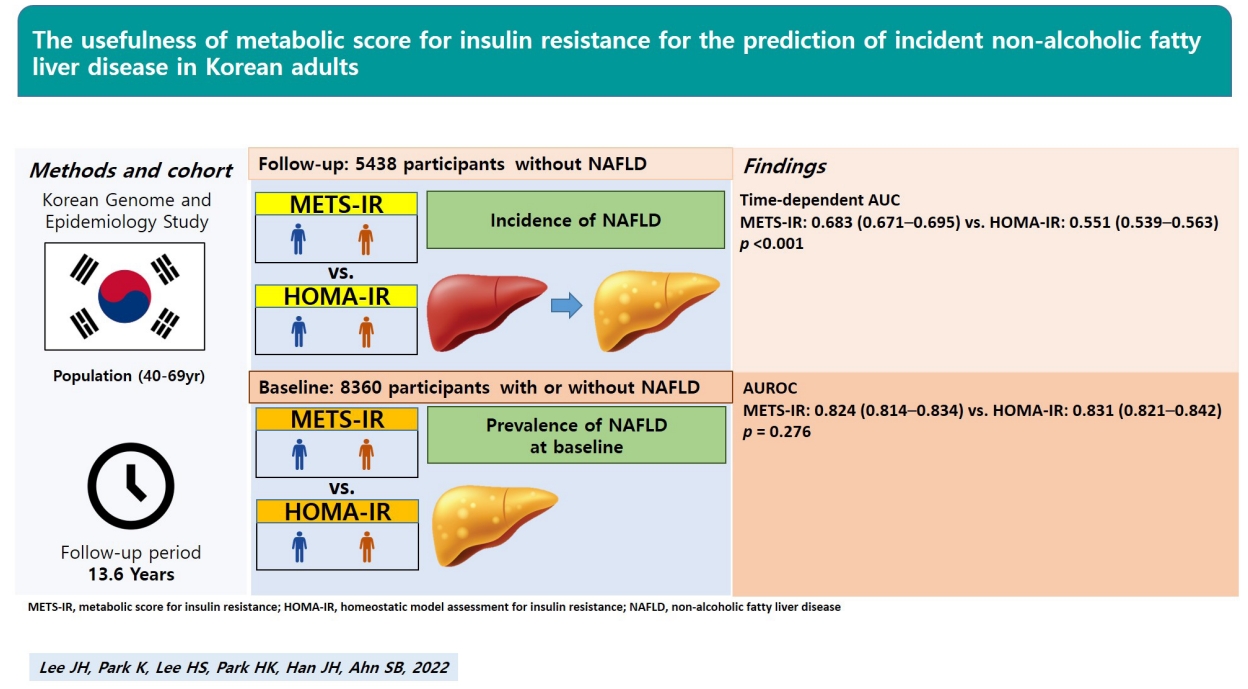
The early detection and prevention of non-alcoholic fatty liver disease (NAFLD) has been emphasized considering the burden of this disease. Both hepatic and peripheral insulin resistances are strongly associated with NAFLD. We aimed to compare the predictive powers of a hepatic insulin resistance index, the homeostatic model assessment for insulin resistance (HOMA-IR), and a novel peripheral insulin resistance index, the metabolic score for insulin resistance (METS-IR), for the prediction of prevalent and incident NAFLD.
Methods
Data from 8,360 adults aged 40–69 years at baseline and 5,438 adults without NAFLD who were followed-up at least once after the baseline survey in the Korean Genome and Epidemiology Study were analyzed. The survey was performed biennially, up to the eighth follow-up.
Results
The predictive powers of the METS-IR and HOMA-IR for prevalent NAFLD were not significantly different (area under the receiver operating characteristic [ROC] curve [95% confidence interval]: METS-IR, 0.824 [0.814–0.834]; HOMA-IR, 0.831 [0.821–0.842]; P=0.276). The area under the time-dependent ROC curve (Heagerty’s integrated area under the curve) of the METS-IR for incident NAFLD was 0.683 (0.671–0.695), significantly higher than that of the HOMA-IR (0.551 [0.539–0.563], P<0.001).
Conclusions
The METS-IR is superior to the HOMA-IR for the prediction of incident NAFLD and is not inferior to the HOMA-IR for the prediction of prevalent NAFLD. This suggests that the METS-IR can be a more useful insulin resistance index than the HOMA-IR for the early detection and prevention of NAFLD in Korean population.
Graphical Abstract
INTRODUCTION
Non-alcoholic fatty liver disease (NAFLD) is the most common chronic liver disease worldwide. Its global prevalence increased from 20% in 2010 to 25% in 2018 [1], and, in the Republic of Korea, it increased from 29.0% (2001–2007 average) to 31.0% (2008–2014 average) [2]. The incidence rate of NAFLD in Hong Kong is approximately 34/1,000 population per year [3]. Established major risk factors include diabetes mellitus (DM), obesity, dyslipidemia, and metabolic syndrome, all of which are closely related to insulin resistance [4-6]. Therefore, the European Association for the Study of the Liver recommends that patients with insulin resistance and/or metabolic risk factors should undergo diagnostic tests for NAFLD [7].
Current evidence suggests that both hepatic and peripheral insulin resistance are strongly associated with NAFLD [8-13]. Hepatic insulin resistance refers to impaired suppression of glucose production and lipid synthesis by insulin in the hepatocytes [10]. It restricts the receptor-mediated entry of insulin into the liver and, consequently, impairs insulin clearance. At the same time, there is an increase in insulin secretion (hyperinsulinemia), contributing to hepatic steatosis [11]. Peripheral insulin resistance is also associated with an increased concentration of intrahepatic triglycerides [12]. It may contribute to liver steatosis by impairing the ability of insulin to suppress lipolysis, resulting in an increased delivery of free fatty acids to the liver, as well as by hyperinsulinemia, which stimulates de novo lipogenesis via sterol regulatory element binding protein-1c [13].
The gold standard method for direct evaluation of systemic insulin resistance is the euglycemic-hyperinsulinemic clamp (glucose clamp) [14]. Because of its invasiveness and high cost, however, indirect methods are generally used in clinical practice. The homeostatic model assessment for insulin resistance (HOMA-IR) is the most widely used insulin resistance index because of its strong correlation with the glucose clamp and its reflection of hepatic insulin resistance [15]. As hepatic insulin resistance is closely related to NAFLD, the HOMA-IR is commonly used in research to verify the relationship between insulin resistance and NAFLD [16,17]; however, this fails to take account of the contribution of peripheral insulin resistance to hepatic steatosis [9,13]. Meanwhile, the novel metabolic score for insulin resistance (METS-IR) is predictive of visceral fat and diabetes, was validated against the glucose clamp, and reflects peripheral insulin resistance [18]. Although it was validated in a Latin American population, its usefulness for the prediction of NAFLD in East Asian individuals is unclear.
Therefore, this study aimed to compare the use of the HOMA-IR and METS-IR for the prediction of prevalent and incident NAFLD in a large, community-based, prospective Korean cohort.
MATERIALS AND METHODS
Study population
All data originated from the Korean Genome and Epidemiology Study (KoGES), a longitudinal, prospective cohort study conducted by the Korea Centers for Disease Control and Prevention to evaluate the risk factors for non-communicable diseases [19]. In total, 10,030 adults, aged 40 to 69 years and living in urban (Ansan) and rural (Ansung) areas, were recruited into the KoGES_Ansan_Ansung cohort and studied biennially, beginning with the baseline survey conducted in 2001– 2002 and ending with the eighth follow-up in 2017–2018. Among 10,030 participants at baseline, 633 cumulative deaths were recorded between baseline and the fifth follow-up [19]. The participation rates for the first to sixth follow-ups were 86.1%, 76.0%, 68.2%, 68.9%, 65.3%, and 62.8%, respectively [19]. In addition, the eighth follow-up was conducted in 6,157 participants [20].
From the 10,030 participants in the baseline survey, we excluded 1) those with a history of hepatitis (n=423); 2) men with alcohol consumption ≥30 g/day or women with alcohol consumption ≥20 g/day (n=964); 3) those with insufficient data for calculation of the NAFLD-liver fat score (n=276); and 4) those with insufficient data for calculation of the METS-IR and/or HOMA-IR (n=7) (Fig. 1). We analyzed the data from the remaining 8,360 participants (6,142 participants without NAFLD and 2,218 participants with NAFLD) to compare the predictive power for the prevalence of NAFLD of METS-IR and HOMA-IR.
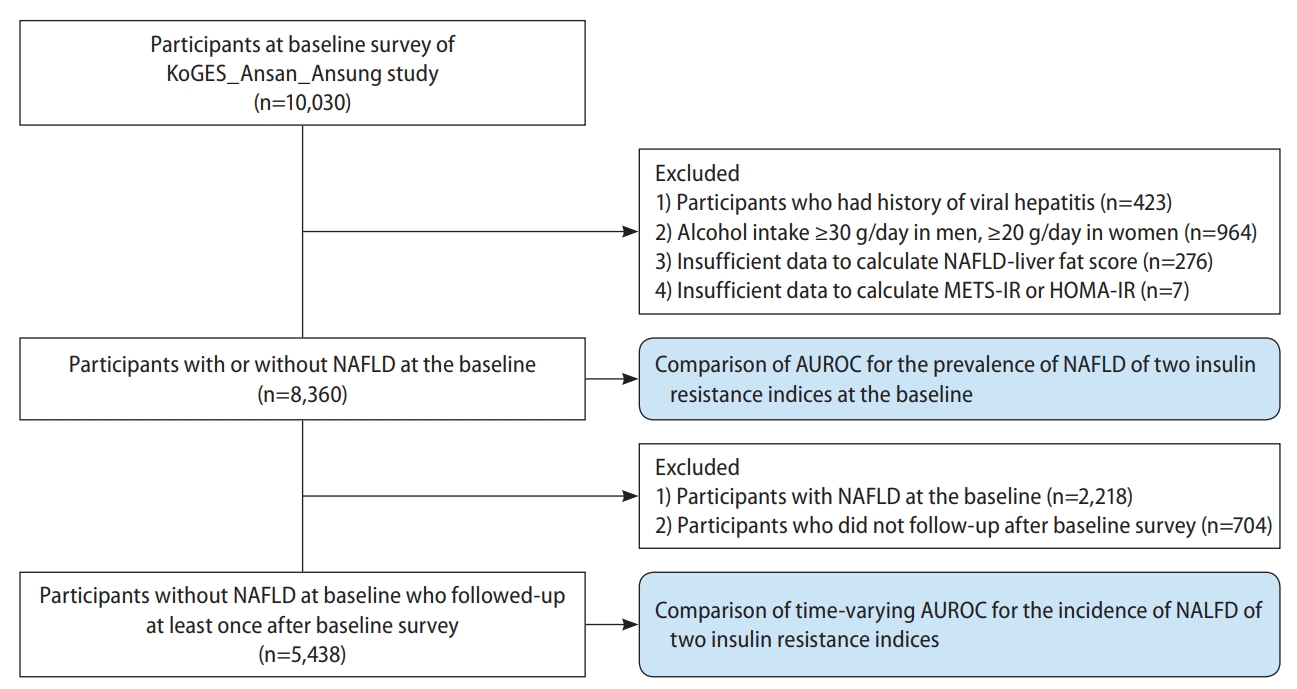
Flow chart of the study population selection. KoGES, Korean Genome and Epidemiology Study; METS-IR, metabolic score for insulin resistance; HOMA-IR, homeostatic assessment for insulin resistance; NAFLD, non-alcoholic fatty liver disease; AUROC, area under the receiver operating characteristic curve.
Moreover, to compare the predictive power for the incidence of NAFLD of METS-IR and HOMA-IR, we also analyzed the data from a total of 5,438 participants without NAFLD at baseline after excluding 1) those with NAFLD at baseline (n=2,218) and 2) those without follow-up data (n=704) from 8,360 participants without NAFLD at baseline.
The KoGES_Ansan_Ansung cohort protocol was reviewed and approved by the Institutional Review Board (IRB) of the Korea Centers for Disease Control and Prevention. All the participants gave written informed consent. This study protocol conformed to the ethical guidelines of the 1964 Declaration of Helsinki and its later amendments and was approved by the IRB of Nowon Eulji Medical Center (IRB No. 2021-09-025).
Measurements
Weight and height were measured to the nearest 0.1 kg and 0.001 m, respectively, for calculation of the body mass index (BMI; kg/m2). Waist circumference (WC; cm) was measured in the horizontal plane, midway between the lowest rib and the iliac crest. After at least 5 minutes of rest in a sitting position, the patient’s systolic blood pressure (SBP) and diastolic blood pressure (DBP) were measured. SBP and DBP were defined as the average of the last two of three measured values, with at least a 1-minute interval between each. We calculated the mean blood pressure (MBP) as DBP + 1/3 × (SBP − DBP).
Participants were categorized into four groups according to smoking status: never smoker, former smoker, some day smoker, or every day smoker [21]. A current drinker was defined as a man or woman who respectively drank ≤30 g or ≤20 g alcohol per day. Physical activity was measured as metabolic equivalent of task (MET)-hours per week (MET-hr/wk), according to participants’ self-reported hours spent sleeping, being sedentary (0 MET), and being engaged in very light (1.5 MET), light (3 MET), moderate (5 MET), and heavy (7 MET) physical activities [22]. Participants were categorized into three groups according to hr/wk of physical activity: low (<7.5 MET-hr/wk), moderate (7.5–30 MET-hr/wk), and high (>30 MET-hr/wk) [23].
Blood samples of each participant were collected after at least 8 hours of fasting and analyzed with a Hitachi 700-110 Chemistry Analyzer (Hitachi, Ltd., Tokyo, Japan). Concentrations of fasting plasma glucose (FPG), serum insulin, high-density lipoprotein (HDL) cholesterol, triglycerides, aspartate aminotransferase (AST), alanine aminotransferase (ALT), and C-reactive protein (CRP) were measured. Low-density lipoprotein (LDL) cholesterol was calculated by using the Friedewald equation in the case of a triglyceride concentration <400 mg/dL [24].
Participants’ dietary intake was assessed by using a validated, semi-quantitative, 103-item food frequency questionnaire [25]. Daily total energy intake (kcal/day) was calculated.
DM was defined as having an FPG concentration ≥126 mg/dL, plasma glucose concentration 2 hours after a 75-g oral glucose tolerance test ≥200 mg/dL, glycosylated hemoglobin ≥6.5%, being treated with anti-diabetic medications, or being treated with insulin therapy [26]. Hypertension (HTN) was defined as having an SBP ≥140 mmHg and/or a DBP ≥90 mmHg or being treated with anti-hypertensive medications [27]. Dyslipidemia was defined as having concentrations of serum total cholesterol ≥240 mg/dL, LDL cholesterol ≥160 mg/dL, HDL cholesterol <40 mg/dL, or triglyceride ≥200 mg/dL, or being treated with lipid-lowering agents [28].
Assessment of insulin resistance
The METS-IR and HOMA-IR were calculated by using the following formulas [15,18]: (1) METS-IR = ln (2 × FPG [mg/dL] + fasting serum triglyceride [mg/dL]) × BMI (kg/m2) / ln (HDL cholesterol [mg/dL]); (2) HOMA-IR = (fasting serum insulin [μIU/mL] × FPG [mg/dL] / 405).
Assessment of NAFLD
NAFLD was defined as the NAFLD-liver fat score, calculated as follows: (3) NAFLD-liver fat score = −2.89 + 1.18 × metabolic syndrome (yes: 1, no: 0) + 0.45 × DM (yes: 2, no: 0) + 0.15 × insulin (µIU/mL) + 0.04 × AST (U/L) – 0.94 × AST/ALT. An NAFLD-liver fat score >−0.640 was considered indicative of NALFD [29].
Statistical analysis
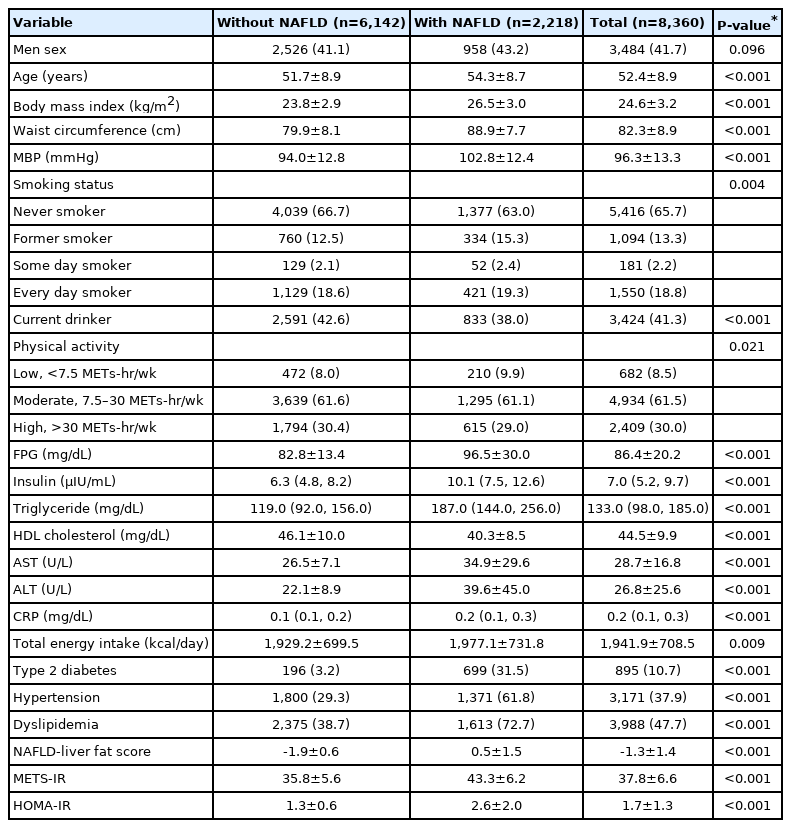
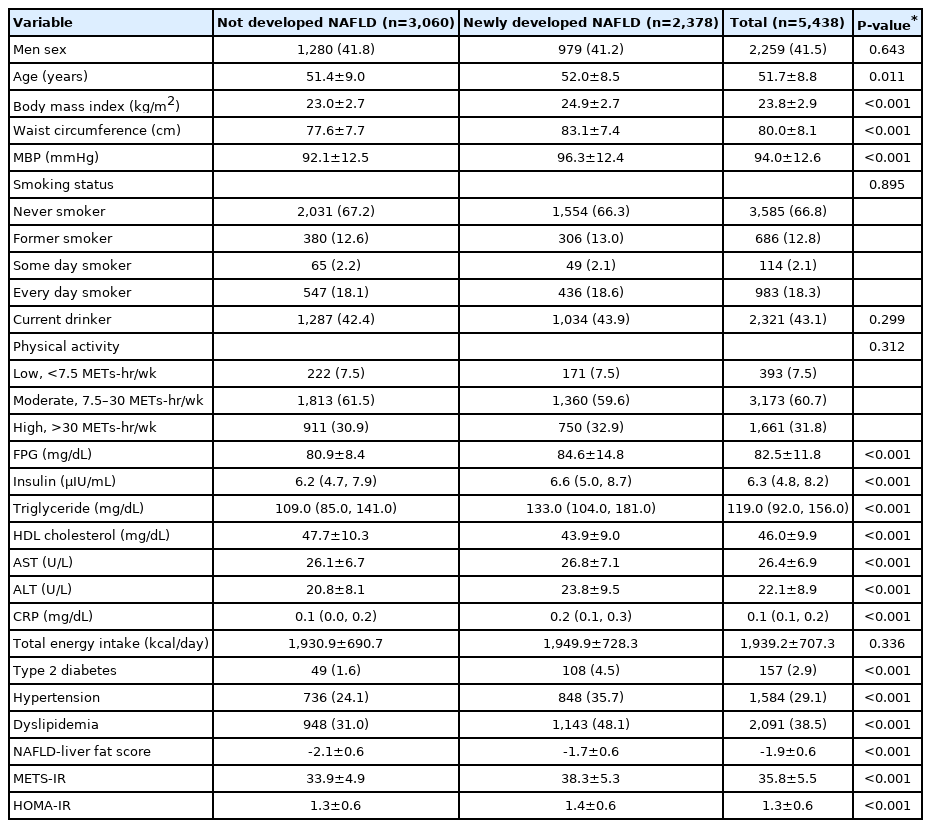
Clinical characteristics of the 8,360 included participants were compared between those with and those without NAFLD at baseline. Baseline characteristics of the 5,438 participants without NAFLD at baseline were compared between those who developed NAFLD after the baseline survey and those who did not. Categorical variables including sex, smoking status, drinking status, physical activity, DM, HTN, and dyslipidemia were analyzed by using chi-square test and are presented as number (%). Some continuous variables including age, BMI, WC, MBP, FPG, HDL cholesterol, AST, ALT, total energy intake, NAFLD-liver fat score, METS-IR value, and HOMA-IR, which showed P-value for Kolmogorov-Smirnov test ≥0.05, were analyzed by using Student’s t-test and are presented means±standard deviations. The other continuous variables including insulin, triglyceride, and CRP, which showed P-value for Kolmogorov-Smirnov test <0.05, were analyzed by using Mann-Whitney test and are presented as medians (25th percentile, 75th percentile).
For the 8,360 participants at baseline, the predictive powers of the indices for prevalent NAFLD were compared by using area under the receiver operating characteristic (ROC) curves (AUCs). The cut-off points for such prediction were calculated by using the Youden index [30].
For the 5,438 participants without NAFLD at baseline, a Cox proportional-hazards model was fitted with spline curves to determine the dose-response relationship between each index and incident NAFLD. We calculated the hazard ratio (HR) with its 95% confidence interval (CI) for incident NAFLD for each 1-point increase in each index by using univariable and multivariable Cox proportional-hazards regression analysis. In model 1, we adjusted for age, sex, BMI, WC, physical activity, smoking status, and current drinking status. In model 2, we further adjusted for total caloric intake, serum CRP concentration, DM, HTN, dyslipidemia, and serum ALT concentration. The indices’ predictive powers and discriminatory capabilities for incident NAFLD were assessed by using Harrell’s concordance index and time-dependent ROC curve analysis [31-34]. Heagerty’s integrated AUC (iAUC), Heagerty’s AUC at 8 years, and Heagerty’s AUC at 16 years were used as time-dependent AUCs, with an unadjusted survival analysis framework approach [32-34]. We used a bootstrapping method to calculate the differences and 95% CIs of Heagerty’s iAUC and AUC between the indices. Contal and O’Quigley’s method was used to calculate cut-off points for the prediction of incident NAFLD with the indices [35]. Subgroup analysis by obesity status and DM status were performed and are presented as a forest plot.
All statistical analyses were performed with SAS statistical software (version 9.4; SAS Institute Inc., Cary, NC, USA) and R software (version 4.1.1; R Foundation for Statistical Computing, Vienna, Austria). The significance level was set at P<0.05.
RESULTS
Characteristics of the study population
The number of participants with NAFLD was 2,218. The mean age, BMI, WC, MBP, total caloric intake, NAFLD-liver fat score, METS-IR, and HOMA-IR; the mean concentration of FPG, serum AST, and ALT; as well as the median concentrations of serum insulin, triglycerides, and CRP were higher in participants with than in those without NAFLD at baseline (Table 1). There was a higher proportion of former smokers and more participants who were in engaged in low amounts of physical activity, had DM, had HTN, and had dyslipidemia among those with NAFLD at baseline. The mean value of HDL cholesterol and the proportion of current drinkers were lower in participants with NAFLD at baseline.
Baseline characteristics of the population with or without NAFLD at the baseline survey
The mean age, BMI, WC, MBP, NAFLD-liver fat score, METS-IR, and HOMA-IR; the mean concentrations of FPG, serum AST, and ALT; as well as the median concentrations of serum insulin, triglycerides, and CRP were higher in participants who developed NAFLD after baseline than in those who did not (Table 2). The proportions of participants with DM, HTN, and dyslipidemia were also higher in participants who developed NAFLD, whereas the mean value of HDL cholesterol was lower in participants who developed NAFLD.
Baseline characteristics of participants without NAFLD at baseline who followed-up at least once after baseline survey
During a total of 55,887.0 person-years of follow-up, 2,378 participants (43.7%) newly developed NAFLD. The mean follow-up time was 13.6 years, the incidence rate per 1,000 person-years was 42.6, and the incidence rate per 2 years ranged from 4.1 to 11.0 (Table 3).
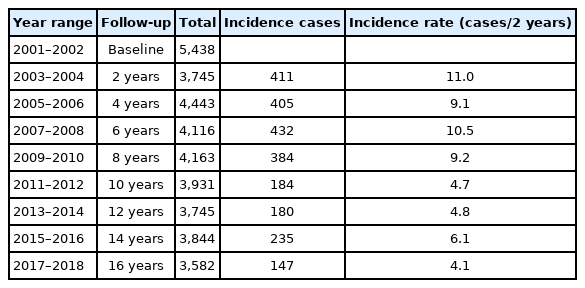
Incidence of non-alcoholic fatty liver disease during follow-up
Comparison of predictive power between the indices for prevalent NAFLD
The AUCs of the METS-IR and HOMA-IR were 0.824 (0.814–0.834) and 0.831 (0.821–0.842), respectively, with no significant difference in their predictive powers (P=0.276) (Fig. 2). The cut-off points for the prediction of prevalent NAFLD with the METS-IR and HOMA-IR were 39.3 and 1.8, respectively.

Comparison of predictive power for prevalent non-alcoholic fatty liver disease of metabolic score for insulin resistance and homeostasis model assessment for insulin resistance. For the 8,360 participants at baseline, the predictive powers for prevalent NAFLD of METS-IR and HOMA-IR were compared by using area under the receiver operating characteristic curves. The cut-off points for such prediction were calculated by using the Youden index. ROC, receiver operating characteristic; NAFLD, non-alcoholic fatty liver disease; METS-IR, metabolic score for insulin resistance; HOMA-IR, homeostatic assessment model for insulin resistance; AUC, area under the receiver operating characteristic curve.
Longitudinal relationship between the indices and incident NAFLD
There was a positive dose-response association between the METS-IR and incident NAFLD, whereas the HOMA-IR had a J-shaped association with incident NAFLD (Fig. 3). The HR for incident NAFLD for each 1-point increase in the METS-IR and the HOMA-IR were 1.12 (95% CI, 1.11–1.13) and 1.41 (95% CI, 1.32–1.51), respectively (Table 4). In model 2, the adjusted HR were 1.11 (95% CI, 1.09–1.13) and 1.30 (95% CI, 1.21–1.39), respectively.
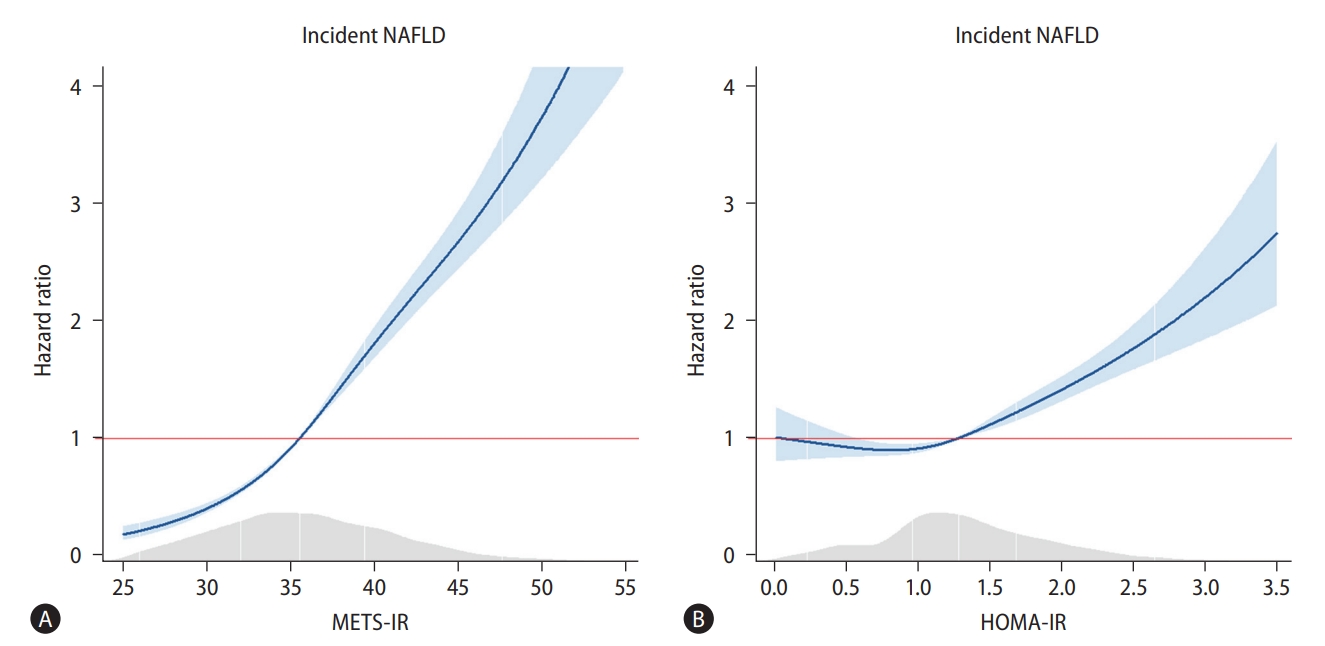
Cox proportional spline curves showing dose-response association between metabolic score for insulin resistance/homeostatic model assessment for insulin resistance and the incidence of non-alcoholic fatty liver disease. (A) Metabolic score for insulin resistance. (B) Homeostatic model assessment for insulin resistance. For the 5,438 participants without NAFLD at baseline, a Cox proportional-hazards model was fitted with spline curves to determine the dose-response relationship between METS-IR/HOMA-IR and incident NAFLD. METS-IR, metabolic score for insulin resistance; NAFLD, non-alcoholic fatty liver disease; HOMA-IR, homeostatic assessment model for insulin resistance.

Cox proportional hazard regression model for incident non-alcoholic fatty liver disease of two different insulin resistant indices
Comparison of predictive power of the two indices for incident NAFLD
Harrell’s concordance index of the METS-IR was 0.697 (95% CI, 0.689–0.705), which was significantly higher than that of the HOMA-IR (0.556; 95% CI, 0.546–0.566; P<0.001) (Table 5). Similarly, Heagerty’s iAUC of the METS-IR was 0.683 (95% CI, 0.671–0.695), higher than that of the HOMA-IR (0.551; 95% CI, 0.539–0.563; P<0.001). Heagerty’s incident/dynamic AUC for the METS-IR at 8 years (0.669; 95% CI, 0.663–0.675) and at 16 years (0.670; 95% CI, 0.662–0.678) were also higher than that of the HOMA-IR (0.557; 95% CI, 0.553–0.561 and 0.556; 95% CI, 0.548–0.564, respectively; both P<0.001). The cut-off points for prediction of incident NAFLD with the METS-IR and HOMA-IR were 35.7 and 1.4, respectively. The joint use of the METS-IR and HOMA-IR for the prediction of incident NAFLD did not significantly differ from that with the METS-IR alone, except at 8 years, for which the predictive value of the two indices combined was higher than that of the METS-IR alone. Figure 4 presents a forest plot showing the predictive power for incident NAFLD by subgroups according to obesity and DM status. The Heagerty’s iAUCs of the METS-IR was 0.674 (95% CI, 0.627–0.721) in the DM subgroup, 0.655 (95% CI, 0.639–0.671) in the non-DM subgroup, 0.610 (95% CI, 0.594–0.626) in the obese subgroup, and 0.605 (95% CI, 0.566–0.644) in the non-obese subgroup, respectively, which was significantly higher than that of the HOMA-IR in each subgroup (P<0.001 in all subgroups).
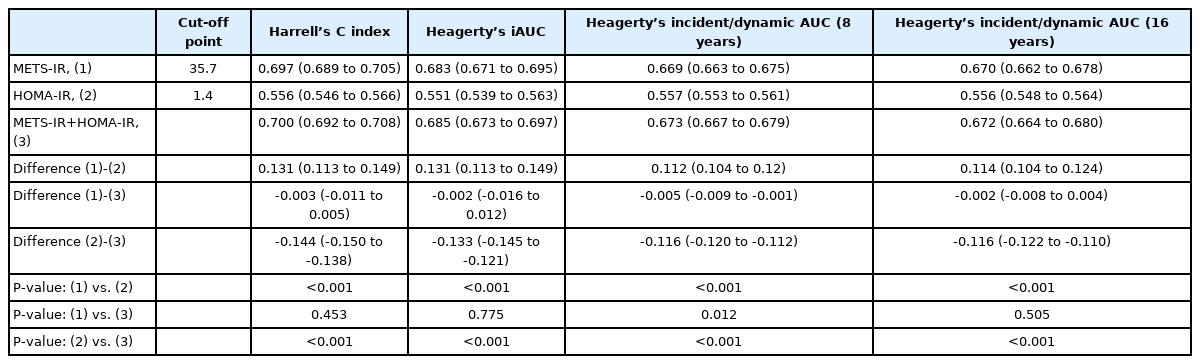
Comparison of predictive ability for incident non-alcoholic fatty liver disease between METS-IR and HOMA-IR using time-dependent receiver operating characteristics curves analysis
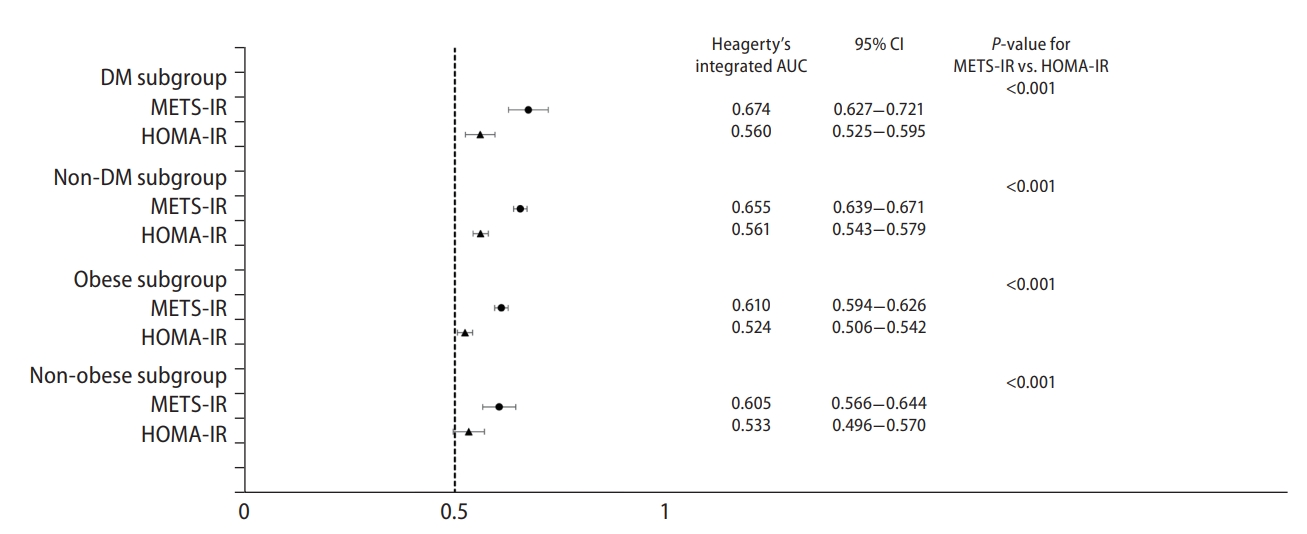
Forest plot showing the predictive power for incident non-alcoholic fatty liver disease by subgroups according to obesity and diabetes mellitus status. Heagerty’s integrated AUC was used as time-dependent AUC over the 16-year of follow-up period, with an unadjusted survival analysis framework approach. A bootstrapping method to calculate the differences and 95% CI of Heagerty’s integrated AUC between the METS-IR and HOMA-IR. DM, diabetes mellitus; METS-IR, metabolic score for insulin resistance; HOMA-IR, homeostatic model assessment for insulin resistance; AUC, area under the receiver operating characteristic curve; CI, confidence interval.
DISCUSSION
We compared the predictive power of two insulin resistance indices for prevalent and incident NAFLD by using data of a large-scale, community-based, prospective cohort. Both the METS-IR and the HOMA-IR were statistically significantly related to prevalent and incident NAFLD.
The optimal threshold of the HOMA-IR for prediction of prevalent NAFLD was 1.8, lower than the generally accepted cut-off value of 2.5 to define insulin resistance. Considering that both HOMA-IR and METS-IR had similar predictive powers for prevalent NAFLD in this study, it could be better for healthcare providers to apply HOMA-IR value of 1.8 or METS-IR value of 39.3 for the early detection of NAFLD.
Interestingly, the baseline METS-IR and HOMA-IR were both predictive of incident NAFLD over the study period. In addition, the predictive powers of the two indices for incident NAFLD had maintained at both 8 and 16 years after baseline. The optimal thresholds for the prediction of incident NAFLD (35.7 for the METS-IR and 1.4 for the HOMA-IR) were lower than those for prevalent NAFLD (39.3 and 1.8). The METS-IR may be preferable to the HOMA-IR for the prediction of incident NAFLD, as it had a higher predictive power (Heagerty’s iAUC, 0.683 vs. 0.551). Joint use of the METS-IR and HOMA-IR did not increase the predictive power for incident NAFLD over that of the METS-IR alone. This suggests that peripheral insulin resistance is more closely related to the development of NAFLD than hepatic insulin resistance.
There are several possible explanations for the superior predictive power of the METS-IR to that of the HOMA-IR for incident NAFLD in this study. First, as mentioned above, the development of NAFLD could be more closely related to peripheral than to hepatic insulin resistance. NAFLD is closely related to metabolic dysfunctions such as overweight/obesity, abdominal obesity, hypertriglyceridemia, low HDL cholesterolemia, chronic inflammation, impaired fasting glucose/DM, and insulin resistance [36]. Qureshi et al. [9] reported that, among 113 participants who were morbidly obese and non-diabetic, those with NAFLD (fatty liver and non-alcoholic steatohepatitis [NASH]) had higher whole-body insulin resistance than those without, whereas hepatic insulin resistance was higher only in those with NASH than in those without NAFLD, suggesting that fatty liver is a hepatic manifestation of peripheral insulin resistance. Our results support such a hypothesis. Hence, the METS-IR may be more representative of peripheral metabolic dysfunction than the HOMA-IR. As the METS-IR uses BMI and concentrations of FPG, serum triglycerides, and serum HDL cholesterol, it makes sense that it would be representative of metabolic dysfunctions related to NAFLD and be predictive for incident NAFLD. Second, use of the HOMA-IR may underestimate insulin resistance in Koreans because Asians have a smaller pancreas and lower insulin secretory capacity than Westerners with the same BMI [37,38]. Moreover, since the traditional Korean diet comprises a high intake of carbohydrate, translating to a high glycemic index [39], the HOMA-IR, which is calculated as the product of the concentrations of FPG and fasting serum insulin, may not accurately reflect the metabolic effects of post-prandial glucose and insulin on liver steatosis.
Several limitations of this study warrant discussion. First, NAFLD was defined according to a surrogate marker, namely, the NAFLD-liver fat score. In addition, there was a lack of information about the use of certain medications which can induce NAFLD. Second, insulin resistance was not classified into hepatic insulin resistance and peripheral insulin resistance, because there was a lack of data regarding plasma glucose and serum insulin concentrations 30 minutes after the 75-g oral glucose tolerance test, which are required to calculate hepatic insulin resistance [40]. Third, neither the METS-IR nor the HOMA-IR had an excellent predictive power for incident NAFLD. However, considering that the predictive power of the METS-IR for incident NAFLD at 8 and 16 years after baseline was close to 0.7, it may nonetheless prove a useful indicator for the early detection of individuals at risk of NAFLD, prompting early lifestyle intervention. In addition, since both the METS-IR and the HOMA-IR are time-varying variables, the effect of changes in these resistance indices on incident NAFLD should be verified in future studies. Finally, generalization of the results is limited to Korean population, as Koreans are relatively homogeneous in terms of genetic traits and lifestyles.
In conclusion, both the METS-IR and the HOMA-IR are highly predictive of prevalent NAFLD in middle aged and older Korean adults. Moreover, the METS-IR is superior to the HOMA-IR for the prediction of incident NAFLD. Our findings suggest that the METS-IR is more useful than the HOMA-IR for the early detection and prevention of NAFLD in Korean population. Further clinical trials are warranted to determine which index is most valuable with regard to NAFLD.
Notes
Authors’ contributions
Study concept and design: Jun-Hyuk Lee, Jee Hye Han, and Sang Bong Ahn; Data collection: Jun-Hyuk Lee, Kyongmin Park, Hye Sun Lee, and Hoon-Ki Park; Data analysis and interpretation: Jun-Hyuk Lee, Jee Hye Han, and Sang Bong Ahn; Manuscript writing: Jun-Hyuk Lee, Jee Hye Han, and Sang Bong Ahn; Final approval of the manuscript: All authors.
Conflicts of Interest
The authors have no conflicts to disclose.
Acknowledgements
This paper was supported by Eulji University in 2021 (grant number: EJRG-21-13). Data in this study were from the Korean Genome and Epidemiology Study (KoGES; 4851-302), National Research Institute of Health, Centers for Disease Control and Prevention, Ministry for Health and Welfare, Republic of Korea.
Abbreviations
ALT
alanine aminotransferase
AST
aspartate aminotransferase
AUC
area under the receiver operating characteristic curve
BMI
body mass index
CI
confidence interval
CRP
C-reactive protein
DBP
diastolic blood pressure
DM
diabetes mellitus
FPG
fasting plasma glucose
HDL
high-density lipoprotein
HOMA-IR
homeostatic model assessment for insulin resistance
HR
hazard ratio
HTN
hypertension
iAUC
integrated area under the receiver operating characteristic curve
IRB
Institutional Review Board
KoGES
Korean Genome and Epidemiology Study
LDL
low-density lipoprotein
MBP
mean blood pressure
MET
metabolic equivalent of task
METS-IR
metabolic score for insulin resistance
NAFLD
non-alcoholic fatty liver disease
NASH
non-alcoholic steatohepatitis
ROC
receiver operating characteristic
SBP
systolic blood pressure
WC
waist circumference
References
Article information Continued
Notes
Study Highlights
NAFLD is closely related to insulin resistance. We determined which insulin resistance index (METS-IR and HOMA-IR) is more useful to predict the prevalence of NAFLD as well as the incidence of NAFLD by analyzing data from a community-based, prospective Korean cohort study. METS-IR showed higher predictive power for the incidence of NAFLD than HOMA-IR (iAUC: 0.683 vs. 0.551, P<0.001). Moreover, METS-IR and HOMA-IR showed similar predictive powers for the prevalence of NAFLD (AUC: 0.824 vs. 0.831, P=0.276). Our findings suggest that METS-IR can be a more useful for the early detection and prevention of NAFLD than the HOMA-IR.