Clinical significance of the discrepancy between radiological findings and biochemical responses in atezolizumab plus bevacizumab for hepatocellular carcinoma
Article information
Dear Editor,
Atezolizumab plus bevacizumab (Atez/Bev) treatment significantly prolonged overall survival in patients with unresectable hepatocellular carcinoma (HCC) in phase 3 of the IMbrave 150 clinical trial [1]. Atez/Bev has become the first-line therapy regimen for systemic treatment [2,3]. Recently, we observed acceptable therapeutic and safety outcomes after Atez/Bev treatment for unresectable HCC even in a realworld setting [4]. However, certain unmet needs in the clinical use of Atez/Bev still exist. Generally, the modified Response Evaluation Criteria in Solid Tumors (mRECIST) has been proposed and broadly used to assess the therapeutic effects of molecular targeted agents [5,6]. However, it is sometimes difficult to manage cases treated with Atez/Bev that are assessed as “partial response (PR)” and “stable disease (SD)” by mRECIST because of the discrepancies between radiological findings and biochemical responses, i.e., changes in tumor markers. Therefore, in this study, we shed light on an important clinical question regarding the discrepancies between radiological findings and biochemical responses in Atez/Bev treatment.
We evaluated 90 patients with unresectable HCC treated with Atez/Bev between November 2020 and September 2021 (ethical approval number: 20183). Atez/Bev treatment was performed according to the pharmaceutical recommendations. We evaluated the consistency and inconsistency in the radiological findings assessed by mRECIST and biochemical responses. In PR cases at the initial radiological evaluation (6 weeks from the start of Atez/Bev treatment), “consistency” was defined as decrease in tumor markers. In SD cases, “consistency” was defined as a <10% elevation of the tumor marker compared to that before the initial administration of Atez/Bev. Levels of alpha-fetoprotein and des-γ-carboxy prothrombin (DCP) were used as indicators of tumor markers expression.
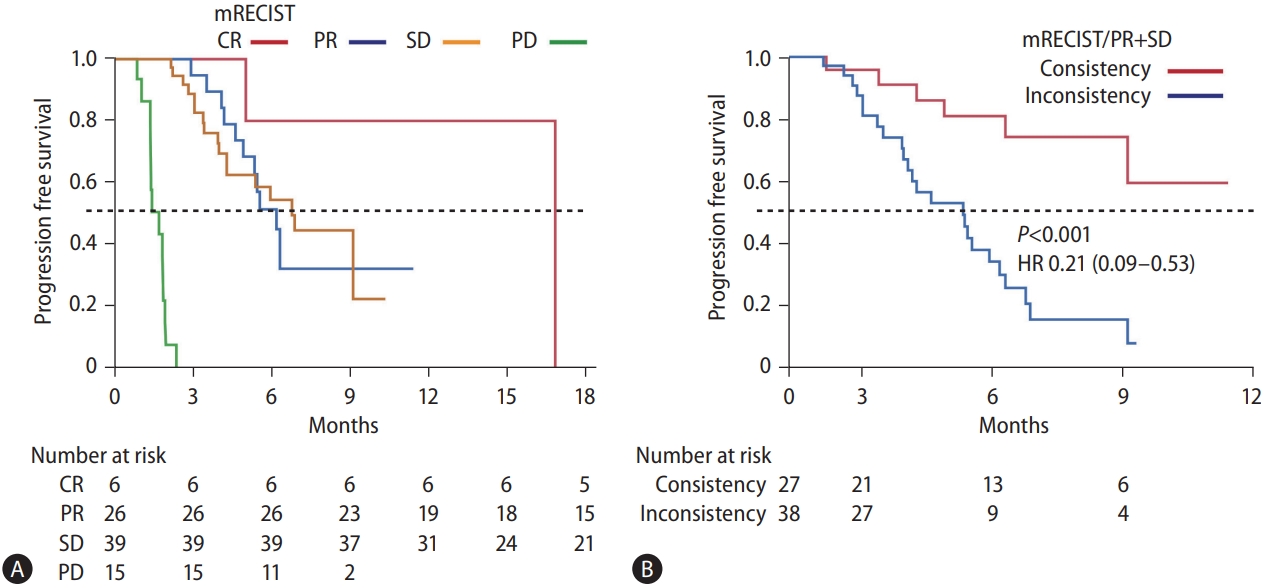
The median progression-free survival (PFS) in all patients in the study was 5.4 months (95% confidence interval [CI], 4.3– 6.9). In the assessment using mRECIST at the first radiological evaluation, complete response (CR), PR, SD, and progressive disease (PD) was observed in 7.0%, 30.3%, 45.3%, and 17.4% of the cases, respectively. The number of PR and SD cases were 26 and 39, respectively. The overall objective response rate was 37.3%. The median PFS time was not reached in the CR group. In addition, the median PFS in the PD group was only 1.7 months. Figure 1A shows the PFS curve in the PR and SD groups. The median PFS of the PR group was 6.2 months, while that of the SD group was 6.8 months notably, there was no significant difference in PFS between the PR and SD groups.

Assessment of PFS in Atez/Bev treatment. (A) The PFS curves according to the therapeutic responses in mRECIST. The red, blue, yellow, and green lines indicate the CR, PR, SD, and PD groups, respectively. The median PFS was not reached in the CR group. The median PFS in the PR, SD, and PD groups was 6.2, 6.8, and 1.7 months, respectively. The P-values between CR and PR, PR and SD, and SD and PD were 0.09, 0.95, and <0.001, respectively. (B) PFS curves stratified according to consistency/inconsistency between radiological findings and changes in tumor markers in the PR and SD groups. The median PFS was not reached in the “consistency” group, and the median PFS in “inconsistency” group was 5.3 months. There was a significant difference between them (P<0.001). mRECIST, modified response evaluation criteria in solid tumors; CR, complete response; PR, partial response; SD, stable disease; PD, progressive disease; HR, hazard ratio; PFS, progression-free survival; Atez/Bev, atezolizumab plus bevacizumab.
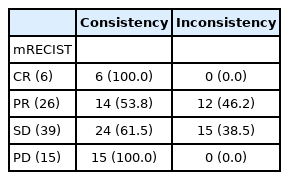
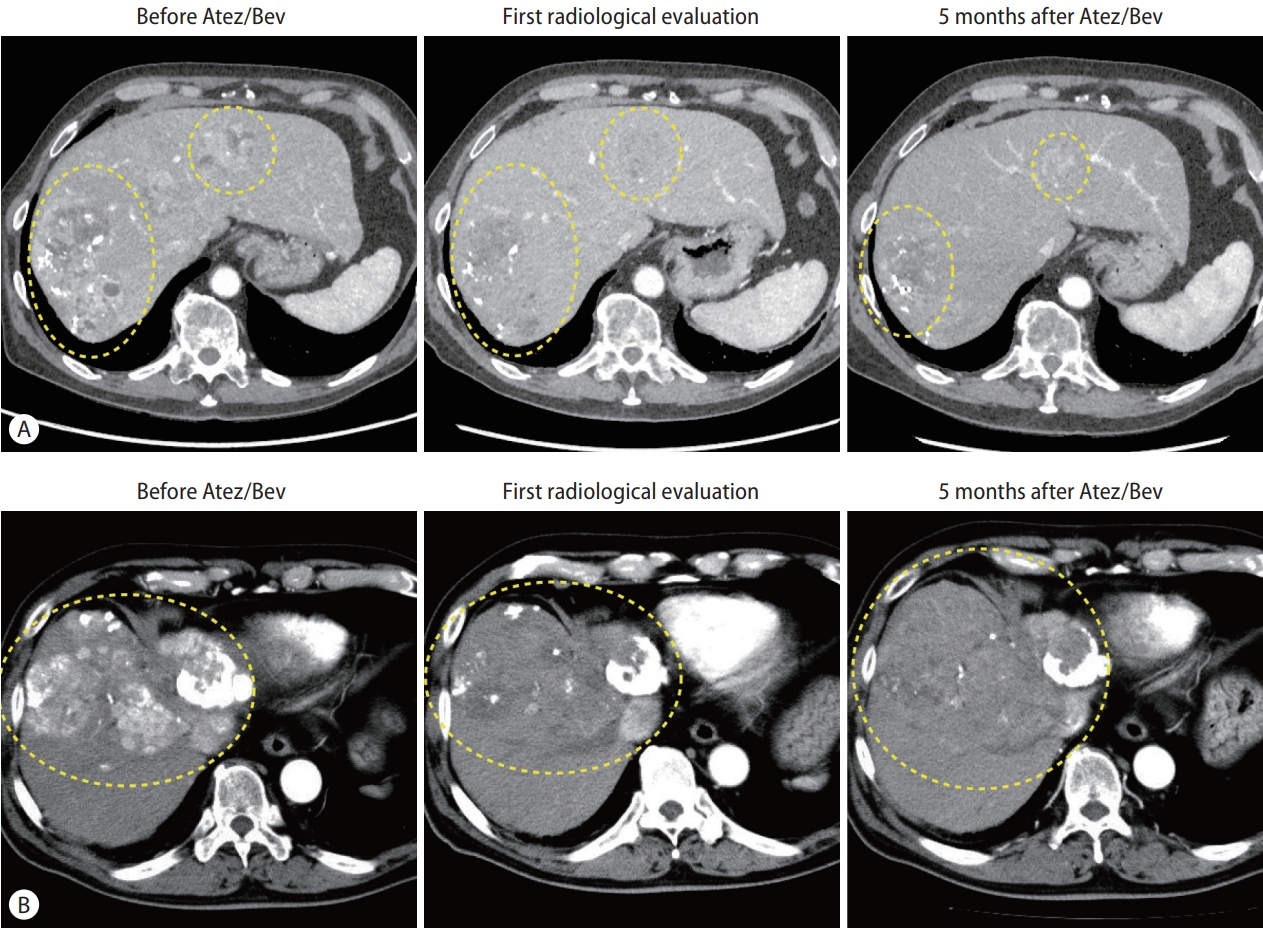
Table 1 shows consistency and inconsistency between the radiological findings in mRECIST and biochemical responses at the time of initial radiological assessment. The tumor markers were decreased in all CR patients (consistency) and increased in all 15 PD patients (consistency). The tumor markers were decreased in 43.8% of the PR patients (n=14, consistency) and not decreased in 46.2% of the PR patients (n=12, inconsistency). In the SD group, the tumor markers did not increase by <10% in 61.5% of the patients (n=24, consistency), while they increased by >10% in 38.5% of the patients (n=15, inconsistency). Figure 2 shows representative images of consistent and inconsistent cases between radiological findings and biochemical response. Figure 2A shows a consistent case. The patient in this case showed PR at the initial radiological evaluation, and the tumor marker level was decreased at this time. Durable therapeutic effects were seen in this case during Atez/Bev treatment (median PFS, 9.3 months). Figure 2B shows an inconsistent case with PR at the initial radiological evaluation; however, the tumor marker levels were increased at the same time. At the second radiological evaluation, the target lesions re-grew with enhancement (median PFS, 5.6 months). To stratify the PFS of these PR and SD cases, we highlighted the changes in tumor markers at the time of initial radiological assessment. Figure 1B shows the PFS of PR/SD cases with differences in consistency or inconsistency. Notably, consistency and inconsistency clearly divided the PFS of PR/SD cases treated with Atez/Bev (P<0.001). The median PFS of the consistency group was not reached, while that of the inconsistency group was 5.3 months (hazard ratio, 0.21; 95% CI, 0.09–0.53).

Ratio of consistency/inconsistency between radiological findings in mRECIST and changes in tumor markers at the time of first radiological assessment

Representative consistent/inconsistent cases in Atez/Bev treatment. (A) A case of consistency between radiological findings and changes in the tumor marker. The left panel shows the arterial phase of enhanced CT before Atez/Bev treatment. Some enhanced lesions were detected in the liver. The DCP level before treatment was 63,911 mAU/mL. The middle panel shows the arterial phase of enhanced CT at the initial radiological evaluation from administration of Atez/Bev. The arterial-enhanced areas are decreased by Atez/Bev treatment. In line with the radiological findings, the DCP level was decreased to 52,966 mAU/mL. The right panel shows the arterial phase of enhanced CT at 5 months after administration of Atez/Bev. The DCP level was decreased to 178 mAU/mL. (B) A case of inconsistency between radiological findings and changes in the tumor marker. The left panel shows the arterial phase of enhanced CT before Atez/Bev treatment. Some enhanced lesions were detected in the liver. The DCP level before treatment was 59,270 mAU/mL. The middle panel shows the arterial phase of enhanced CT at the initial radiological evaluation from administration of Atez/Bev. The arterial-enhanced areas are decreased by Atez/Bev treatment. However, inconsistent with the radiological findings, the DCP level was increased to 66,180 mAU/mL. The right panel shows the arterial phase of enhanced CT at 5 months after administration of Atez/Bev. The target lesions showed regrowth with enhancement, and the DCP level was increased to 137,593 mAU/mL. Atez/Bev, atezolizumab plus bevacizumab; CT, computed tomography; DCP, des-γ-carboxy prothrombin.
The biochemical response of a tumor marker is known to be a predictive factor for the therapeutic response of Atez/ Bev [7]. When clinicians treat patients with unresectable HCC using Atez/Bev, it is relatively easy to assess and manage CR and PD cases. However, clinicians sometimes note discrepancies between radiological findings and biochemical responses during Atez/Bev treatment in PR and SD cases, which can make the management challenging. Consistency and inconsistency in the clinical impression between radiological findings and changes in tumor markers during initial radiological assessment clearly divided the PFS of PR and SD cases in Atez/Bev treatment. Thus, attention should be paid to the changes in tumor markers when assessing PR or SD in Atez/ Bev treatment. Moreover, clinicians also sometimes notice discrepancy between discrepancy of tumor markers AFP and DCP during Atez/Bev treatment. In this study, there is no discrepancy between each tumor marker in CR and PD cases. However, 24.1% of SD and PR groups revealed discrepancy of change of AFP and DCP. This issue also can make the management challenging for clinicians.
The present study has several limitations. First, the study design was of a retrospective nature, and the sample size was relatively small. Second, the observation period of the treatment was relatively short. Moreover, in the study, we defined 10% change of tumor markers as consistency and inconsistency. We need to find the most effective definition for consistency and inconsistency between biochemical responses and radiological findings in Atez/Bev treatment. However, the present study is the first to reveal the clinical significance of discrepancy between radiological findings and biochemical responses in Atez/Bev treatment. Thus, further accumulation of treatment experience and analyses in longer observation periods are needed to evaluate the true effects of Atez/Bev in real-world clinical practice.
In conclusion, the findings presented in the current study might offer important insights regarding the judgment of the true therapeutic effect of Atez/Bev treatment for HCC. Further studies are warranted to evaluate importance of biochemical response in assessment of therapeutic responses of Atez/Bev.
Notes
Authors’ contributions
H.I. designed the study and wrote the manuscript, S.S. corrected the data, T.N. treated the patients, H.K. and T.T supervised the study. All authors discussed the results and contributed to the final manuscript.
Conflicts of Interest
The authors declare no conflicts of interest.
Acknowledgements
The authors thank all members of the HCC group in Kurume University School of Medicine and the members of the Kurume Liver Cancer Study Group of Japan. Takuji Torimura is representative of this group. Address: Asahimachi 67, Kurume, Fukuoka, Japan, Kurume University School of Medicine.
H.I. received grants from The Takeda Science Foundation, The Shinnihon Foundation of Advanced Medical Treatment Research, The Kurume University Branding Project, and the Yasuda Medical foundation and the JSPS KAKENHI grant.
This study was approved by the Ethics Committee of Kurume University School of Medicine (approval number: 20183). The requirement for written informed consent from the patients was waived due to the study’s retrospective nature.
Abbreviations
Atez/Bev
atezolizumab plus bevacizumab
CI
confidence interval
CR
complete response
DCP
des-γ-carboxy prothrombin
HCC
hepatocellular carcinoma
mRECIST
modified response evaluation criteria in solid tumors
PD
progressive disease
PFS
progression-free survival
PR
partial response
SD
stable disease
