Clinical characteristics of patients with chronic hepatitis B who developed genotypic resistance to entecavir: Real-life experience
Article information

Abstract
Background/Aims
Clinical characteristics of patients with chronic hepatitis B (CHB) who developed genotypic resistance to entecavir (ETV) were compared to those without resistance.
Methods
Two hundred fifty eight CHB patients who underwent ETV treatment in our institution from July 2007 to May 2013 were included.
Results
Eight (3.1%) patients developed genotypic resistance to ETV during the follow-up period. The patterns of genotypic resistance to ETV were as follows: L180M + M204V + S202G (n=3); M204I + V173M (n=1); I169V + V173M (n=1); L180M + M204V + V173L (n=1); L180M + M204V + V173L + M250V (n=1); M204I + V214A + P237H (n=1). The cumulative occurrence rates of genotypic resistance to ETV were not significantly different between CHB patients with prior nucleos(t)tide analogues (NA) exposure (NA experienced, n=56) and NA naïve patients (n=202, P=0.823 by log rank comparison). Older age, higher baseline log10hepatitis B virus-deoxynucleic acid (log10HBV-DNA), higher log10HBV-DNA at 3, 6, 12 and 24 months after baseline, and complete virologic response (CVR, undetectable serum HBV-DNA by polymerase chain reaction 6 months after ETV treatment) were significant contributors to the development of genotypic resistance to ETV. Multivariate analyses showed higher log10HBV-DNA 6 months after baseline and absence of CVR were independent and significant contributors to the development of ETV resistance.
Conclusions
Clinical characteristics of patients who developed ETV resistance were higher log10HBV-DNA 6 months after baseline and absence of CVR during the ETV treatment.
INTRODUCTION
Long-term nucleoside/nucleotide analogue (NAs) therapy is the mainstay treatment for the majority of chronic hepatitis B (CHB) patients, given that the aim of CHB treatment is permanent and sustained viral suppression with undetectable hepatitis B virus DNA (HBV-DNA) level with the aim of achieving the long-term goal of prevention of the development of cirrhosis and hepatocellular carcinoma (HCC) [1,2].
Overtime, HBV evolves strategies to counteract the drug-related selection pressure and thereby escapes the antiviral action. Therefore, antiviral resistance is a clinically relevant subject in the therapeutic monitoring of patients with CHB who receive NAs treatment [3-6].
The newer highly potent antiviral agent, entecavir (ETV), has more than 1,500 times greater potency than lamivudine (LAM) in vitro [4]. ETV is a guanosine analogue that competes with the natural substrate deoxyguanosine triphosphate to inhibit reverse transcriptase (rt) activity [7]. ETV is structurally distinct from the other NAs and allows incorporation of additional nucleotides before chain termination. ETV displays activity against the priming function and has been shown to affect both the positive and negative strand DNA synthesis [8].
ETV resistance mutations require combinations of substitutions at positions rtI169T, rtV173L, rtL180M, rtT184G, rtS202I/G, rt- M204V/I, or rtM250V [9,10]. It has been reported that the development of ETV resistance in NA-naïve patients is very rare, and the cumulative incidence of ETV resistance at 1, 2, 3, 4, 5, and 6 years is reported to be 0.2%, 0.5%, 1.2%, 1.2%, 1.2% and 1.2% respectively [11-13]. Most cases of ETV resistance were reported in patients with prior use of LAM who developed pre-existing LAM resistance. The rate of occurring adverse effects in CHB patients receiving ETV treatment over median treatment duration of 184 weeks is reported to be ≤10% [14]. Together, with the low adverse effects and high genetic barrier to resistance and proven potent antiviral activity, ETV was recommended as the first-line NA for NA-naïve CHB patients in recent treatment guidelines [5,6].
Primary non-response (PNR; less than one log10 drop of HBVDNA at 12 weeks) or partial virologic response (PVR; a detectable HBV-DNA level at week 48) may be encountered with all available NAs [6]. Therefore, the CHB treatment guidelines suggest that treatment adaptation should be considered in patients with a persistent viremia after 48 weeks of ETV treatment [5,6]. However, recent reports showed that vast majority of NA-naïve patients with PVR and even PNR achieved undetectable levels of HBV-DNA through continuous ETV monotherapy. Moreover, genotypic resistance to ETV was not observed in these patients with PVR and PNR, which suggest that adjustment of ETV therapy in these patients is not necessary [15,16].
Treatment efficacy of ETV monotherapy can be affected by factors such as the development of adverse effects, drug compliance, previous treatment with suboptimal regimens, infection with drug resistant viral strains, and individual genetic variation. Important factor associated with emergence of antiviral drug (including ETV) resistance is the rapid and profound suppression of HBV replication during long-term antiviral treatment. However, data for the use of on-treatment HBV-DNA suppression to anticipate treatment response and emergence of drug resistance for CHB patients receiving ETV monotherapy are still scarce. Additionally, the clinical characteristics of patients with ETV resistance in CHB patients are not well evaluated. Here, the authors present the cumulative occurrence rate of genotypic resistance to ETV in real world of clinical practice and the clinical characteristics of patients with CHB who developed genotypic resistance to ETV compared to those who did not develop resistance.
PATIENTS AND METHODS
Study population
The population of this investigator-initiated retrospective cohort study comprised all consecutive adult patients (≥20 years of age) treated with ETV monotherapy in our institution between July 2007 and May 2013. Two hundred fifty-eight patients were included in the current study. We included nucleoside-naïve patients (n=202, 78.3%) and those who had prior nucleoside treatment [total n=56, 21.7%; LAM; n=44, 16.3%; clevudine (CLV); n=9, 2.7%; telbivudine (LdT); n=3, 1.2%]. The mean ± standard deviation (SD) duration (months) of each prior NA treatment were 28.7 ± 15.9 for LAM, 19.4 ± 15.3 for CLV, and 9.3 ± 8.5 for LdT, respectively. All enrolled patients underwent HBV mutation test at baseline and at least once during the follow-up period if followup HBV-DNA test implied the viral breakthrough. HBV genotypes were determined using polymerase chain reaction–restriction fragment length polymorphism (PCR–RFLP) of the surface gene of the HBV genome. Patients were excluded if they had antibody to hepatitis C or D virus or HIV, or confirmed to have hepatocellular carcinoma at baseline, or had received a liver transplant. Patients who did not underwent HBV mutation test at baseline or at any time points of follow-up with suspicion of viral breakthrough were also excluded from the current study. Patients were also excluded if they were confirmed to have any genotypic resistance to NAs at baseline. Present study was conducted in accordance with the principles of the Declaration of Helsinki. Our study protocol obtained approval of the Ethics Committee of Kangbuk Samsung Hospital (IRB Code No: KBC13238).
Efficacy end points
The primary end point was the proportion of patients who developed genotypic resistance to ETV and the mutational patterns of genotypic resistance to ETV. The secondary end point was the identification of clinical and virologic factors significantly associated with emergence of genotypic resistance to ETV.
Assay methodology
Routine liver biochemical tests including serum alanine aminotransferase (ALT), aspartate aminotransferase (AST), albumin, total bilirubin, prothrombin time, and creatinine level were determined at the baseline and every 3 months during the treatment with ETV 0.5 mg once a day treatment, using a sequential multiple autoanalyzer (Hitachi, Tokyo, Japan). For detection of ETV resistance, direct sequencing with ABI PRISM 310 Genetic Analyzer equipment (Applied Biosystem, Foster City, CA, USA) using the DYEnamic ET Terminator Cycle Sequencing Kit (GE Healthcare, Buckinghamshire, UK) was used at the baseline and at the time of virologic breakthrough.
Follow-up and definitions
HBV-DNA was measured at the baseline and every 3 months during the treatment with ETV 0.5 mg once a day by the real-time PCR method using a COBAS TaqMan analyser (Roche Diagnostics, Mannheim, Germany) with a lower limit of detection of 116 copies/mL. Patients were monitored at the baseline and every 3 months thereafter during the dosing period. Patients underwent clinical assessment of tolerability and drug compliance (checked with a pill count), physical examination, and blood drawing for measurements of laboratory parameters. A complete virologic response (CVR) was defined as an undetectable serum HBV-DNA by PCR (<116 copies/mL) 6 months after the initiation of ETV 0.5 mg once a day therapy. A primary non-response (PNR, initial treatment failure) was defined as a decline in the HBV-DNA level to less than 1 log10 copies/mL value 3 months after the initiation of ETV 0.5 mg once a day. Partial virologic response (PVR) was defined as a detectable HBV-DNA levels at 12 months after the initiation of ETV 0.5 mg once a day. If PVR and PNR sequentially occurred in a CHB patient, the patient was regarded as a nonresponder. Virologic breakthrough was considered as an increase in the HBV-DNA level to more than 1log10 value compared with the trough level after an initial period of complete or partial response to that treatment. Biochemical breakthrough was defined as an increase in ALT activity above the ULN after an initial return to normal levels. The median (range) follow-up period (months) of the current study was 59 (9~101).
Statistical analysis
Results are reported as mean ± standard deviation (SD). HBVDNA levels were logarithmically transformed for analysis. Continuous variables were compared using the Mann-Whitney U-test. Categorical data were analyzed using Fisher’s exact test. Mean reductions of serum HBV-DNA levels from baseline were compared by repeated measures analysis of variance. Cumulative rates for virologic response, virologic breakthrough, and genotypic resistance were evaluated by Kaplan-Meier method with log rank comparisons. Factors associated with development of genotypic resistance to ETV were analyzed by multivariate logistic regression analysis. P-values of < 0.05 were considered statistically significant. Data was collected in Microsoft EXCEL (Microsoft Excel 2010; Microsoft Corp., Seattle, WA, USA) and analyzed using PASW version 18.0 for Windows (IBM Corp., Armonk, NY, USA).
RESULTS
Comparisons of baseline characteristics between the patient group with and without ETV resistance
The baseline characteristics of the patients without ETV resistance (n=250) and with ETV resistance (n=8) are shown in Table 1. Most demographic and laboratory characteristics were well-balanced between two patient groups, including gender, presence or absence of liver cirrhosis, Child-Turcotte-Pugh (CTP) class, HBeAg positivity, HBV genotype, number of patients who switched to ETV from other NA, prior NA exposure, compliance, and baseline serum ALT level. However, patients with genotypic resistance to ETV was significantly older than the patients without ETV resistance (55.5 ± 10.2 years vs. 47.8 ± 10.9 years, P =0.037). Additionally, the baseline log10HBV-DNA (mean ± SD, copies/mL) was significantly higher in patients with genotypic resistance to ETV compared to patients without ETV resistance (7.87 ± 1.16 vs. 6.22 ± 2.45, P =0.043). Seropositive ratio of HBeAg in patients with genotypic resistance for ETV showed higher tendency compared to patients with no ETV resistance (75.0% vs. 47.6%, P =0.123).

Comparisons of baseline characteristics between patient groups with and without ETV resistance
Patterns of genotypic resistance to ETV
Eight (3.1%) patients developed genotypic resistance to ETV during the follow-up period. The patterns of genotypic resistance to entecavir were: rtL180M + rtM204V + rtS202G (n=3); rtM204I + rtV173M (n=1); rtI169V + rtV173M (n=1); rtL180M + rtM204V + rtV173L (n=1); rtL180M + rtM204V + rtV173L + rtM250V (n=1); rtM204I + rtV214A + rtP237H (n=1). The cumulative occurrence rate of genotypic resistance to ETV was 0.4%, 1.2%, 2.8%, 2.8%, 2.8%, and 3.3% (thereafter, no increase in genotypic resistance rate up to 101 months) at 1, 2, 3, 4, 5 and 6 years of ETV 0.5 mg medication, respectively (Fig. 1A). The cumulative occurrence rates of genotypic resistance to ETV were not significantly different between CHB patients with prior NA exposure (NA experienced) and NA naïve patients (P =0.823 by log rank comparison, Fig. 1B). Baseline clinico-epidemiologic characteristics and clinical course of each patient with genotypic resistance to ETV were summarized in Table 2.
Cumulative probability of the occurrence of genotypic resistance to entecavir. (A) The cumulative occurrence rate of genotypic resistance to ETV was 0.4%, 1.2%, 2.8%, 2.8%, 2.8%, and 3.3% (thereafter, no increase in genotypic resistance rate up to 101 months) at 1, 2, 3, 4, 5 and 6 years of 0.5 mg ETV medication, respectively. (B) The cumulative occurrence rates of genotypic resistance to ETV were not significantly different between CHB patients with prior NA exposure (NA experienced) and NA naïve patients (P=0.823 by log rank comparison). ETV, entecavir; CHB, chronic hepatitis B; NA, nucleos(t)tide analogues.
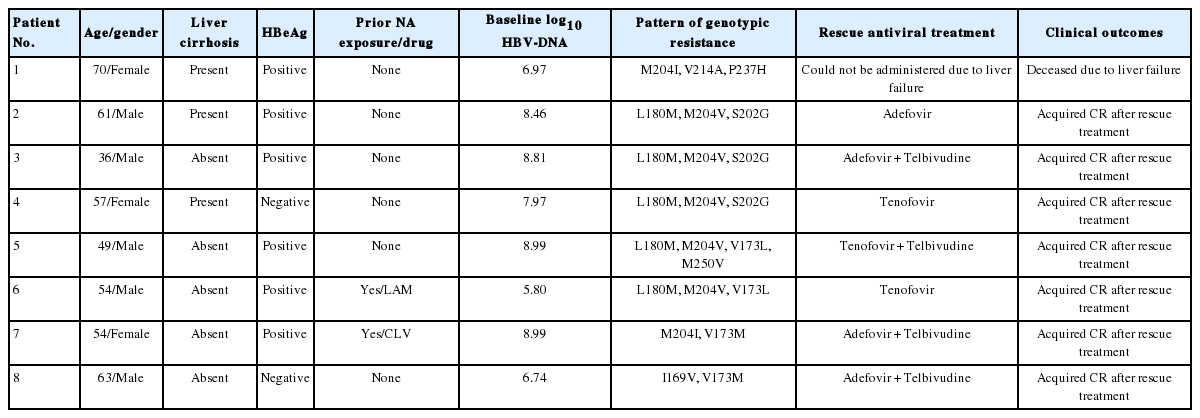
Baseline clinico-epidemiologic characteristics and clinical course for each patient with genotypic resistance to ETV
Comparisons of virologic, serologic, and biochemical responses between patients with and without ETV resistance
Serum log10HBV-DNA levels (mean ± SD, copies/mL) measured at baseline (P =0.01), 3 (P<0.01), 6 (P<0.01), 12 (P <0.01), 24 (P<0.01), 36 (P<0.01), and 48 (P =0.459) months after the initiation of ETV treatment were significantly higher in patients with genotypic resistance to ETV compared to patients without ETV resistance. However, there were no significant differences in the reduction of serum log10HBV-DNA (mean ± SD, copies/mL) from baseline to 3, 6, 12, 24, 36, and 48 months (Fig. 2).

Comparisons of virologic responses between patients with and without genotypic resistance to ETV monotherapy. Serum log10HBVDNA levels (mean ± SD, copies/mL) measured at baseline (P=0.01), 3 (P<0.01), 6 (P<0.01), 12 (P<0.01), 24 (P<0.01), 36 (P<0.01), and 48 (P=0.459) months after the initiation of ETV treatment were significantly higher in patients with genotypic resistance to ETV compared to patients without ETV resistance. However, there were no significant differences in the reduction of serum log10HBV-DNA (mean ± SD, copies/mL) from baseline to 3, 6, 12, 24, 36, and 48 months. ETV, entecavir; HBV-DNA, hepatitis B virus-deoxynucleic acid.
Serum log10HBV-DNA levels (mean ± SD, copies/mL) measured at baseline (P =0.01), 3 (P<0.01), 6 (P<0.01), 12 (P <0.01), 24 (P<0.01), 36 (P<0.01), and 48 (P =0.459) months after the initiation of ETV treatment were significantly higher in patients with genotypic resistance to ETV compared to patients without ETV resistance. However, there were no significant differences in the reduction of serum log10HBV-DNA (mean ± SD, copies/mL) from baseline to 3, 6, 12, 24, 36, and 48 months (Fig. 2).
The composition of virologic responses between patients with and without ETV resistance showed statistically significant differences (Fig. 3). The proportion of the patients with CVR was significantly higher in patients without ETV resistance compared to patients with ETV resistance [161 (64.4%) vs. 2 (25.0%), P<0.01]. Notably, the proportion of PVR [5 (62.5%) vs. 88 (35.2%)], and PNR [1 (12.5%) vs. 1 (0.4%), P<0.01] were significantly higher in patients with ETV resistance compared to patients without ETV resistance.

Comparisons of virologic responses between patients with and without entecavir (ETV) resistance. The proportion of patients with complete virologic response was significantly higher in the patient group without ETV resistance compared to the patient group with ETV resistance [161 (64.4%) vs. 2 (25.0%), P<0.01]. Notably, the proportion of partial virologic response [5 (62.5%) vs. 88 (35.2%)], and primary non-response [1 (12.5%) vs. 1 (0.4%), P<0.01] were significantly higher in patients with ETV resistance compared to patients without ETV resistance. NR, non response; PR, partial response; CR, complete response.
After 6 months of ETV treatment, ALT normalization was observed in 200 (80.0%) and 5 (62.5%) patients in patients without and with ETV resistance, respectively (P =0.213). The cumulative occurrence rate of genotypic resistance to ETV was not significantly different between patients with and without HBeAg negative conversion and HBeAg seroconversion, respectively (Fig. 4).
Comparisons of cumulative occurrence rates of genotypic resistance to entecavir (ETV) between patients with or without hepatitis B e antigen (HBeAg) negative conversion and seroconversion. (A) The cumulative occurrence rate for genotypic resistance to ETV showed a higher tendency in patients without HBeAg negative conversion (n=69) compared to patients with HBeAg negative conversion (n=56, P=0.156). (B) The cumulative occurrence rate of genotypic resistance to ETV was not significantly different between patients without HBeAg seroconversion (n=95) and patients with HBeAg seroconversion (n=30, P=0.658).
To explore the independent and significant contributors to the development of genotypic resistance to ETV in CHB patients, we performed Cox regression analyses with forward stepwise conditional method after inputting the significant variables in the univariate analysis and epidemiologic covariates (Age, gender, Serum log10HBV-DNA levels measured at baseline, 3, 6, 12, 24, 36, and 48 months, and presence of CVR, prior NA treatment experience, duration of prior NA treatment). Higher serum log10HBVDNA levels at 6 months after baseline, and absence of CVR were independent and significant contributors to the development of genotypic resistance to ETV in CHB patients (Table 3).
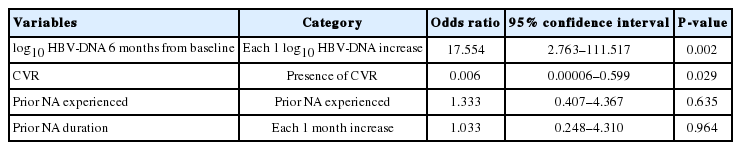
Multivariate analyses to determine independent contributors to the development of ETV resistance
DISCUSSION
The current study firstly explored the real-life data of genotypic resistance to ETV, which is a potent antiviral agent superior to LAM and ADV for virologic suppression, and which has a high genetic barrier to the development of genotypic resistance. Previously reported long-term clinical data show that extended use of ETV has been associated with a very low risk of developing genotypic resistance up to 6 years [11-13]. However, these clinical trials were included in sponsor-initiated, well-designed, prospective randomized controlled trials with per protocol or intention-totreat analyses (such as ETC-022, ETV-027 or ETV-901). Hence, the clinical data may not mirror the real-life clinical practice of ETV treatment in CHB patients who are antiviral-naïve or switchers from previously prescribed less-potent NA such as LAM.
In the current study, eight (3.1%) patients developed genotypic resistance to ETV during the follow-up period. The proportion of patients with genotypic resistance to ETV was markedly higher in the current study than previous sponsor-initiated, well-designed ETV-trials. Emergence of genotypic resistance to ETV requires additional amino acid substitutions in HBV already resistant to LAM. For the exclusion of already existing LAM resistance, we performed baseline HBV mutation test for all our enrolled patients, and started or switched to ETV 0.5 mg medication if the test results showed no preexisting NA resistance mutations. Previous analyses showed ETV resistance increases in LAM-refractory patents; it is not certain whether ETV resistance increases in previously NA experienced CHB patients who have no genotypic mutations to ETV at the switch or re-star ting time of ETV medication [9]. A recent retrospective cohort study including 500 consecutive CHB patients treated with ETV 0.5 mg showed that ETV resistance was more frequent in patients who were ever exposed to LAM with no currently or previously detected LAM resistance (Hazard ratio 13.0, P =0.013) than NA-naïve patients [17]. Additionally, the probabilities of developing ETV resistance in NA-naïve patients and patients who were ever exposed to LAM with no currently or previously detected LAM resistance were <1.0 and 8.0%, respectively, at month 48. The current study also supports the contention that genotypic resistance to ETV can be increased in CHB patients who have previous exposure to LAM or other NAs. Many HBV patients could easily be prescribed with LAM at local clinic which is covered with reimbursement by national health insurance system in Korea. Hence some of patients who were exposed to NAs at local clinic without informed consent could be included in NA-naïve patients in this study.
The patterns of genotypic resistance to ETV presented in the current study were remarkably heterogeneous in their composition. The typical patterns of signature mutations to ETV occurred in 4 patients (3 patients have rtL180M + rtM204V + rtS202G, and one patient has rtL180M + rtM204V + rtV173L + rtM250V). While, other four patients possessed only secondary or compensatory mutations at the time of viral breakthrough, and composition of those mutations were rtV173M/L plus other genotypic mutations to LAM (n=2), rtV173M/L plus rtI169 mutation (n=1), and rtM204I + rtV214A + rtP237H (n=1). In the current study, clinical significance of those secondary or compensatory mutations in polymerase reverse transcriptase region of HBV was not clear. However, the occurrences of viral breakthrough in patients with those secondary or compensatory mutations imply that the phenotypic ETV susceptibilities (EC50/WT reference EC50) were significantly increased in the CHB patients with those secondary or compensatory mutations.
Another important finding in the current study was that certain clinical parameters, such as older age, higher baseline log10HBVDNA, higher log10HBV-DNA at 3, 6, 12 and 24 months after baseline, and absence of CVR during the follow-up period, could be predictive factors for subsequent aberrant clinical outcomes of ETV treatment including the development of genotypic resistance to ETV. Especially, higher serum log10HBV-DNA levels at 6 months after baseline, and absence of CVR were independent and significant contributors to the development of genotypic resistance to ETV in CHB patients (Table 2). Most important factor associated with the emergence of genotypic resistance to NA is the persistence of viral replication during NA treatment. In the current study, patients with ETV resistance showed significantly higher log10HBV-DNA levels 6 months after baseline, and resultant lower probability of CVR. However, there were no significant differences in the reduction of serum log10HBV-DNA from baseline to 3, 6, 12, 24, 36, and 48 months (Fig. 2). These findings indicate that rapid (within 6 months after the initiation of NA) and complete (CVR, undetectable HBV-DNA 6 months after the initiation of NA) viral suppression was a crucial parameter that could predict the successful antiviral treatment with ETV, including the maintenance of the potent antiviral activity of ETV and no subsequent development of virologic breakthrough and genotypic resistance.
There was only one real-life cohort of ETV-treated CHB patients aiming to investigate the predictive values of various clinical parameters for long-term virologic response [18]. The study reported that lower baseline HBV-DNA levels, undetectable HBV-DNA at month 12, and negative HBeAg were independent predictors of maintained virologic suppression (defined as undetectable HBVDNA until the last visit). The current study added another assertion that lower log10HBV-DNA levels 6 months after baseline, and resultant higher probability of achievement of CVR could be predictive clinical parameters in addition to virologic response of undetectable HBV-DNA at month 12 for successful treatment outcomes of NA (and no subsequent development of genotypic resistance to ETV).
In conclusion, a significant proportion (3.1%) of CHB patients who underwent ETV 0.5 mg treatment in the setting of NA-naïve or switching to ETV after previous exposure to NA (who have no baseline HBV mutation to NA) can develop genotypic resistance to ETV. Variable clinical parameters, such as significantly higher log10HBVDNA levels 6 months after baseline, and resultant absence of CVR during the follow-up period of ETV 0.5 mg monotherapy can be predictive factors for the subsequent development of genotypic resistance to ETV and unsuccessful treatment outcomes.
Notes
Author contributions
HJ Kim had the original idea for the study, and shared responsibility equally for data collection, data processing, statistical analyses, writing, and reviewing the manuscript. YK Cho, WK Jeon, and BI Kim reviewed the manuscript and gave their critical revisions.
Conflicts of Interest: The authors have no conflicts to disclose.
Abbreviations
ADV
adefovir
ALT
alanine aminotransferase
AST
aspartate aminotransferase
CHB
chronic hepatitis B
CLV
clevudine
CTP
Child-Turcotte-Pugh
CVR
complete virologic response
DNA
deoxyribonucleic acid
ETV
entecavir
HBeAb
hepatitis B e antibody
HBeAg
hepatitis B e antigen
HBV
hepatitis B virus
HCC
hepatocellular carcinoma
LAM
lamivudine
LdT
telbivudine
NAs
nucleoside/nucleotide analogues
PCR
polymerase chain reaction
PNR
primary non-response
PVR
partial virologic response
rt
reverse transcriptase
RFLP
restriction fragment length polymorphism
SD
standard deviation