Pretreatment serum HBsAg-to-HBV DNA ratio predicts a virologic response to entecavir in chronic hepatitis B
Article information
Abstract
Background/Aims
Decay of hepatitis B surface antigen (HBsAg) titers has previously been shown to be predictive of a virologic response (VR), especially during peginterferon-alpha therapy. However, the role of HBsAg levels in predicting a VR to nucleos(t)ide analog therapy has not yet been established. In this study we sought to determine whether the VR can be predicted from HBsAg titers in nucleos(t)ide-naïve chronic hepatitis B (CHB) patients treated with entecavir.
Methods
CHB patients who started entecavir as an initial antiviral therapy were enrolled in this study. Serum hepatitis B virus (HBV) DNA, HBsAg, and alanine aminotransferase levels were measured every 3 months during treatment. A VR was defined as undetectable serum HBV DNA titer by real-time PCR assay (<60 IU/mL).
Results
Fifty-two patients were enrolled, and the median duration of treatment was 26 months (range 7-35 months). Forty-five patients achieved a VR; the cumulative VR rates at 3, 6, 12, and 24 months were 40%, 71.2%, 81.5%, and 88%, respectively. Baseline HBV DNA levels were significantly lower in patients with VR, whereas the HBsAg levels did not differ significantly between patients with or without VR. In a univariate analysis the cumulative VR rate was significantly higher in HBeAg negative patients and patients with an HBsAg/HBV DNA ratio above 0.56. However, in a multivariate analysis only an HBsAg/HBV DNA ratio above 0.56 was an independent predictor of VR (P=0.003). The area under the receiver operating characteristic curve was larger for the HBsAg/HBV DNA ratio than for either HBV DNA or HBsAg.
Conclusions
Pretreatment HBsAg/HBV DNA ratio can predict a long-term VR to entecavir therapy in nucleos(t)ide-naïve CHB patients.
INTRODUCTION
The long-term goal of treatment of chronic hepatitis B (CHB) is to prevent progression of the disease to cirrhosis, hepatic failure, and hepatocellular carcinoma.1,2 In order to assess treatment response, however, quantitative hepatitis B virus (HBV) DNA tests are used as a surrogate marker.1 Because incomplete suppression of HBV DNA may lead to emergence of resistant strains during prolonged oral nucleos(t)ide analog (NA) therapy, early viral suppression (undetectable serum HBV DNA levels at 24 weeks of treatment) is an important predictor of long-term viral suppression without viral resistance,3 especially for NAs with low genetic barriers such as lamivudine4,5 or telbivudine.6-8
Entecavir is a potent inhibitor of HBV replication with higher genetic barrier,9 and entecavir resistance is as low as 1.2% in 5 years in antiviral-naïve CHB patients.10 However, about one-third and one-fifth of hepatitis B e antigen (HBeAg) positive patients still have detectable viral DNA at week 48 and 96 of entecavir therapy, respectively.10-13 It is not certain whether lack of early viral suppression can predict poor responders to long-term entecavir therapy. Meanwhile, pre-treatment serum HBV DNA level is a significant predictor of virologic response to entecavir on week 48 by our data.14
Recently, hepatitis B virus surface antigen (HBsAg) levels have been studied as a potential predictor of virologic response after pegylated-interferon (peg-IFN) alpha therapy for CHB: in HBeAg negative CHB patients, virologic response to peg-IFN is associated with significant decline in HBsAg levels.15-17 On the other hand, the significance of on-treatment changes in HBsAg levels during oral NAs has not been fully studied: HBsAg levels were not changed during lamivudine therapy,15 whereas recent studies reported association between serum HBsAg drop and viral suppression after telbivudine18,19 or entecavir therapy.20,21 A recent study also reported association between pre-treatment HBsAg titers and virologic response to entecavr in HBeAg-positive CHB,21 but this finding needs further validation. In this study, we sought to elucidate whether long-term virologic response can be predicted from pre-treatment HBsAg titers, especially with relation to HBV DNA levels in nucleos(t)ide-naïve CHB patients treated with entecavir.
PATIENTS AND METHODS
Patients and study design
This is a retrospective, cohort study of consecutive NA-naïve CHB patients who started entecavir (0.5 mg/day) and maintained for at least 6 months between January 2008 and January 2010 at Seoul National University Bundang Hospital. All patients had serum HBV DNA levels greater than 357 IU/mL for more than six months before enrollment. Serum alanine aminotransferase (ALT) levels were more than 1.3-fold the upper normal limit. Exclusion criteria included the presence of hepatocellular carcinoma (HCC), decompensated liver cirrhosis, hepatitis C or D co-infection, and noncompliance. The institutional review board of Seoul National University Bundang Hospital approved this study (IRB no: B-1006-103-114) which was conducted according to the guidelines of the Declaration of Helsinki.
Laboratory tests
Baseline serum HBsAg was quantified using an Architect HBsAg assay (Abbott Laboratories, Abbott Park, IL, USA) according to the manufacturer's protocol. Serum HBV DNA level was determined by real-time PCR (lower limit of quantification = 60 IU/mL; Roche TaqMan HBV test, Roche Diagnostics, Basel, Switzerland). Serum HBV DNA and ALT levels were measured every 3 months after entecavir treatment began. Virologic response (VR) was defined as undetectable serum HBV DNA by real-time PCR assay (<60 IU/mL).3,22 Enzyme-linked immunosorbent assay was used to test HBeAg state.
Statistical analysis
Continuous variables which did not show normal distribution were expressed as the median with range. Differences in baseline characteristics between the patient group with or without HBeAg and VR were analyzed using Student t-test or Mann-Whitney rank sum test for continuous variables and the χ2 test for categorical variables. Pearson's correlation coefficient was tested for correlation between two variables. Area under the receiver operating characteristic (ROC) curve was calculated as previously reported23 to assess the predictive value of pre-treatment variables for VR using Medicalc version 11 (Medicalc software, Mariakerke, Belgium). A two-tailed P-value <0.05 was considered statistically significant.
RESULTS
Clinical characteristics
Fifty two treatment-naïve chronic hepatitis B patients were enrolled during the study period, and six patients were lost to follow up after 6 months of entecavir therapy. The median duration of treatment was 26 months (range: 7-35 months). The baseline characteristics of these patients are summarized in Table 1. The baseline HBV DNA levels were significantly higher in the HBeAg-positive group than in the HBeAg-negative group (P=0.001). The HBsAg levels were similar between HBeAg-positive and negative groups. However, the ratio of baseline HBsAg titer to HBV DNA level ("HBsAg/HBV DNA ratio", log10 [HBsAg]/log10 [HBV DNA]) was significantly higher in the HBeAg-negative patients (P=0.01).
Virologic response to entecavir therapy and predictors
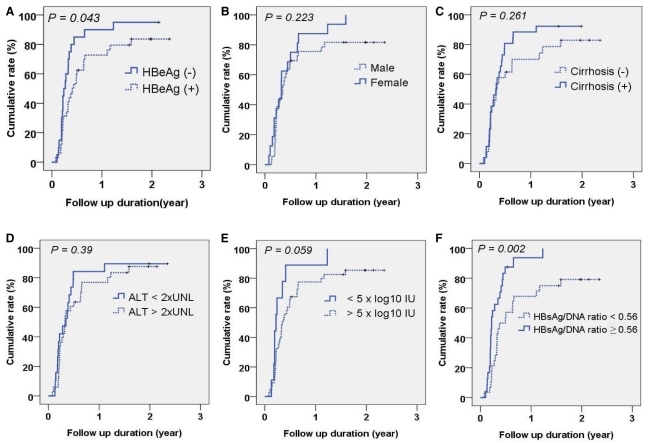
At 3,6,12 and 24 months, cumulative virologic response rates were 40.0%, 71.2%, 81.5%, and 88.0%, respectively (Fig. 1). When baseline characteristics were compared according to VR, VR (+) group showed significantly lower HBV DNA levels and higher HBsAg/HBV DNA ratio (P=0.013, 0.001, respectively; Table 2). However, HBsAg levels were not significantly different between VR (+) and VR (-) groups (P=0.278; Table 2). Univariate analysis showed that the VR rate was significantly higher in HBeAg-negative patients (55%, 85% and 95% at 3,6 and 12 months, respectively) compared to that in HBeAg-positive patients (34.4%, 62.5% and 76.1% at 3,6 and 12 months, respectively; P=0.043; Fig. 2A). Gender, presence of cirrhosis, and ALT level were not significant predictors of VR (P=0.223, 0.261, 0.39, respectively; Fig. 2B-D), whereas low pre-treatment serum HBV DNA level was associated with higher VR, although the statistical significance was marginal (P=0.059, Fig. 2F). The HBsAg/HBV DNA ratio categorized by the cut-off value of 0.56 was significantly associated with VR to entecavir therapy: cumulative VR rate at 6 and 12 months were 87.5% and 100%, respectively, in patients with the ratio ≥0.56, and 57.1% and 71.4%, respectively, in patients with the ratio <0.56. (P=0.002; Fig. 2F).

Characteristics of chronic hepatitis B patients with or without a virologic response (VR) to entecavir therapy

Univariate analysis of a VR to entecavir therapy. The cumulative VR to entecavir was analyzed by the Kaplan-Meier method and compared by the log-rank test according to (A) HBeAg positivity, (B) gender, (C) presence of cirrhosis, (D) baseline alanine aminotransferase (cutoff=80 IU/L), (E) baseline serum HBV DNA (cutoff=5×log10 IU/mL), and (F) HBsAg/HBV DNA ratio (cutoff=0.56).
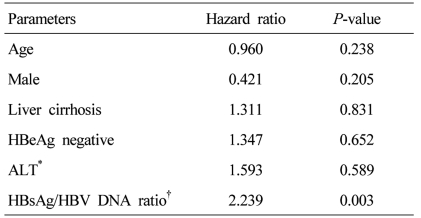
After HBeAg positivity was adjusted by multivariate analysis (Cox proportional hazard model), the high HBsAg/HBV DNA ratio was still an independent predictor of VR to entecavir therapy (Hazard ratio=2.239, P=0.003; Table 3).
Receiver operating characteristic curve analysis of HBV replicative parameters for virologic response to entecavir therapy
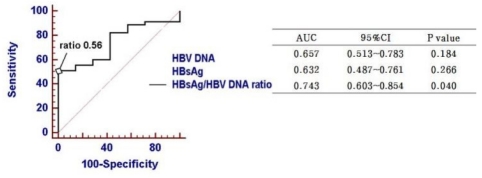
When the predictive power of HBV replicative parameters were analyzed and compared by receiver operating characteristic curve (ROC) analysis, the HBsAg/HBV DNA ratio showed the highest area under the curve (AUC) value (0.728; 95% confidence interval, 0.578-0.878, P=0.042) co mpared to HBV DNA or HBsAg titer (Fig. 3). The sensitivity and specificity of HBsAg/HBV DNA ratio in predicting VR were 51.1% and 100%, respectively, at the cut-off value of 0.56.
DISCUSSION
Previous studies showed that on-treatment decline of HBsAg titer can predict VR during peg-IFN15-17 or NA therapy.18,20,21 However, it is not established whether pretreatment HBsAg levels can predict VR to antiviral drugs. It is controversial whether baseline HBsAg titer is a predictor of sustained response after peg-IFN therapy.16,17,24 Lee et al reported that low baseline HBsAg levels were associated with VR to entecavir in HBeAg-positive CHB,21 whereas another report showed no significant association of pre-treatment HBsAg levels with response to telbivudine.18 Our data also revealed no significant association between pre-treatment HBsAg levels and VR (P=0.278; Table 2). In contrast, we found that serum HBsAg/HBV DNA ratio predict VR better than HBsAg level or HBV DNA level in nucleos(t)ide naïve CHB patients treated with entecavir (P<0.05; Fig. 3).
Recent reports have demonstrated that serum HBsAg levels vary among different stages in the natural history of CHB. HBsAg level is the lowest in the low replicative phase compared to immune tolerance, immune clearance phase and HBeAg negative hepatitis phase.25,26 Moreover, HBsAg production does not change in parallel with HBV DNA across the natural history of CHB.27 Serum HBsAg/HBV DNA ratio is higher in the low-replicative phase compared to immune-tolerant, immune-clearance and HBeAg negative hepatitis phase.25,26 Dissociation between HBV DNA and HBsAg levels may be caused by 1) HBsAg production from integrated viral genome in low-level HBV replication stage, or 2) preferential control of HBV replication by cytokine effects.27 In either case, high HBsAg/HBV DNA ratio may indicate enhanced host immunity which preferentially suppresses HBV replication pathway (transcription of pregenomic RNA), relatively sparing HBsAg transcription.27,28 If this hypothesis is true, then it is feasible that the enhanced host immunity may help to suppress HBV replication below undetectable level during entecavir therapy, leading to more frequent VR.
We have previously reported that pre-treatment serum HBV DNA level is a predictor of virologic response after entecavir therapy,14 and cohort in this paper included part of the previous study subjects. However, baseline HBV DNA was predictive of VR after 24 months of entecavir therapy with only marginal statistical significance (P=0.059; Fig. 2), probably due to smaller sample size in this study. There was wide overlap of HBV DNA levels between VR (+) and VR (-) groups, whereas HBsAg/HBV DNA ratios can better differentiate the two groups at the cut-off value of 0.56 by ROC analysis (Fig. 3). As this study enrolled limited numbers of patients, baseline HBV DNA levels might also have been a predictor of virologic response if more patients had been enrolled. Further study is warranted to validate the superiority of HBsAg/HBV DNA ratio over HBV DNA level with larger sample size and longer duration of treatment.
HBsAg levels tend to be higher in HBeAg-positive CHB compared to HBeAg-negative CHB in previous studies,25,26 whereas the difference was not significant in our data (P=0.071; Table 1). The study from Asia reported that HBsAg levels are genotype-dependent25: the difference in HBsAg levels tend to be smaller between immune clearance and HBeAg-negative CHB in genotype C which is the exclusive genotype in Korea. Interestingly, the HBsAg/HBV DNA ratios of immune clearance (HBeAg-positive) and HBeAg-negative CHB in our study are nearly identical to those from those previous studies,25,26 suggesting that this marker may be reproducible regardless of ethnicity or genotypes.
Our data shows that pre-treatment HBsAg/HBV DNA ratio over 0.56 can predict long-term virologic response (hazard ratio=2.239, P=0.003; Table 3). Pre-treatment predictor (HBsAg/HBV DNA ratio) may have clinical advantage over on-treatment HBsAg level changes in predicting VR because other potent NA (eg. tenofovir) may be tried in patients who have low pre-treatment probability of VR to entecavir. As our study has not evaluated on-treament HBsAg changes, this issue should be elucidated in further studies.
In conclusion, pre-treatment serum HBsAg/HBV DNA ratio can predict long-term VR to entecavir therapy in nucleos(t)ide-naïve CHB patients.
Abbreviations
ALT
alanine aminotransferase
AUC
area under the curve
CHB
chronic hepatitis B
HBV
hepatitis B virus
NA
nucleos(t)ide analog
peg-IFN
pegylated interferon
ROC
receiver operating characteristic curve
VR
virologic response


