| Korean J Hepatol > Volume 17(3); 2011 > Article |
Hepatic hemangioma is the most common benign tumor of the liver. Recently its frequency of detection has increased with the introduction of nation-wide cancer screening programs and technical improvement of radiological modalities such as computed tomography (CT) and ultrasonography. Radiological findings of typical hemangioma are well-known. However, sometimes, there are some atypical findings of hemangioma due to complications such as thrombosis, infarction, hemorrhage or sclerosis.1,2 Therefore, they can be frequently misdiagnosed and confused with other malignant hepatic tumors.
In this report, a case of sclerosing hepatic hemangioma is presented with radiological findings.
A 50-year-old male was admitted with the complaint of an incidentally detected liver mass. He has lost 6 kg weight during recent 2 months, so he took precise health examination, and he was diagnosed as diabetes mellitus. Also a large hepatic mass was detected on abdominal CT scan. He did not present specific symptoms such as abdominal pain or anorexia. Physical examination revealed no specific findings such as hepatomegaly, either.
The laboratory findings showed red blood cell count of 5.33├Ś106/mm3, hemoglobin level of 16.3 g/dL, and hematocrit of 46.8%. White blood cell count was 6,800/mm3 and platelet count was 282,000/mm3. Biochemical tests showed that the serum level of alanine aminotransferase was 26 IU/L, aspartate aminotransferase was 23 IU/L, and alkaline phosphatase was 98 IU/L. Serum protein was 7.6 g/dL and albumin was 4.2 g/dL. Total bilirubin was 0.8 mg/dL. Alpha-fetoprotein was 2 ng/mL, and carcinoembryonic antigen was 0.79 ng/mL. The results for hepatitis B surface (HBs) antigen and anti-HBs were negative.
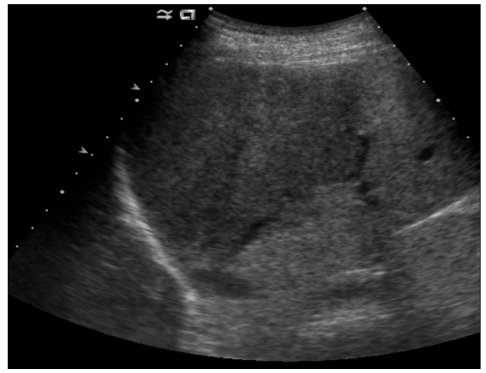
Ultrasonography showed large liver mass in right lobe (Fig. 1). It showed well marginated mass with internally heterogeneous mixed echo containing echogenic area and hypoechoic area. CT showed 10 cm sized and irregular homogenously low attenuated round masses in the liver on precontrast scan (Fig. 2A). It showed heterogeneous, patch irregular enhancement mainly in peripheral area, and enhancement advanced into the central area gradually on portal phase and delayed phase (Fig. 2B-D). There was partial central unenhanced low attenuation area on delayed phase.
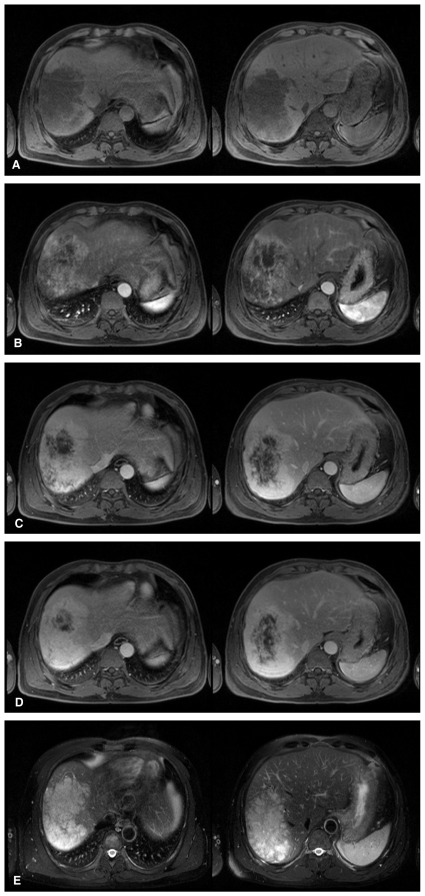
Magnetic resonance imaging (MRI) showed similar enhancement pattern with dynamic CT scan (Fig. 3A-D). Contrast enhancement was done with gadolinium-BOPTA (Multihance®, TaeJoon, Seoul, Korea), and images were taken at 10, 50 and 300 seconds after contrast injection. On T2-weighted image, the mass showed diffuse homogenous high signal intensity including the central area which was not enhanced on delayed phase contrast-enhanced scan (Fig. 3E). The Central unenhanced area was suggested as sclerotic mesenchyma, not necrosis.
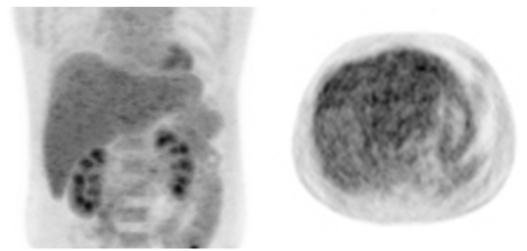
Fluorodexoyglucose positron emission tomography (FDG-PET) scan showed iso- to hypometabolic mass in right lobe of the liver (Fig. 4).
The mass was radiologically diagnosed as sclerosing hemangioma. Percutaneous fine-needle-aspiration biopsy was performed in right lobe mass under ultrasound guidance for differential diagnosis with cholangiocellular carcinoma. Histological examination of the biopsy specimen showed cavernous hemangioma with sclerosis. The final diagnosis was sclerosing hemangioma.
Cavernous hemangiomas of the liver can be found incidentally and may be readily diagnosed due to their characteristic radiological findings. Hemangiomas consist of endothelium-lined blood-filled spaces separated by fibrous septa. Cavernous hemangiomas in the liver usually present as solitary well-delineated, subcapsular, discolored nodules that are smaller than 5 cm.3 They can exhibit various forms of pathology, such as necrosis, scarring, and calcification, some of which mimic the primary or metastatic malignancy.
The characteristic radiological findings of hepatic hemangiomas are: 1) homogenous hyperechogenic mass on ultrasonography, 2) low attenuation mass on precontrast scan, 3) early peripheral contrast enhancement with nodular pattern, 4) progressive opacification from periphery to the center, 5) eventual isodense fill-in on delayed contrast scan of CT or MRI, 6) "light-bulb" like very high signal intensity on heavily T2-weighted image on MRI. With the typical hemangiomas, imaging modalities are highly reliable for diagnosis, especially MRI, which has a sensitivity and specificity of >90%. However, only about 50% of all hemangiomas show these typical radiological findings.4 The diagnosis of some atypical hemangiomas remains uncertain with an MRI study owing to the presence of intralesional thrombosis or calcified, hyalinized, or cystic components that result in the loss of its characteristic appearance of markedly high signal intensity on heavy T2-weighted imaging and present with atypical enhancement patterns on postenhanced study.5 In these cases, it can lead to misdiagnosis and confusion with other hepatic tumors including malignant tumor. So, these cases require biopsy and histopathological examination.
Some pathological changes are responsible for the variations of the radiological findings of hemangioma. Of these complications, sclerosing hemangiomas can have a variable amount of stroma, varying from scanty (fibrillar or hyaline) to abundant (hyaline or sclerotic), and sclerosed hemangiomas are characterized by extensive fibrosis with subsequent hyalinization and marked narrowing or obliteration of the vascular spaces.5 Makhlouf and Ishak have reported that there are distinct clinical and histopathological differences between sclerosing and sclerosed hemangiomas; they suggested that recent hemorrhages and hemosiderin deposits, rich with mast cells are present in the sclerosing hemangioma.6 Moreover, fibrosis, increased elastic fibers, and dystrophic or psammomatous calcifications with a decreased number of mast cells can be observed in the sclerosed hemangioma.6
The radiological findings of sclerosing and sclerosed hemangiomas have rarely been reported. Sclerosing hemangiomas may show mild to moderate hyperintensity on T2 weighted MRI images, patchy central enhancement during the arterial phase, and gradual progressive enhancement during the portal venous and the delayed phases, except in the central area, mimicking hepatocellular carcinoma.7 Another report showed only marginal enhancement on CT hepatic arteriography, whereas most parts remain a perfusion defect; they may also show marginal pooling on CT and MRI during the delayed phase, mimicking metastatic tumors.8 Many other reports showed that delayed enhancement on dynamic CT and the hypointensity relative to fluid on T2-weighted MRI may correspond to sclerosis.2,5 Unlike typical hemangiomas, peripheral globular enhancement was not seen and, instead, multifocal patchy enhancement was seen during the arterial phase, but this was less intense than that of the hepatic artery. Also, patchy progressive tumoral enhancement seen during the portal venous and the delayed phases was less intense than that of the hepatic parenchyma in most of the mass. Most parts of the mass showed intermediate signal intensity on T2 weighted images. Pathologically, these atypical radiological features were attributed to prominent sclerosis and marked narrowing of vascular spaces. The lower globular enhancement compared with that of the hepatic vessels, together with the intermediate signal intensity on T2 weighted images may correspond with compression of vascular spaces owing to pericapillary smooth muscle proliferation.5 According to above findings, differential diagnosis with hepatocelluar carcinoma, cholangiocellular carcinoma, metastasis or organized abscess is sometimes difficult. So, pathological confirmation might be needed.
It has been postulated that central non-opaicified areas might be related to slow blood flow in the central sinusoids, necrosis, fibrosis, central thrombosis, or hemorrhage.4 In another report, consistent low attenuation on unenhanced and dynamic CT scans and bright high signal intensity on T2 weighted MR images, was pathologically composed of a hyalinized portion.5 It is particularly important that CT appearances of sclerotic nodule in hepatic hemangioma might be confused with other malignant tumors with necrosis.4 However, in our case, there was unenhanced area on delayed phase scan, but it did not present more hypoattenuated area on unenhanced scan nor higher signal intensity areas on T2 weighted MR images, so it was postulated as sclerosing mesenchyma with very slow contrast enhancement, not hyalinized area.
In conclusion, although sclerosis and other pathological complications are rare in hepatic hemangiomas, an awareness of this complication and an understanding of the pathological background of its atypical radiological appearances are important. Percutaneous biopsy may make unnecessary surgery avoidable.
In the present case above, the mass showed high signal intensity on T-2 weighted images as like typical hemangioma. However, typical peripheral nodular enhancement was not seen and there was central unenhanced low attenuated area until delayed phase on CT and MRI, so sclerosing hemangioma was suspected. To differentiate from other hepatic tumors, biopsy was done, and pathologically sclerosing hemangioma was confirmed.
REFERENCES
1. Vilgrain V, Boulos L, Vullierme MP, Denys A, Terris B, Menu Y. Imaging of atypical hemangiomas of the liver with pathologic correlation. Radiographics 2000;20:379-397. 10715338.


2. Aibe H, Hondo H, Kuroiwa T, Yoshimitsu K, Irie H, Tajima T, et al. Sclerosed hemangioma of the liver. Abdom Imaging 2001;26:496-499. 11503087.


4. Shim KS, Suh JM, Yang YS, Kim JG, Kang SJ, Jeon JS, et al. Sclerosis of hepatic cavernous hemangioma: CT findings and pathologic correlation. J Korean Med Sci 1995;10:294-297. 8593211.


5. Choi YJ, Kim KW, Cha EY, Song JS, Yu E, Lee MG. Case report. Sclerosing liver haemangioma with pericapillary smooth muscle proliferation: atypical CT and MR findings with pathological correlation. Br J Radiol 2008;81:e162-e165. 18487382.


6. Makhlouf HR, Ishak KG. Sclerosed hemangioma and sclerosing cavernous hemangioma of the liver: a comparative clinicopathologic and immunohistochemical study with emphasis on the role of mast cells in their histogenesis. Liver 2002;22:70-78. 11906621.


Figure┬Ā1
Ultrasonography of 50-year-old male showed a large hepatic mass with internally heterogeneous echo.

Figure┬Ā2
Dynamic contrast enhanced CT scans. (A) Precontrast CT scan revealed large irregular homogenously low attenuated mass in liver right lobe. There was no calcification or hypoattenuated area in the mass. (B) Arterial phase of dynamic contrast enhanced CT scan showed large irregular, patch enhancement in peripheral area of mass. (C and D) Portal phase and delayed phase of CT scan showed gradual progressive centripetal enhancement from periphery to central area, except for central areas of low attenuation probably representing sclerosis.

Figure┬Ā3
Dynamic contrast enhanced MRI scans. (A) T1 weighted image showed large low signal intensity mass in liver. (B, C, and D) After contrast enhancement, the mass showed similar enhancement pattern with those of dynamic CT scans. (E) T2 weighted image showed high signal intensity mass including central area which was not enhanced on contrast-enhanced scans and was suspected as sclerotic area.


 PDF Links
 PubReader
 ePub Link
 Full text via DOI
 Full text via PMC
 Download Citation
 Print
Print


