The cost of liver disease in Korea: methodology, data, and evidence
Article information
Abstract
Background/Aims
This study introduces methods for estimating the cost of liver disease and presents useful and reliable sources of data. The available evidence on the costs associated with liver disease is also discussed.
Methods
Costing methodology can be used to identify, measure, and value relevant resources incurred during the care of patients with liver diseases. It adjusts for discounting, skewed distribution, and missing or censored cost data. The human capital approach for productivity cost assumes that deceased patients would have lived to a normal expected life expectancy, and have earned a salary in line with the current age profile of wages, in order to measure potential earnings lost due to premature death or job loss.
Evidence
The number of deaths due to liver cancer (C22) increased from 6,384 in 1983 to 11,405 in 2013, while deaths due to other liver diseases (K70-K76) increased from 12,563 in 1983 to 13,458 in 1995, and then declined to 6,665 in 2013. According to the Global Burden of Disease study conducted by the World Health Organization, liver cancer caused 325,815 disability-adjusted life years (DALYs), and cirrhosis of the liver caused 206,917 DALYs in 2012. The total cost of liver disease was estimated at 1,941 billion Korean won in 2001 and 5,689 billion Korean won in 2008. Much of this cost is attributable to productivity cost, and especially that of economically active men.
Conclusions
The economic burden of liver disease is immense because of the associated high mortality and morbidity, especially among the economically active population. This indicates the need to prioritize the development of appropriate health interventions.
INTRODUCTION
Liver disease has become one of the most important public health concerns with increasing life expectancy in Korea.1 It is associated with a significant increase in mortality and risk of many morbidities. For example, in 2013 diseases of the digestive system (K00-K92) were the 7th leading cause of death with 11,170 deaths (22.1 per 100,000 people) of which 6,665 deaths (13.2 per 100,000 people) were due to liver disease (K70-K76).2 There were 11,405 (22.6 per 100,000 population) deaths due to malignant neoplasm of liver and intrahepatic bile ducts (C22) in 2013. Even worse, the number of deaths due to liver disease (K70-K76) were higher for men and the economically active population: 1,087 (25.1 per 100,000 people) among 50-54 year olds and 963 (44 per 100,000 people) among men aged 50-54 years in 2013.
This high mortality of liver disease among the economically active population means the economic burden of liver disease can be immense for individuals, families, and society. Disease burden can be measured by prevalence, fatality rate, decline in health status and quality of life, and financial cost. Ever increasing use of economic evaluation in the medical sector means reliable cost estimation is essential to formulate health care policies for efficient resource allocation.
This study discusses how to identify, measure, and value costs. Next, we explore issues of analyzing cost data such as skewed distribution and missing or censored data. We also outline useful and reliable sources of data and their limitations. Then, we explore and discuss the available evidence on the costs of liver disease.
PATIENTS AND METHODS
Identifying, measuring, and valuing costs
Costing methodology has three components: identification, measurement, and valuation of relevant resources.3 For an example of surgical intervention, we begin to identify the different categories of resource required (e.g. theatre staff, consumables and equipment, recovery time, surgical complications, re-admissions). At measurement level, we estimate how much of each resource category is required (e.g. type of staff and time involved, post-surgery length of stay, re-admission rates). Finally, at the valuation stage, we apply unit costs to each resource category (e.g. salary scales from the relevant hospital or national wage rates for staff inputs, cost per inpatient day for the post-surgery hospital stay). Simply put, costs are calculated by quantifying the different types of resources used for a medical intervention and then multiplying these amounts by their respective unit costs.
An understanding of production function in complementing and substituting relevant resources is necessary to identify the different types resources used. Moreover, the perspective of the study also affects the scope of resources to consider. Two main alternative perspectives are the payer (e.g. National Health Insurance Service) and society. From the payer's perspective, costs to be incurred by the payer alone matters, maximizing value for money under the budget of, for example, National Health Insurance (NHI). From the societal perspective, all costs incurred, including productivity costs, matter-maximizing efficient resource allocation within society.4
When all the relevant resources are identified and measured, appropriate unit costs should be used in valuing them. Theoretically, the unit cost of a resource should be its opportunity cost, the value of the best alternative foregone. In practice, market prices are used. When a market price is not available, the (shadow) price of a comparable one for which a price exists can be used instead. The medical services covered by the Korean NHI have a regulated price list. Where these prices do not reflect the resources' opportunity costs, however, they should be either inflated or deflated to reflect them accurately.
The types of costs are summarized in Table 1 with their sources: medical costs and non-medical costs. Non-medical costs include transportation, informal nursing costs, and productivity costs. Informal nursing care is often provided by family members at no cost. Therefore, shadow pricing on the time of family members as mentioned above, either opportunity costs of their time or replacement costs of using professional caregivers instead should be used.

Types, description, and sources of cost data
Productivity costs are defined as "costs associated with production loss and replacement costs due to illness, disability and death of productive persons, both paid and unpaid".5 Three approaches are used to calculate productivity costs: the human capital approach, the friction cost method, and the US Panel approach.3,6 Because of advantages and disadvantages associated with the three approaches, only 10.4% of 1,039 cost-effectiveness studies had incorporated productivity losses.7 The most widely used human capital approach estimates the potential earnings lost due to illness. It is criticized for adopting unrealistic assumptions of full employment and discriminating against those outside the formal labor force, such as students, stay-at-home parents, and the elderly.3,6 The friction cost approach adjusts the human capital approach so that the cost is calculated only with reference to the friction period, time required to replace a sick worker and reach the productivity level that the worker achieved before the illness. Its implication that opportunity cost of labor is set to zero after the friction period is, however, much criticized. The US panel approach distinguishes between patients' time for treatment (time costs) and other time (morbidity costs), and recommend the human capital approach for the valuation of the former and health-related quality of life measures for the valuation of the latter.
Adjustments
Once all costs are identified, measured, and valued, discounting adjustment should be made when costs occur at different times. All costs should be adjusted to a base year to eliminate the effects of inflation using measures of domestic inflation such as consumer price index, which reflects the change in cost in purchasing a fixed basket of goods or services. Moreover, costs should be discounted to a base year to account for time preference and opportunity cost. Costs are preferred to incur later rather than immediately and can be invested at a real rate of return. When a discount rate is r, future costs at times 1, 2, ..., n can be discounted to the present value (to the base year of 0) using the formula: 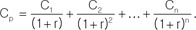
Furthermore, there are several other issues to be addressed when analyzing cost data. First, cost data often have a distribution that is skewed to the right. Many patients have zeros for some costs and a few patients have substantially large costs. Several approaches can be taken to deal with this problem of skewed cost data, such as a log transformation, bootstrapping, and generalized linear model. Specifically, Nixon et al.8 found that, methods reliant on the central limit theorem and bootstrapping estimated the true standard errors when sample size is greater than 50, but the former led to slightly more accurate standard errors when sample sizes is relatively small.
Second, cost data can be missing or censored. Simple approaches are complete-case analysis and available-case analysis that use complete or available cases alone. If cost data is not randomly missing or censored, these simple approaches can lead to biased results. An alternative approach is to impute values for missing data.9 Meanwhile, censoring may occur in estimating and analyzing over-time costs when the patients die or are lost to follow up. Two popular methods for this censoring are the Kaplan-Meier sample average estimator and the inverse probability weighting estimator.3 The product of mean cost and survival probability for each period is summed up to make the estimated total cost in the former method, and the total cost divided by survival probability per each period is summed up and divided by the number of patients at the beginning in the latter method.
Sources of data
The most popular data source for medical cost is NHI claims data, summarized and presented in its statistical yearbook by Health Insurance Review & Assessment Service and NHI Service. It has several advantages of being comprehensive and extensive in calculating per-person medical cost with specific disease (by 298 classifications of disease); the limitations are that costs of comorbidities are included and costs for services and poor patients, not covered by the NHI, are excluded. Medical costs for services not covered by the NHI can be estimated using data from the Survey on the benefit coverage rate of the NHI by the NHI Service. Nevertheless, it is important to note that the data provides estimated gross ratio of uninsured costs to total cost, not by diseases, from a selected sample (for example 838 medical institutions out of 63,156 in 2010).10
Meanwhile, list prices for the services covered by the NHI may not reflect the resources' opportunity costs. Estimates of UK national unit costs for a wide range of health and social care services are available in the annual publication of Unit Costs of Health and Social Care.11 Another data source of the Korea National Health and Nutrition Examination Survey (KNHANES) can be used to supplement the data from the NHI but it provides total medical costs from selected samples, but not costs by diseases.
The first nonmedical cost is transportation cost, for which Korean Health Panel Survey (KHPS) provides data on the kind of transportation and one-way cost for inpatients and outpatients separately. When patients are accompanied by somebody, total costs including companion's costs are provided. When patients used their own cars for transportation, however, these costs are not reported and thus excluded in the data (47.95% of inpatients and 22.84% of outpatients used their own cars, for example, in 2008).12 These one-way costs can be used together with number of visits for inpatients and outpatients to calculate transportation cost. However, the NHI statistical year book provides data on the number of visits by diseases for outpatients alone.
The second non-medical cost is informal nursing costs by professional caregivers or non-professional ones, for example family members. The KHPS and Korea Patient Helper Society provide daily costs of professional caregivers. As for costs of non-professional caregivers, either opportunity costs of their time or replacement costs of using professional caregivers can be used instead. These daily nursing costs can be used together with days of hospitalization to calculate the informal nursing cost. The NHI statistical year book provides data on days of hospitalization.
Finally, the non-medical cost is the productivity cost, "costs associated with production loss and replacement costs due to illness, disability and death of productive persons, both paid and unpaid".5 The most widely used human capital approach estimates the potential, not actual, earnings lost due to illness.
The major productivity costs are earnings lost due to premature death or job loss. The human capital approach estimates the potential earnings lost by the deceased in his or her lifetime after death. The approach uses the number of deaths by diseases from the Cause of Death Statistics, average life expectancy and survival rate from the Life Tables, employment rate from the Economically Active Population Survey, and wages from the Survey on Labor Conditions by Employment Type (see the equation in the Results section).
The second productivity costs are earnings lost due to absences from work to visit medical institutions. It multiplies amount of time for medical care use by value of time. The amount of time for medical care use includes times incurred for transportation, waiting, and treatment. The KHPS provides only the data for transportation time. The NHI statistical year book provides data on the days of hospitalization for inpatients and number of visits for outpatients, and one outpatient visit is counted as 1/3 day of hospitalization in general. Value of time can be estimated using daily or hourly wages from the Survey on Labor Conditions by Employment Type for the private sector employed workers, excluding self-employed workers.
RESULTS
According to the Global Burden of Disease study by WHO, cirrhosis of the liver caused 1,020,891 deaths (14.4 per 100,000 population) and 1.8% of all deaths worldwide in 2012. Separately, liver cancer caused 740,373 deaths (10.5 per 100,000 population) and 1.3% of all deaths. The same source shows that cirrhosis of the liver caused 36,039,737 disability adjusted life years (DALYs) (1.3% of total DALYs) and liver cancer caused 21,264,929 (0.8%).13,14,15
The data for Korea from the same source shows that liver cancer caused 11,962 deaths and cirrhosis of the liver caused 6,169 deaths in 2012. Liver cancer also caused 325,815 DALYs and cirrhosis of the liver caused 206,917 DALYs in 2012.13,14,15
According to a different source of data, the annual report on the cause of death statistics from Statistics Korea, diseases of the digestive system (K00-K92) was the 7th leading cause of death in 2013, causing 11,170 deaths (22.1 per 100,000 population) and of those 6,665 deaths (13.2 per 100,000 population) were due to liver diseases (K70-K76).2 Deaths due to malignant neoplasm of liver and intrahepatic bile ducts (C22) were 11,405 (22.6 per 100,000 population) in 2013.
Figure 1 shows the trend of number of deaths due to liver diseases from 1983 to 2013. Number of deaths due to liver cancer (C22) increased from 6,384 in 1983 to 11,405 in 2013. Simultaneously, deaths due to other liver diseases (K70-K76) increased from 12,563 in 1983 to 13,458 in 1995 and then declined to 6,665 in 2013.

Number of deaths due to liver diseases (C22, K70-K76).
Sources: The Cause of Death Statistics, Statistics Korea.
Table 2 presents the distribution of deaths by sex and age in 2013. More men died because of liver diseases than women. A total of 8,421 men (73.8%) died due to liver cancer compared to 2,984 (26.2%) women and 5,186 men (77.8%) died because of other liver diseases compared to 1,479 (22.2%) women in 2013. Moreover, members of the economically active population died more than others. 1,087 people (16.3%) and 963 men (18.6%) aged 50-54 years died because of liver diseases (K70-76) in 2013.
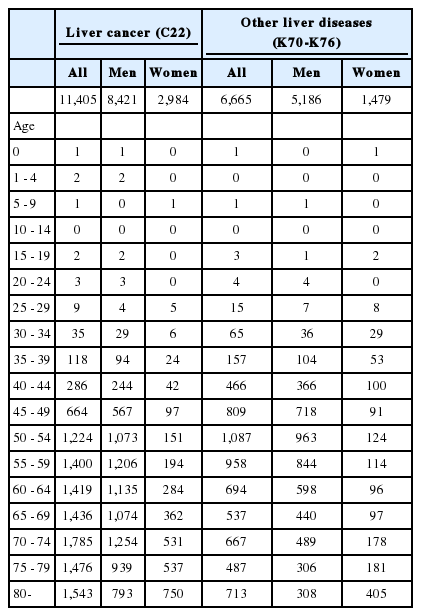
Deaths due to liver disease according to sex and age (in 2013)
Unlike mortality, it is hard to compare the costs of liver disease across countries and times because of differences in medical systems, labor markets, and other factors. The economic impact of liver disease in the United States are summarized in a recent report sponsored by the American Gastroenterological Association (AGA), which estimated total cost of 9,779 million (in 1998 US$) for liver diseases including chronic liver disease and cirrhosis, chronic hepatitis C, liver cancer, and gallbladder disease.16
The first notable work to estimate costs of five major illnesses such as cancer, cerebrovascular diseases, heart diseases, diabetes mellitus, and liver diseases in Korea was done by Jung and Ko17, but in this study liver cancer was classified into the cancer category, not liver disease. The total cost of liver disease is estimated to 1,941 billion won in 2001 (see Table 3). These are divided into 203 billion won for medical cost (10.44%), 14 billion won for transportation cost (0.7%), 28 billion won for informal nursing cost (1.46%), and 1,696 billion won for productivity cost (87.40%). Therefore, much of the total cost is due to productivity cost, which is in turn mainly due to potential earnings lost by premature death (84.23% of total cost). Because of this high productivity cost, liver diseases had second largest cost right after cancer even though it was the fifth cause of death among the five major illnesses.

Evidence of liver-disease costs
Recently, Lee et al.1 estimated the costs of liver diseases from 2004 to 2008. Specifically, their liver diseases cover viral hepatitis (B15-B19), malignant neoplasm of the liver (C22), and liver cirrhosis and other liver diseases (K70-K76). The total cost of liver disease is estimated to 5,689 billion won in 2008 (latest year in the paper). They are divided into 1,032 billion won for medical cost (18.15%), 7 billion won for transportation cost (0.12%), 133 billion won for informal nursing cost (2.34%), and 4,516 billion won for productivity cost (79.39%). Similar to Jung and Ko, much of total cost is due to productivity cost, which is also due to potential earnings lost by premature death in turn (73.92% of total cost), especially of economically active men.
Meanwhile, different methodology, data, and assumptions used make it hard to compare results from the two papers. For example, Jung and Ko used number of deaths (D), average life expectancy and survival rate from the Life Tables, employment rate (E), and yearly wages (W) alone to calculate productivity cost due to premature death (PCpd, see equation below), but Lee et al. adjusted it using probability of survival and wage growth rate additionally. Therefore, Jung and Ko estimated the potential earnings lost by the deceased in his or her lifetime after death, while Lee et al. estimated them conditional on survival probability and wage growth rate additionally. 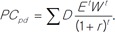
Note that even in the same paper of Lee et al., using the same methodology and assumptions, total costs changes dramatically from 5,858 (in 2004), to 5,572 (in 2005), to 8,104 (in 2006), to 6,095 (in 2007), and to 5,689 billion won in 2008. Changes in the number of liver disease patients and their compositions may explain much of this cost change over time.
DISCUSSION
Ever increasing use of economic evaluation in the medical sector means accurate and reliable cost estimation is essential to formulate health care policies to prioritize health interventions and to allocate resources efficiently. The high mortality and morbidity of liver disease among the economically active population means the economic burden of liver disease can be immense to individuals, families, and society.
Aside from identification, measurement, and valuation of relevant resources for the care of liver diseases, costing methodology adjusts for discounting, skewed distribution, and missing or censored cost data. Meanwhile, the estimated cost should be taken into account cautiously in consideration of data limitation. For example, the most popular data source for medical cost, the NHI claims data, does not provide costs for services and poor patients not covered by the NHI, and its regulated list prices may not reflect the resources' opportunity costs.
Practically, medical costs for services not covered by NHI can be estimated using data from the Survey on the benefit coverage rate of NHI by the NHI Service. Nevertheless, the data provides estimated gross ratio of uninsured costs to total cost from a selected sample (for example 838 medical institutions out of 63,156 in 2010).10 Even worse, data is not available for each disease category and the estimated ratio changes severely from 40.25(year 2004), to 40(2005), to 27.75(2006), to 25(2007), and to 30.38(2008) for inpatient services and from 20.63(year 2004), to 18.76(2005), to 17.37(2005), to 19.90(2005), and to 21.07(2005) for outpatient services.1 These changes may be subject to measurement or sampling errors.
As for transportation costs, the number of visits are not available for inpatients and thus these are missing in the calculation. The days of hospitalization for liver disease was 2,217,455 days in 2008.1 Therefore, substantial amount of transportation cost is missing in calculation for inpatients. Another non-medical cost is informal nursing costs by professional caregivers or non-professional ones, for example family members. The fact that much informal nursing is being provided by family members makes it necessary to examine whether the current replacement costs in use is a good enough proxy for family members' opportunity costs of time.
The current most widely used human capital approach for productivity cost is criticized for adopting unrealistic assumption of full employment and discriminating against those outside the formal labor force, such as students, stay-at-home parents, and the elderly.3,6 The major potential earnings lost due to illness is earnings lost due to premature death or job loss. These costs are estimated under the assumption that the deceased patients would live up to life expectancy, and work and earn following the current age profile of employment rate and wages. The plausibility of these assumptions should be examined and then applied with adjustments if required.
Furthermore, the estimated potential earnings lost due to premature death or job loss need to be discounted to a base year value using a discount rate. 5% of discount rate is used in Lee et al. and 0%, 3%, and 5% are used in Jung and Ko. Kim et al.12 suggests we use 5% discount rate for a basic analysis and examine the sensitivity of results to the 0%, 3%, and 7.5% discount rates. The UK Treasury recommends 3.5% for the first 30 years and 3% thereafter.18
Finally, one outpatient visit is counted as 1/3 day of hospitalization in general owing to data availability to calculate potential earnings lost due to absences from work to visit medical institutions. Its plausibility should be examined too. Notably, only 10.4% of 1,039 cost-effectiveness studies had incorporated productivity losses because of advantages and disadvantages associated with different approaches.7 Therefore, the sensitivity of cost estimation to different assumptions and methodologies should be examined all the time to obtain more accurate knowledge.
In spite of the limitations that should be taken into account, however, the immense economic burden of liver diseases due to high mortality and morbidity, especially among the economically active population, prioritizes health interventions to allocate resources efficiently.
Acknowledgement
This research was supported by Hallym University Fund (HRF-201309-010).
Notes
Conflicts of Interest: The authors has no conflicts to disclose.
Abbreviations
DALYs
disability adjusted life years
KHPS
Korean health panel survey
NHI
national health insurance