Clin Mol Hepatol > Volume 20(1); 2014 > Article
Jung, Kim, Kim, Lee, Jeong, Jang, Lee, Kim, and Kim: The impact of pegylated interferon and ribavirin combination treatment on lipid metabolism and insulin resistance in chronic hepatitis C patients

ABSTRACT

Background/Aims

Lipid profile and insulin resistance (IR) are associated with hepatitis C virus (HCV) and may predict the chronic hepatitis C (CHC) treatment response. The aim of this study was to determine the association between CHC treatment response and lipid profile and IR change during treatment.

Methods

In total, 203 CHC patients were reviewed retrospectively between January 2005 and December 2011 at Soon Chun Hyang University Hospital. The lipid profile, homeostasis model for assessment (HOMA) of IR (HOMA-IR), and HOMA of β cells (HOMA-β) were evaluated before interferon plus ribavirin therapy (BTx), at the end of treatment (DTx), and 24 weeks after the end of treatment (ATx).

Results

A sustained virologic response (SVR) was achieved by 81% of all patients (49/60), 60% (n=36) of whom possessed genotype 1, with the remainder being non-genotype-1 (40%, n=24). Apart from age, which was significantly higher in the non-SVR group (SVR, 48.0±11.2 years, mean±SD; non-SVR, 56.6±9.9 years; P<0.01), there were no significant differences in the baseline characteristics between the SVR and non-SVR groups. In the SVR group, low density lipoprotein-cholesterol (LDL-C) had significantly changed at DTx and ATx compared to BTx. In addition, HOMA-IR and HOMA-β were significantly changed at DTx in the SVR group. Among those with a high baseline insulin resistance (HOMA-IR >2.5), HOMA-IR was significantly changed at DTx in the SVR group.

Conclusions

LDL-C appears to be associated with HCV treatment in SVR patients. Furthermore, eradication of HCV may improve whole-body IR and insulin hypersecretion, as well as high baseline insulin resistance (HOMA-IR >2.5).

INTRODUCTION

Chronic hepatitis C affects an estimated 1-2% of the Korean population and is one of the leading causes of liver cirrhosis and hepatocellular carcinoma in Korea and is closely linked to insulin resistance (IR) and lipid metabolism.1,2 Moreover, in hepatitis C virus (HCV) antibody-positive patients, glucose intolerance in the absence of diabetes was reported to be 3.5-fold higher than in HCV antibody-negative patients.3
Interferon (IFN), in combination with ribavirin (RBV), is the standard treatment used to eradicate viruses and prevent the progress of liver disease in CHC patients. Sustained virologic response (SVR) is predicted by negative HCV RNA at week 4 or 12 of treatment. However, rapid normalization of alanine aminotransferase (ALT) also predicts viral response during treatment in CHC patients.4 Moreover, HCV is related to the onset and progress of lipid metabolism; therefore, total cholesterol (TC) and low-density lipoprotein cholesterol (LDL-C) levels are useful factors in terms of predicting the effects of IFN therapy.5
Minuk et al6 reported that patients with high serum cholesterol concentrations had a greater likelihood of successful treatment with IFN, suggesting that serum lipid concentration may be an important predictive factor for response to CHC treatment. This study tracked differences in lipid profile and IR prior to treatment and after treatment in CHC patients who received combination therapy with IFN and RBV.

PATIENTS AND METHODS

Patients

During the study period, 203 patients received combination therapy with IFN and RBV for CHC at Bucheon Hospital in Soonchunhyang University from January 2005 to December 2011. Among these patients, 60 underwent continuous measurement of lipid levels and homeostasis model for assessment (HOMA) values and were compared to 23 chronic hepatitis B (CHB) patients who received IFN therapy and underwent continuous measurement of lipid levels and HOMA values. We excluded patients who were administered a lipid-lowering agent or a glucose-lowering agent, such as metformin, glitazones or subcutaneous insulin, which could affect lipid metabolism or IR. Alcohol intake was limited to 40 g for males and 30 g for females once per week. In addition, routine exercise and diet control were recommended for each patient to limit these variables during the study period.
Patients received a subcutaneous injection of 180 µg peg-IFN-α-2a or 1.5 µg/kg peg-IFN-α-2b once per week, together with 1200-mg RBV to those patients with HCV genotype 1, and 800-mg RBV to those without non-HCV genotype 1. HCV RNA levels were measured using a quantitative polymerase chain reaction (PCR) assay (Artus HCV RG reverse transcription [RT]-PCR kit; Qiagen, Hamburg, Germany).
Insulin and fasting blood glucose were calculated for HOMA-IR and HOMA-β to measure IR, and changes between pre- and post-treatment were examined in the high-IR group, defined as a pre-treatment HOMA-IR >2.5. SVR was defined as HCV RNA clearance 24 weeks after the end of treatment. To determine whether these changes were due to IFN, changes in lipid levels and HOMA values in the CHB patients were compared to virologic responses pre-treatment, and at 24 and 48 weeks after treatment.
The period before treatment was defined as BTx, the end of the treatment as DTx, and 24 weeks after end of the treatment as ATx. HOMA-β and HOMA-IR were calculated as follows:
HOMA-β=Fasting insulin×360/[Fasting blood glucose (mg/dL)-63]
HOMA-IR=Fasting blood glucose (mg/dL)×Fasting insulin/405

Statistical analysis

Statistical analysis was performed using SPSS version 18 (SPSS Inc., Chicago, IL, USA). The results represent means±standard deviation (SD). Analysis of variance (ANOVA) was used to evaluate continuous variables, and Pearson's chi-square2 test used to analyze categorical variables. A P<0.05 was considered to indicate statistical significance.

RESULTS

Baseline clinical characteristics

In the CHC patients, we observed a SVR in 49 of 60 patients (81%), which included 36 of 60 patients (60%) with HCV genotype 1. The pre-treatment patient age was significantly higher in the non-SVR group than the SVR group (56.6 vs. 48 years, respectively; P = 0.007). There was no significant difference in pre-treatment body mass index (BMI), alanine aminotransferase (ALT), HCV RNA titer, TC, TG, LDL-C, HDL-C, HOMA-IR or HOMA-β (Table 1).

Changes in treatment response-dependent lipid profile

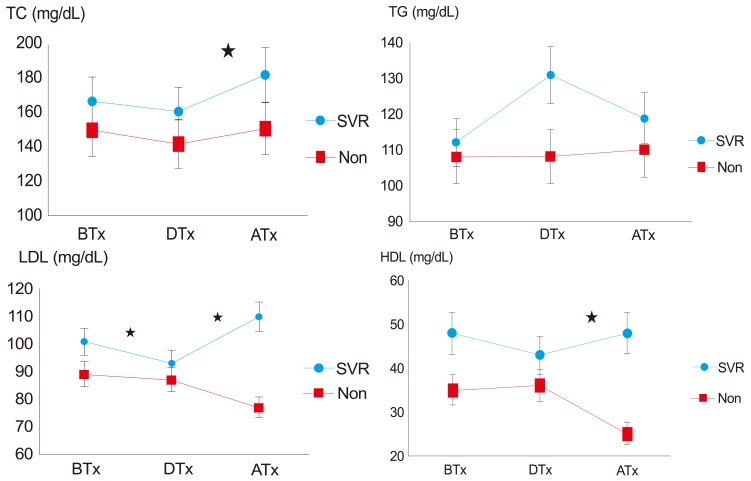
In the CHC patients, TC, LDL-C, HDL-C tended to decrease DTx and increase again ATx in the SVR group. LDL-C significantly changed DTx (BTx, 101.1; DTx, 93.2; P =0.008) and changed ATx in the SVR group (DTx, 93.2; ATx, 110.8; P=0.001; Table 2-1 and Fig. 1). We analyzed the 23 CHB patients using a similar method, and found no significant difference BTx, DTx, and ATx (Table 2-2). However, this data set was limited by the small sample size (SVR=15, non-SVR=8).

Changes in treatment-response-dependent insulin resistance

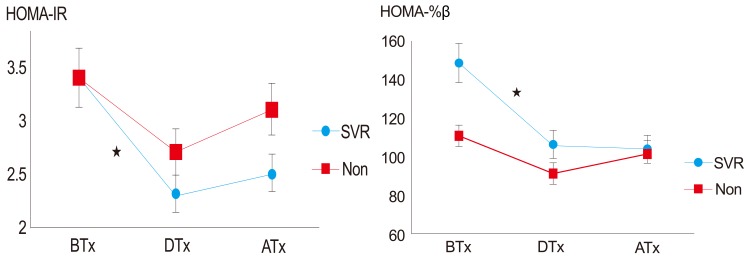
To evaluate the IR from HOMA-β and HOMA-IR values, fasting insulin and blood glucose values were examined with changes in HOMA-β and HOMA-IR. There was a significant change in HOMA-β and HOMA-IR DTx (Table 3 and Fig. 2). Pre-treatment HOMA-IR >2.5 was defined as high IR with a higher SVR rate with low baseline insulin resistance (71.5% in patients in HOMA-IR >2.5 vs. 86.7% in HOMA-IR <2.5 group). In HOMA-IR >2.5 patients, HOMA-IR significantly decreased DTx in the SVR group (BTx, 3.9; DTx, 2.6; P=0.035; Table 4 and Fig. 3).

DISCUSSION

Patients with LC due to HCV have a three- to five fold higher frequency of diabetes compared to patients with hepatitis B.7 With the worldwide spread of CHC, the correlation of metabolic syndrome with IR is a major public health problem gaining importance. It has been reported that HCV infection is itself a risk factor for metabolic syndrome and affects glucose metabolism through various direct or indirect mechanisms to induce IR, which aggravates liver disease and reduces the response to anti-viral treatment.
In a meta-analysis of 34 studies, CHC patients had twice as many risk factors for diabetes and when age and BMI were considered, an 11-fold risk was calculated.8 However, the association between CHC and IR remains unknown. Patients with diabetes have a significantly higher CHC infection rate than non-infected patients, and accordingly, HCV increases the prevalence of diabetes and is more prevalent in diabetic patients.9
Treatment of CHC patients with IFN may influence lipid metabolism by several mechanisms. The first is resolution of hepatic inflammation after successful HCV eradication, which may normalize hepatocellular function and hepatic production of serum lipoproteins.10
The second is that IFN itself may alter lipid metabolism via receptors on hepatocytes, adipocytes and enterocytes, which have several important roles in the regulation of serum lipid concentrations.11 The third is that eradication of HCV from hepatocytes may normalize hepatocyte function if HCV has a direct effect on hepatocyte lipid metabolism.12
Several studies have reported that LDL-C is a useful predictive prognostic factor for treatment with IFN and RBV in CHC. Minuk et al6 speculated that LDL may inhibit HCV binding to receptors on hepatocytes13,14 and SVR was greater in CHC patients with a higher pre-treatment LDL-C concentration, indicating that it could be predictive of treatment success. Even though significant differences were not noted in the current study, the LDL-C level was relatively high in the SVR group at 101 mg/dL compared to the non-SVR group at 89.2 mg/dL. Furthermore, we observed that TC and LDL-C decreased in the SVR group during treatment and returned to baseline levels after the end of treatment. In the non-SVR group, LDL-C decreased consistently, even after the end of treatment, while TC returned baseline in a manner similar to the SVR group after the end of the treatment. This is consistent with the report by Tada et al15 of 185 Japanese patients, in whom TG tended to increase in the SVR group during early treatment and decrease to the baseline level after the end of the treatment.
Cholesterol is associated with HCV since the exterior membrane of HCV has an affinity for lipids. LDL combined with HCV results in the abnormal lipid metabolism associated with the eradication of HCV.16 Since successful treatment of CHC reduces the quantity of lipid combined with HCV, the serum concentration of circulating lipid increases. The serum TG concentration displayed a different course during IFN treatment compared to serum total cholesterol. TG concentration remained significantly higher during IFN treatment and returned to its pretreatment level after the end of treatment. Therefore, this dramatic change in serum TG levels is likely caused by the IFN treatment itself. The activity of hepatic TG lipase, an enzyme that degrades serum TG, is inhibited during IFN administration, and hepatocellular TG synthesis is stimulated by IFN treatment.17,18 Therefore, the elevated TG levels during IFN treatment might be caused by an IFN-induced decrease in TG degradation, as well an IFN-induced increase in hepatic TG synthesis.
IR is associated with genotype and a high viral load predicts anti-viral therapeutic responses in CHC patients.19 IR is defined as a situation in which the normal concentration of insulin cannot induce a normal metabolic process, or a requirement for supraphysiological amounts to induce the normal metabolic process.20 The mechanisms underlying HCV-induced IR in hepatocytes remain unknown but it is thought that progress to LC in existing HCV can be aggravated by induction of liver fibrosis through differential stimulation of phosphatidylinositol-3-kinase and extracellular-regulated kinase photophosphorylation.21 While IR is reported at a frequency of 10-25% in the normal population, it can be as high as 30-70% in CHC patients.22 Obesity is a common cause of IR, but according to Bartenschlager et al,23 there is no specific association between IR and obesity in CHC patients. In this study, there was no significant difference in BMI between the SVR and non-SVR groups.
Several prior studies using surrogate measures of IR, including HOMA-IR, report that IR is a predictor of non-response to anti-HCV therapy.24,25,26,27 In a study of 159 Spanish patients, individuals with SVR had lower baseline HOMA-IR score compared with non-SVR patients (HOMA-IR=2.4 vs. 3.8).28 In addition, after adjusting for genotype and liver fibrosis scores, the odds of non-sustained response to anti-HCV therapy were ~1.8-fold higher with increasing HOMA-IR scores.28
The association between SVR and IR, however, has not been reported consistently. In a recent study of 412 Italian patients, SVR was associated with HCV genotypes 2 and 3 and younger age, but baseline HOMA-IR scores between individuals who did and did not achieve SVR did not reach statistical significance.29 In another study, there were no improvements in SVR despite pharmacologically induced improvement of IR with metformin.30 Some studies have shown a statistically significant decrease in HOMA-IR scores with viral eradication and achievement of SVR.28,31
When using precise measurements, IR did not appear to be substantially associated with achievement of SVR. Moreover, successful viral eradication did not substantially influence IR when compared with HCV therapy that does not result in SVR. However, HCV therapy, regardless of SVR achievement, appeared to improve IR. This suggests that individuals with higher degrees of IR may benefit from receiving HCV therapy in an attempt to decrease their risk of clinical sequelae of IR. Currently, in HOMA-IR and HOMA-β showing IR, glucose intolerance improves when the HOMA-IR level is high and HOMA-β is low, and HOMA-IR reflects IR itself, while HOMA-β reflects the insulin secretion of the pancreas.
A hepatitis C antiviral long-term treatment against cirrhosis (HALT-C) study reported that the decrease of HOMA-IR correlated with the removal of virus at 24 weeks of treatment32 and according to a study on 277 Taiwanese patients by Huang et al2 after IFN treatment, HOMA-β showed a significant decrease; in the group with high pre-treatment HOMA-IR, HOMA-IR and HOMA-β decreased significantly after the treatment regardless of SVR.
In South Korea, there was a report describing HOMA-IR and BMI measurements in CHC 28 patients who received IFN and RBV treatment with 22 patients in the SVR group (78.6%) and HOMA-IR significantly decreased in the SVR group. However, there was no significant change in BMI; 6 of 28 patients were in the non-SVR group, and showed no significant changes in BMI and HOMA-IR level.33
Preceding studies report that IR is an independent predictive factor for SVR in CHC patients. SVR occurs in 32.8% of patients with genotype 1 and HOMA-IR >2, compared to 60.5% of those with HOMA-IR <2. However, other prospective studies report that the lower the pre-treatment HOMA-IR, the higher the SVR with IFN treatment; thus, pre-treatment HOMA-IR will help to predict the results of treatment. In our study, the HOMA-IR and HOMA-β values decreased significantly during treatment, while among the patients with high pre-treatment HOMA-IR, the SVR group showed a significant decrease in HOMA-IR at the end of treatment. However, because a number of factors (such as age, obesity and the degree of hepatocyte damage) was not controlled, there is a limitation in the interpretation of the results. In the pretreatment high-insulin-resistance group (HOMA-IR >2.5), the HOMA-IR was decreased significantly in SVR group during DTx. Therefore, treatment response and insulin resistance changes are likely related, and successful HCV treatment would lead to improvements in IR and insulin hypersecretion.
Only Kim et al33 reported IR and lipid metabolism changes in CHC patients in Korea, which included only 28 patients. Our study did not compare variables that might affect the results (i.e., BMI), as it was of a retrospective design with a limited number of patients compared to other reports. However, the results are significant because they support the eradication of HCV with peg-IFN and RBV that alters lipid metabolism and might be improve IR in Korean patients.

Acknowledgement

This work was supported by the Soonchunhyang University Research Fund.

FOOTNOTES

The authors have no conflicts to disclose.

Abbreviations

ALT
alanine aminotransferase
BMI
body mass index
CHB
chronic hepatitis B
CHC
chronic hepatitis C
CLD
chronic liver disease
HCC
hepatocellular carcinoma
HCV
hepatitis C virus
HDL-C
high-density lipoprotein cholesterol
HOMA
homeostasis model for assessment
IFN
interferon
IR
insulin resistance
LC
liver cirrhosis
LDL-C
low-density lipoprotein cholesterol
RBV
ribavirin
SVR
sustained virologic response
TC
total cholesterol
TG
triglyceride

REFERENCES

1. Jun DW, Tak WY, Bae SH, Lee YJ. Recent trends in the treatment of chronic hepatitis C. Korean J Hepatol 2012;18:22-28. 22511899.
crossref pmid pmc
2. Huang JF, Dai CY, Yu ML, Huang CF, Huang CI, Yeh ML, et al. Pegylated interferon plus ribavirin therapy improves pancreatic beta-cell function in chronic hepatitis C patients. Liver Int 2011;31:1155-1162. 21745292.
crossref pmid
3. Huang JF, Dai CY, Hwang SJ, Ho CK, Hsiao PJ, Hsieh MY, et al. Hepatitis C viremia increases the association with type 2 diabetes mellitus in a hepatitis B and C endemic area: an epidemiological link with virological implication. Am J Gastroenterol 2007;102:1237-1243. 17531012.
crossref pmid
4. Kim YJ, Jang BK, Kim ES, Park KS, Cho KB, Hwang JS, et al. Rapid Normalization of alanine aminotransferase predicts viral response during combined peginterferon and ribavirin treatment in chronic hepatitis C patients. Korean J Hepatol 2012;18:41-47. 22511902.
crossref pmid pmc
5. Gopal K, Johnson TC, Gopal S, Walfish A, Bang CT, Suwandhi P, et al. Correlation between beta-lipoprotein levels and outcome of hepatitis C treatment. Hepatology 2006;44:335-340. 16871569.
crossref pmid
6. Minuk GY, Weinstein S, Kaita KD. Serum cholesterol and low-density lipoprotein cholesterol levels as predictors of response to interferon therapy for chronic hepatitis C. Ann Intern Med 2000;132:761-762. 10787379.
crossref
7. Arao M, Murase K, Kusakabe A, Yoshioka K, Fukuzawa Y, Ishikawa T, et al. Prevalence of diabetes mellitus in Japanese patients infected chronically with hepatitis C virus. J Gastroenterol 2003;38:355-360. 12743775.
crossref pmid
8. White DL, Ratziu V, El-Serag HB. Hepatitis C infection and risk of diabetes: a systematic review and meta-analysis. J Hepatol 2008;49:831-844. 18814931.
crossref pmid pmc
9. Saxena AK, Panhotra BR. The susceptibility of patients with type-2 diabetes to hepatitis C virus infection during long-term haemodialysis. Swiss Med Wkly 2003;133:611-618. 14745667.
pmid
10. Naeem M, Bacon BR, Mistry B, Britton RS, Di Bisceglie AM. Changes in serum lipoprotein profile during interferon therapy in chronic hepatitis C. Am J Gastroenterol 2001;96:2468-2472. 11513192.
crossref pmid
11. Feingold KR, Grunfeld C. Role of cytokines in inducing hyperlipidemia. Diabetes 1992;41(Suppl 2):97-112. 1526345.
crossref pmid
12. Quadri R, Rubbia-Brandt L, Abid K, Negro F. Detection of the negative-strand hepatitis C virus RNA in tissues: implications for pathogenesis. Antiviral Res 2001;52:161-171. 11672826.
crossref pmid
13. Dai CY, Huang JF, Hsieh MY, Hou NJ, Lin ZY, Chen SC, et al. Insulin resistance predicts response to peginterferon-alpha/ribavirin combination therapy in chronic hepatitis C patients. J Hepatol 2009;50:712-718. 19231011.
crossref pmid
14. Bugianesi E, Salamone F, Negro F. The interaction of metabolic factors with HCV infection: does it matter? J Hepatol 2012;56(Suppl 1):S56-S65. 22300466.
crossref pmid
15. Tada S, Saito H, Ebinuma H, Ojiro K, Yamagishi Y, Kumagai N, et al. Treatment of hepatitis C virus with peg-interferon and ribavirin combination therapy significantly affects lipid metabolism. Hepatol Res 2009;39:195-199. 19054155.
crossref pmid
16. Kuo YH, Chuang TW, Hung CH, Chen CH, Wang JH, Hu TH, et al. Reversal of hypolipidemia in chronic hepatitis C patients after successful antiviral therapy. J Formos Med Assoc 2011;110:363-371. 21741004.
crossref pmid
17. Rosenzweig IB, Wiebe DA, Borden EC, Storer B, Shrago ES. Plasma lipoprotein changes in humans induced by beta-interferon. Atherosclerosis 1987;67:261-267. 3079540.
crossref pmid
18. Shinohara E, Yamashita S, Kihara S, Hirano K, Ishigami M, Arai T, et al. Interferon alpha induces disorder of lipid metabolism by lowering postheparin lipases and cholesteryl ester transfer protein activities in patients with chronic hepatitis C. Hepatology 1997;25:1502-1506. 9185775.
crossref pmid
19. Dai CY, Huang JF, Hsieh MY, Hou NJ, Lin ZY, Chen SC, et al. Insulin resistance predicts response to peginterferon-alpha/ribavirin combination therapy in chronic hepatitis C patients. J Hepatol 2009;50:712-718. 19231011.
crossref pmid
20. Bugianesi E, Salamone F, Negro F. The interaction of metabolic factors with HCV infection: does it matter? J Hepatol 2012;56(Suppl 1):S56-S65. 22300466.
crossref pmid
21. Svegliati-Baroni G, Ridolfi F, Di Sario A, Casini A, Marucci L, Gaggiotti G, et al. Insulin and insulin-like growth factor-1 stimulate proliferation and type I collagen accumulation by human hepatic stellate cells: differential effects on signal transduction pathways. Hepatology 1999;29:1743-1751. 10347117.
crossref pmid
22. Romero-Gómez M. Insulin resistance and hepatitis C. World J Gastroenterol 2006;12:7075-7080. 17131467.
crossref pmid pmc
23. Bartenschlager R, Ahlborn-Laake L, Mous J, Jacobsen H. Kinetic and structural analyses of hepatitis C virus polyprotein processing. J Virol 1994;68:5045-5055. 8035505.
crossref pmid pmc
24. Khattab M, Eslam M, Sharwae MA, Shatat M, Ali A, Hamdy L. Insulin resistance predicts rapid virologic response to peginterferon/ribavirin combination therapy in hepatitis C genotype 4 patients. Am J Gastroenterol 2010;105:1970-1977. 20234345.
crossref pmid
25. Grasso A, Malfatti F, De Leo P, Martines H, Fabris P, Toscanini F, et al. Insulin resistance predicts rapid virological response in non-diabetic, non-cirrhotic genotype 1 HCV patients treated with peginterferon alpha-2b plus ribavirin. J Hepatol 2009;51:984-990. 19695729.
crossref pmid
26. Moucari R, Ripault MP, Martinot-Peignoux M, Voitot H, Cardoso AC, Stern C, et al. Insulin resistance and geographical origin: major predictors of liver fibrosis and response to peginterferon and ribavirin in HCV-4. Gut 2009;58:1662-1669. 19671541.
crossref pmid
27. Poustchi H, Negro F, Hui J, Cua IH, Brandt LR, Kench JG, et al. Insulin resistance and response to therapy in patients infected with chronic hepatitis C virus genotypes 2 and 3. J Hepatol 2008;48:28-34. 17977612.
crossref pmid
28. Romero-Gómez M, Del Mar Viloria M, Andrade RJ, Salmerón J, Diago M, Fernández-Rodríguez CM, et al. Insulin resistance impairs sustained response rate to peginterferon plus ribavirin in chronic hepatitis C patients. Gastroenterology 2005;128:636-641. 15765399.
crossref pmid
29. Fattovich G, Covolo L, Pasino M, Perini E, Rossi L, Brocco G, et al. The homeostasis model assessment of the insulin resistance score is not predictive of a sustained virological response in chronic hepatitis C patients. Liver Int 2011;31:66-74. 20840397.
crossref pmid
30. Romero-Gomez M, Diago M, Andrade RJ, Calleja JL, Salmerón J, Fernández-Rodríguez CM, et al. Treatment of insulin resistance with metformin in naive genotype 1 chronic hepatitis C patients receiving peginterferon alfa-2a plus ribavirin. Hepatology 2009;50:1702-1708. 19845037.
crossref pmid
31. Kawaguchi T, Ide T, Taniguchi E, Hirano E, Itou M, Sumie S, et al. Clearance of HCV improves insulin resistance, beta-cell function, and hepatic expression of insulin receptor substrate 1 and 2. Am J Gastroenterol 2007;102:570-576. 17222321.
crossref pmid
32. Delgado-Borrego A, Jordan SH, Negre B, Healey D, Lin W, Kamegaya Y, et al. Reduction of insulin resistance with effective clearance of hepatitis C infection: results from the HALT-C trial. Clin Gastroenterol Hepatol 2010;8:458-462. 20156586.
crossref pmid pmc
33. Kim HJ, Park JH, Park DI, Cho YK, Sohn CI, Jeon WK, et al. Clearance of HCV by Combination Therapy of Pegylated Interferon alpha-2a and Ribavirin Improves Insulin Resistance. Gut Liver 2009;3:108-115. 20431732.
crossref pmid pmc
Figure 1
Changes in total cholesterol (TC), triglyceride (TG), low-density lipoprotein cholesterol (LDL-C), and high-density lipoprotein cholesterol (HDL-C) levels in hepatitis C virus (HCV)-positive patients according treatment efficacy (★statistically significant differences during treatment in the sustained virologic response, SVR, group, P<0.05). LDL-C had significantly changed at DTX and ATx compared to BTx. TC, total cholesterol; TG, triglyceride; LDL-C, low-density lipoprotein cholesterol; HDL-C, high-density lipoprotein cholesterol; SVR, sustained virologic response; BTx, Before treatment; DTx, End of treatment; ATx, After treatment.

cmh-20-38-g001.jpg
Figure 2
Sequential changes in homeostasis model assessment (HOMA) of β cells (HOMA-β) and HOMA of insulin resistance (HOMA-IR) in all patients receiving pegylated interferon plus ribavirin combination therapy, relative to treatment response. HOMA-IR and HOMA-β were significantly changed at DTx in the SVR group. HOMA-β, homeostasis model assessment of β cell; HOMA-IR, homeostasis model assessment of insulin resistance; SVR, sustained virologic response; BTx, Before treatment; DTx, End of treatment; ATx, After treatment.

cmh-20-38-g002.jpg
Figure 3
Sequential changes in HOMA-β and HOMA-IR in patients with a high baseline HOMA-IR receiving pegylated interferon plus ribavirin combination therapy, relative to treatment response (★statistically significant differences during treatment in the SVR group, P<0.05). In high baseline insulin resistance (HOMA-IR>2.5), HOMA-IR was significantly changed at DTx in the SVR group. HOMA-β, homeostasis model assessment of β cell; HOMA-IR, homeostasis model assessment of insulin resistance; SVR, sustained virologic response; BTx, Before treatment; DTx, End of treatment; ATx, After treatment.

cmh-20-38-g003.jpg
Table 1.
Patient characteristics prior to treatment for chronic hepatitis C (CHC)
All (n=60) SVR (n=49) Non-SVR (n=11) P-value
Age (yr) 49.2±11.38 48±11.2 56.6±9.9 0.007
BMI (kg/m2) 24±2.8 23.8±2.5 25.7±4.2 NS
ALT (IU/L) 92±98.2 91.6±85.2 94.4±95 NS
Genotype 1/non 1 36/24 28/21 8/3
HCV RNA (IU/mL, ×106) 1.94±3.25 1.93±3.79 2.0±2.1 NS
HOMA-β 142.5±110.5 149.6±117 111.1±65.6 NS
HOMA-IR 3.4±2.61 3.4±2.69 3.4±2.31 NS
TC (mg/dL) 163.6±32 166.8±34.1 149.4±14.2 NS
TG (mg/dL) 111.9±5.8 112.7±58.6 108.1±34.6 NS
LDL-C (mg/dL) 99.3±30.8 101.1±32.2 89.2±19.4 NS
HDL-C (mg/dL) 46.0±18.2 48.0±18.7 35.0±10.6 NS

All variables are expressed as mean±SD.

BMI, body mass index; ALT, alanine aminotransferase; HOMA-β, homeostasis model assessment of β cell; HOMA-IR, homeostasis model assessment of insulin resistance; TC, total cholesterol; TG, triglyceride; LDL-C, low-density lipoprotein cholesterol; HDL-C, high-density lipoprotein cholesterol; SVR, sustained virologic response; NS, not significant.

Table 2-1.
Differences in posttreatment changes in total cholesterol, triglyceride, low-density lipoprotein cholesterol, and high-density lipoprotein cholesterol according to sustained virologic response (SVR) status in CHC patients (n=41 for SVR, n=19 for non-SVR)
BTx DTx ATx P-value
B-D / D-A / B-A
TC (mg/dL) SVR 166.8 160.3 182.0 NS / 0.001 / 0.002
Non-SVR 149.4 141.8 150.0 NS / NS / NS
TG (mg/dL) SVR 112.7 131.1 119.9 NS / NS / NS
Non-SVR 108.1 108.1 108.6 NS / NS / NS
LDL-C (mg/dL) SVR 101.1 93.2 110.8 0.008 / 0.001 / NS
Non-SVR 89.2 87.1 77.3 NS / NS / NS
HDL-C (mg/dL) SVR 48.0 43.2 48.9 NS / 0.022 / NS
Non-SVR 35.0 36.0 25.7 NS / NS / NS

CHC, chronic hepatitis C; B-D differences between BTx and DTx; D-A, differences between DTx and ATx; B-A, differences between BTx and ATx; BTx, Before treatment; DTx, End of treatment; ATx, After treatment; TC, total cholesterol; TG, triglyceride; LDL-C, low-density lipoprotein cholesterol; HDL-C, high-density lipoprotein cholesterol; SVR, sustained virologic response; NS, not significant.

Table 2-2.
Differences in changes in total cholesterol, triglyceride, low-density lipoprotein cholesterol, and high-density lipoprotein cholesterol according to SVR status in chronic hepatitis B patients (n=15 for SVR, n=8 for non-SVR)
BTx DTx ATx P-value
B-D / D-A / B-A
TG (mg/dL) SVR 71.5 103.5 104.5 NS / NS / NS
Non-SVR 145.0 174.0 162.0 NS / NS / NS
LDL-C (mg/dL) SVR 84.6 89.0 85.3 NS / NS / NS
Non-SVR 83.0 88.0 89.0 NS / NS / NS
HOMA-IR (mg/dL) SVR 2.88 2.56 2.01 NS / NS / NS
Non-SVR 3.16 3.24 3.79 NS / NS / NS
HOMA- β (mg/dL) SVR 107.0 88.6 112.5 NS / NS / NS
Non-SVR 102.4 110.1 116.2 NS / NS / NS

CHB, chronic hepatitis B; B-D, differences between BTx and DTx; D-A, differences between DTx and ATx; B-A, differences between BTx and ATx; BTx, Before treatment; DTx, During treatment; ATx, After treatment; TC, total cholesterol; TG, triglyceride; LDL-C, low-density lipoprotein cholesterol; HDL-C, high-density lipoprotein cholesterol; SVR, sustained virologic response; NS, not significant.

Table 3.
Sequential changes in homeostasis model for assessment (HOMA) of insulin resistance (HOMA-IR) and HOMA of β cells (HOMA-β) relative to treatment response in all patients (n=41 for SVR, n=19 for non-SVR)
BTx DTx ATx P-value
B-D / D-A / B-A
HOMA-β SVR 149.6 106.9 104.3 0.026 / NS / 0.024
Non-SVR 111.1 91.9 102.2 NS / NS / NS
HOMA-IR SVR 3.4 2.3 2.5 0.036 / NS / NS
Non-SVR 3.4 2.7 3.1 NS / NS / NS

B-D, differences between BTx and DTx; D-A, differences between DTx and ATx; B-A, differences between BTx and ATx; BTx, Before treatment; DTx, End of treatment; ATx, After treatment; HOMA-β: homeostasis model assessment of β cell, HOMA-IR; homeostasis model assessment of insulin resistance, SVR; sustained virologic response; NS, not significant.

Table 4.
Sequential changes in HOMA-IR and HOMA-β relative to treatment response in patients with a high baseline HOMA-IR (HOMA-IR >2.5; n=27 for SVR, n=11 for non-SVR)
HOMA-IR>2.5 BTx DTx ATx P-value
B-D / D-A / B-A
HOMA-β SVR 166.1 114.3 108.6 NS / NS / 0.028
Non-SVR 110.1 91.3 96.1 NS / NS / NS
HOMA-IR SVR 3.9 2.6 2.8 0.035 / NS / 0.039
Non-SVR 4.3 3.4 4.0 NS / NS / NS

B-D, differences between BTx and DTx; D-A, differences between DTx and ATx; B-A, differences between BTx and ATx; BTx, Before treatment; DTx, End of treatment; ATx, After treatment; HOMA-β, homeostasis model assessment of β cell; HOMA-IR, homeostasis model assessment of insulin resistance; SVR, sustained virologic response; NS, not significant.


Editorial Office
The Korean Association for the Study of the Liver
Room A1210, 53 Mapo-daero(MapoTrapalace, Dowha-dong), Mapo-gu, Seoul, 04158, Korea
TEL: +82-2-703-0051   FAX: +82-2-703-0071    E-mail: kasl@kams.or.kr
Copyright © The Korean Association for the Study of the Liver.         
COUNTER
TODAY : 1988
TOTAL : 2031720
Close layer