Chemotherapy induced liver abnormalities: an imaging perspective
Article information
Abstract
Treating patients undergoing chemotherapy who display findings of liver toxicity, requires a solid understanding of these medications. It is important for any clinician to have an index of suspicion for liver toxicity and be able to recognize it, even on imaging. Cancer chemotherapy has evolved, and newer medications that target cell biology have a different pattern of liver toxicity and may differ from the more traditional cytotoxic agents. There are several hepatic conditions that can result and keen clinical as well as radiographic recognition are paramount. Conditions such as sinusoidal obstructive syndrome, steatosis, and pseudocirrhosis are more commonly associated with chemotherapy. These conditions can display clinical signs of acute hepatitis, liver cirrhosis, and even liver failure. It is important to anticipate and recognize these adverse reactions and thus appropriate clinical action can be taken. Often times, patients with these liver manifestations can be managed with supportive therapies, and liver toxicity may resolve after discontinuation of chemotherapy.
INTRODUCTION
It is important to recognize and understand the different chemotherapeutic agents and how they affect the various organs. Most chemotherapy drugs cause apoptosis by directly damaging their DNA, but more recently, drugs that inhibit specific pathways in cell growth have been developed.1 Chemotherapy in general has evolved from the use of cytotoxic agents to agents that work by affecting specific molecules responsible for cell growth, nutrient supply, and differentiation.
As clinicians, we need to be aware of the radiologic manifestations of chemotherapy on the liver, since this is a major organ responsible for drug clearance and synthetic function of many biochemical pathways. Many chemotherapeutic drugs require adequate liver function to be metabolized, and some drugs can induce significant liver injury.
This article will focus primarily on different chemotherapeutic agents and how different subclasses can affect the liver, and then also focus on the more common imaging findings of the liver in patients undergoing treatment with chemotherapy.
Classes of chemotherapeutic agents
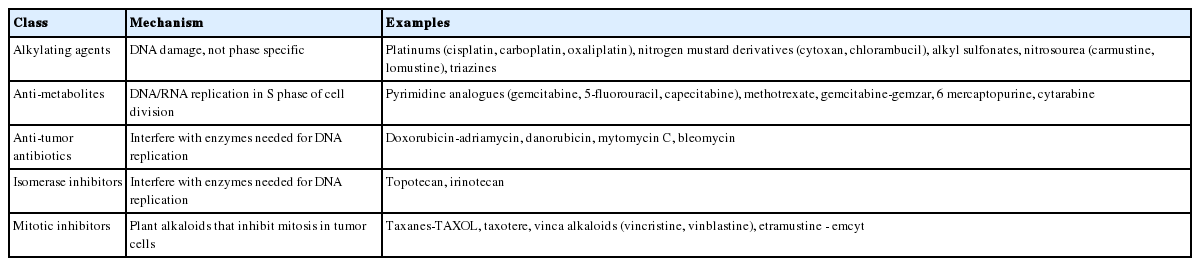
Cytotoxic chemotherapy agents exhibit their affects by interfering with DNA and RNA synthesis as well as cell division.2 These include alkylating agents, anti-metabolites, anti-tumor antibiotics, isomerase inhibitors, mitotic inhibitors. Also, advances in understanding cancer cell biology have led to the development of molecular therapies, which target specific signaling pathways. Many of these agents affect multiple targets, and therefore have the potential to inhibit molecules that are critical to unsuspected pathways, causing toxicity that can sometimes be unpredictable.3
Major classes of chemotherapeutic agents
Alkylating agents
As a class these cytotoxic agents exert their effect by inhibiting DNA replication, leading to apoptosis. Subclasses include platinums, nitrogen mustards, nitrosourea, alkyl sulfonates, and triazines. More common agents in each subclass include cytoxan, cyclophosphamide, carmustine (BCNU), lomustine (CCNU), busulfan, temodar, cisplatin, and oxaliplatin.
Although alkylating agents as a group are seldom implicated as hepatotoxins, and can be given despite some degree of liver injury with safety, there are certain exceptions.4 Cyclophosphamide and chlorambucil, agents that can be given orally, have been implicated in rare cases of acute liver injury. In patients undergoing treatment for vasculitis, cyclophosphamide has been associated with liver necrosis when its administration is preceded by azathioprine.5 Importantly, alkylating agents such as oxaliplatin, cyclophosphamide, and chlorambucil to name a few can cause a condition known as sinusoidal obstructive syndrome (SOS) or veno-occlusive disease.6
Anti-metabolites
Anti-metabolites are cell-cycle-specific agents that interfere with S-phase of the cell cycle by substituting structural analogues of purines and pyrimidines in place of naturally occurring bases. Common anti-metabolites include 5-flourouracil (5-FU), gemcitabine (gemzar), methotrexate, 6-mercaptopurine (6-MP), cytarabine.
Although the liver plays a key role in its catabolism, 5-FU has not been reported to cause liver damage when given orally. Cytarabine (Ara-C) used in leukemic patients did suggest liver toxicity, however no definite evidence could be established since these patients had multiple confounding factors such as drug transfusions, concurrent infections, medications, and rarely received liver biopsies due to thrombocytopenia.4 Establishing this drug as a hepatotoxin has thus been difficult, however 6-MP given at high doses may produce a hepatocellular injury or cholestatic liver disease. In cases where the 5-FU metabolite, floxuridine is given intravascularly for patients with isolated liver metastasis, hepatotoxicity can occur as a function of time and dose.7
Methotrexate induced hepatotoxicity usually involves a sudden transient transaminitis when the drug is used as a component for cancer therapy. In patients undergoing treatment for chronic rheumatoid arthritis, or other rheumatologic disease, however these patients are at increased risk for fibrosis and cirrhosis.8
Anti-tumor antibiotics
Similar to the alkylating agents, they are cell-cycle nonspecific to the cell cycle and injure the cell by interfering with DNA or RNA synthesis. Examples of common anti-tumor antibiotics are doxorubicin-adriamycin, danorubicin, mitomycin C, and bleomycin.
While direct hepatotoxicity is rare, these chemotherapy drugs are extensively metabolized in the liver, and liver antioxidant capacity is dependent on glutathione production to prevent free radical formation. Thus, dose reduction is advised in patients with impaired liver function.4
Isomerase Inhibitors and mitotic inhibitors
Isomerase inhibitors interfere with the topoisomerase enzymes, which are responsible for winding and unwinding DNA in order to prepare it for replication. These inhibitors thus lead to DNA damage, ultimately leading to apoptosis. Mitotic inhibitors disrupt microtubule formation during cell division. Cells affected by this class of drugs are not able to undergo complete cell division and thus are not able to proliferate.
Other classes of chemotherapy agents
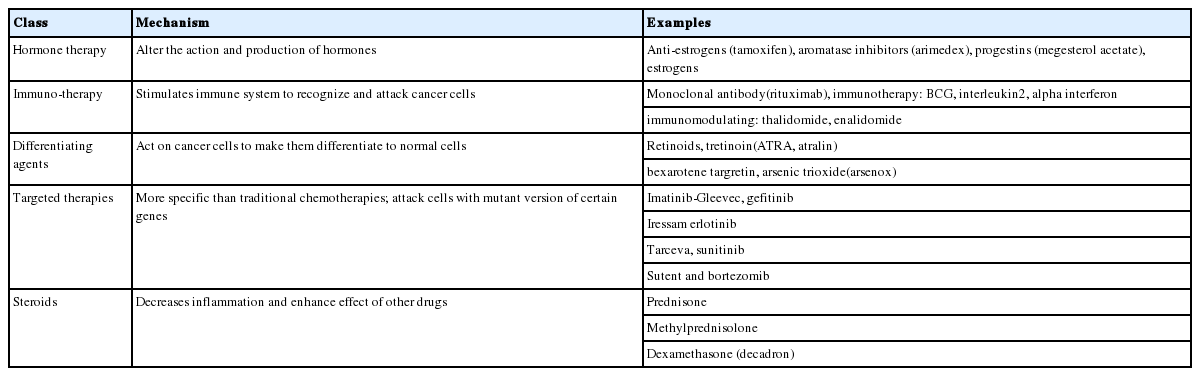
Hormone therapy, immunotherapy, differentiating agents, targeted therapies, and steroids are additional classes of chemotherapy agents (Table 2). Due to advancements in understanding cell biology and how to more specifically attack cancer cells, these drugs were created.
Other cancer therapies
Hormone therapy
Hormone therapy works by altering the action or production of specific hormones. Examples of these agents include tamoxifen, arimedex, progestin, and estrogens. Tamoxifen and anastrozole are widely used as adjunctive treatment for breast cancer, and both have been shown to cause fatty liver disease. When compared head to head, however postmenopausal women with hormone receptor positive breast cancer receiving anastrozole displayed significantly fewer incidence of steatosis compared to the tamoxifen arm 14.6% vs 41% at 3 year follow-up P<0.001.9
Immunotherapy
Immunotherapy is treatment that uses one's own immune system to fight off the cancer. One example of this subgroup is administering monoclonal antibodies that are designed to bind to antigenic determinants expressed or up-regulated in malignancies. Once they bind, they initiate a cascade of events that lead to cell death.
Rituximab is one example, used to treat B cell non-Hodgkin lymphoma. The monoclonal antibody binds to the CD20 protein on the surface of both normal and malignant B cells, initiating apoptosis.10 Hepatotoxicity in these patients receiving rituximab specifically has been reported, although majority of the data on these patients studied seem to have a chronic condition predisposing them to liver disease such as hepatitis C.11
Interleukin2 is used in melanoma as well as renal cell cancer, and many patients who receive this treatment will experience a cholestatic pattern that can elevate the AST, ALT, alkaline phosphatase, and bilirubin 3 or 4 times the upper limit of normal.4 Treatment with Il-2 causes activation of Kupffer cells, causing increased leukocyte-endothelial adhesion and decreased hepatic sinusoidal blood flow.12
Differentiating agents
Differentiating agents act directly on cancer cells to convert them into normal cells. Examples are retinoids, tretinoin (ATRA or Atralin), bexarotene targretin, and arsenic trioxide (Arsenox).
Targeted therapies
Targeted therapy works by attacking cells with mutant genes. Examples of these are imatinib-Gleevec, gefitinib, iressa, erlotinib, tarceva, sunitinib, sutent, and bortezomib.
Hepatotoxicity of chemotherapeutic agents and imaging findings
Chemotherapy induced liver toxicity can present in in a multitude of forms. Free radicals that result from hepatocellular transformation of chemotherapy may impair cell function. Liver injury during chemotherapy can be a direct result of the chemotherapy drug itself, or a compounded reaction to analgesics, antibiotics, anti-emetics, or other medications. While the reaction to many chemotherapy drugs is acute hepatocellular injury or even cholestasis, others can cause sinusoid and endothelial damage and thrombosis, such as in hepatic SOS. The clinical presentation of chemotherapy-induced liver toxicity can range from an asymptomatic patient with mild transaminases on blood work to an ill appearing patient that mimics an acute viral hepatitis.12
When systemic doses of otherwise nonhepatotoxic chemotherapeutic agents are combined with low dose tolerable radiation therapy, acute hepatic injury can result. Preexisting liver disease can certainly be made worse with chemotherapy and patients should be worked up for underlying viral or autoimmune hepatitis, hepato-biliary obstruction, or presence of metastasis.
Sinusoidal obstructive syndrome
Hepatic SOS, previously called veno-occlusive disease is a pattern of vascular liver injury caused by microvascular deposition of fibrous material impairing the normal flow of small intrahepatic veins. SOS is characterized by the histological findings of sinusoid dilation and congestion, perisinusoid fibrosis, and hepatocyte disruption. SOS severity can correlate with abnormal spleen size, as this condition is associated with portal hypertension, splenomegaly, and resulting thrombocytopenia.13
Numerous antineoplastic drugs can cause blockage of the central and sublobular veins of the liver resulting in SOS. Common symptoms include jaundice, hepatomegaly, abdominal pain, ascites, and encephalopathy.14,15 SOS can result from high-dose chemotherapy given prior to bone marrow transplant and is marked by weight gain, increase liver size, and raised levels of bilirubin in the blood.16 Intensive chemotherapy, usually with cyclophosphamide, is most closely associated with the development of a rapidly progressive, occlusive disease of small hepatic venules due to endothelial-cell injury.17 SOS has been reported with notable chemotherapy agents such as oxaliplatin, 6-MP, dacarbazine, cyclophosphamide, and vincristine.18,19,20 An uncommon cause of SOS is long-term immunosuppression with azathioprine in renal and liver transplant patients.
Computed tomography (CT) and ultrasonographic findings of hepatic SOS includes hepatosplenomegaly, ascites, gallbladder wall thickening, periesophageal varices and recanalization of umbilical veins (Fig. 1). On Doppler ultrasound, decreased flow in the portal vein can be noted.21,22 On postcontrast CT and MRI, patchy liver enhancement and narrowing of main hepatic veins were reported as frequent findings (Fig. 2).23 On gadoxetic acid enhanced MRI, reticular pattern is noted on hepatobiliary phase images in patients with hepatic SOS after chemotherapy and this finding is highly specific for correct diagnosis of hepatic SOS.24
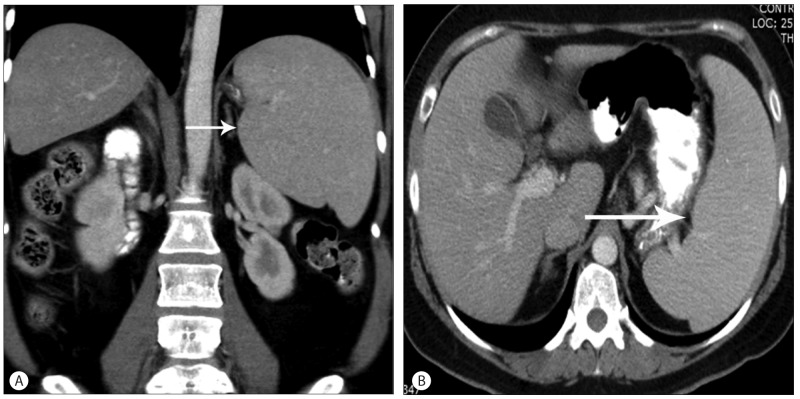
Hepatic sinusoidal obstructive syndrome. Fifty six-year-old female with metastatic colon cancer. Chemotherapy with FOLFOX (Folinic Acid, 5 Flurouracil & Oxaliplatin) regimen was performed. This may lead to sinusoidal congestion, damage to the hepatic sinusoids with features of portal hypertension, splenomegaly and resultant thrombocytopenia. Coronal contrast enhanced CT (A) and axial contrast enhanced CT (B) demonstrate an enlarged spleen (arrow).

Hepatic sinusoidal obstructive syndrome. Fifty six-year-old male patient with acute myeloid leukemia on high dose chemotherapy after bone marrow transplantation. (A) Axial contrast enhanced CT images show mottled enhancement of the liver representing congestion due to veno-occlusive disease and hepatic vein thrombus (arrow). (B) There is a multilevel thrombus in IVC (arrow).
Pseudocirrhosis
"Pseudocirrhosis" is a radiologic term used to describe the serial development of diffuse hepatic nodularity caused by chemotherapy for metastatic disease of the liver.25 This can especially be seen in both metastatic breast and colon cancer, but it has also been reported in metastatic pancreatic cancer after gemcitabine and oxaliplatin therapy.26
Pseudocirrhosis is defined by morphology changes in the liver parenchyma that mimics liver cirrhosis, and can cause retracted tumor tissue and scarring (Fig. 3, 4). In between the areas of scarring, the liver parenchyma can regenerate and this accounts for its appearance. Pseudocirrhosis, while a potential cause of portal hypertension and liver failure, does not show the true clinical features of cirrhosis and loss of synthetic function.27 Pseudocirrhosis can also occur secondary to the hepatotoxic effects of chemotherapy without concurrent liver disease. Retraction is caused by nodular regenerative hyperplasia, and in most cases, it occurs subadjacent to the metastatic lesion after chemotherapy.28
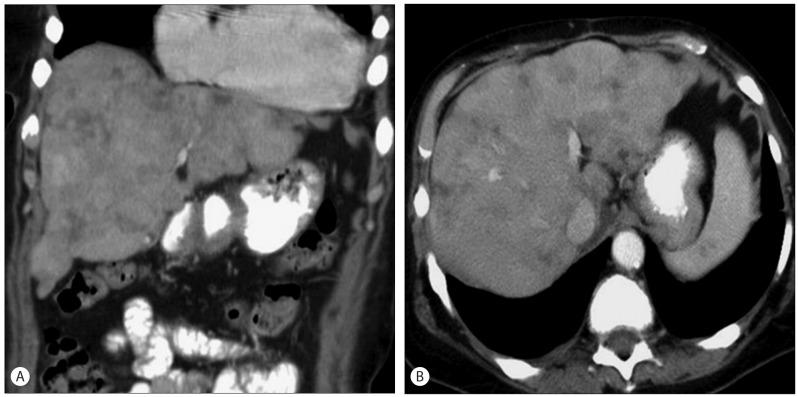
Pseudocirrhosis. Fifty six-year-old female underwent multiple cycles of chemotherapy for metastatic liver disease from breast cancer. Coronal (A) and axial (B) contrast enhanced CT images of the abdomen show a macronodular liver with fibrosis following completion of therapy. Patient had features of early hepatic decompensation.
Pseudocirrhosis. Forty seven-year-old female patient with previous history of chemotherapy for metastatic breast cancer. Axial (A) and sequential coronal (B and C) contrast enhanced CT images of the abdomen show a worsening of macronodular liver contour with enlarged spleen, consistent with pseudocirrhosis and signs of liver failure.
In cases of extensive metastatic disease, the liver appears to mimic cirrhosis. Of importance, these changes should not be mistaken for the development or progression of liver metastases. Physicians should be aware that hepatic capsular retraction is common in patients with hepatic metastases from breast cancer cases have been reported with extreme capsular retraction.29
Fatty liver
Chemotherapy (eg 5-FU, platinum derivatives & taxanes) causes oxidative stress in cancer cells and normal cells leading to hepatic steatosis. Steatosis is defined as an accumulation of fat globules in the hepatocytes while steatohepatitis is a more serious histologic sequelae manifested with hepatocyte degeneration.5
Distribution of fatty liver disease can vary from diffuse infiltration to focal steatosis. Also, focal fat sparing can be noted in S4 or around gallbladder (Fig. 5). Development of fatty liver is important to see on CT as this may alter hepatic function and future plans for surgical resection, especially patients who receive neoadjuvant therapy for metastatic liver disease.30 For example, patients undergoing neoadjuvant treatment with irinotecan, oxaliplatin, or cetuximab are susceptible to sequelae of fatty liver disease.31 Fatty liver has also been linked with the following chemotherapeutic agents: L-asparaginase, dactinomycin, mitomycin C, bleomycin sulfate, and methotrexate.15
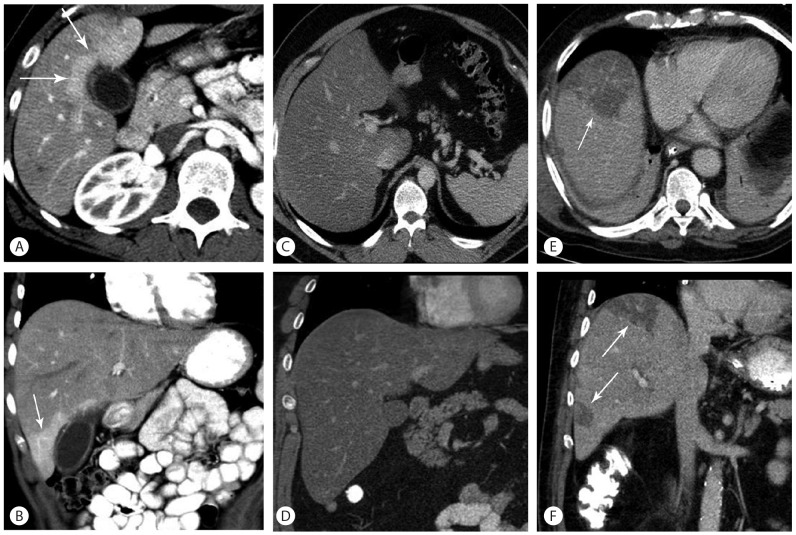
Steatosis patterns. All images are axial and coronal contrast enhanced CT. A and B demonstrate diffuse hepatic steatosis with focal sparing (white arrows), common pattern. C and D demonstrate diffuse steatosis without focal sparing, common pattern. E and F demonstrate geographic fatty change (white arrows), less common pattern.
Acute hepatitis
Acute hepatitis can range from an asymptomatic patient to one that is ill-appearing patient with marked elevation in their liver enzymes, notably AST and ALT. There are several reports of reactivation of both hepatitis B and hepatitis C in those patients with these underlying conditions when treated with agents such as rituximab, cyclophosphamide, doxorubicin, vincristine, and prednisolone (R-CHOP) for lymphoma.32 Imaging findings of acute hepatitis are nonspecific; hepatosplenomegaly, collapsed gallbladder with wall thickening, decreased liver enhancement, ascites and widening of periportal space due to edema (Fig. 6).
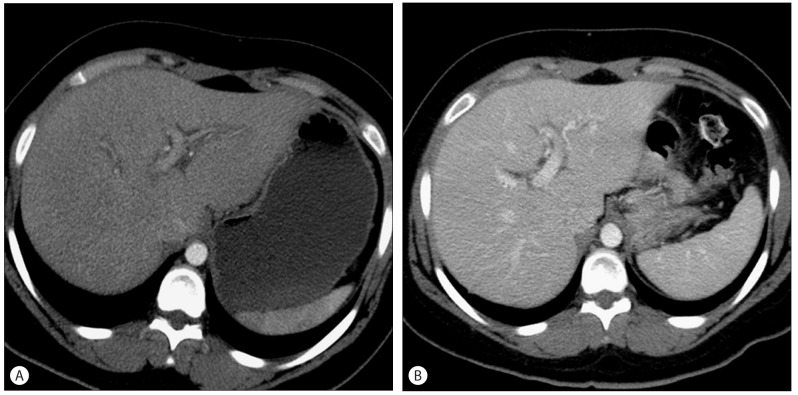
Acute Hepatitis. Twenty nine-year-old female with lymphoma on cyclophosphamide and doxorubicin chemotherapy among other agents. Post treatment course was complicated by increase in liver enzymes. (A) Axial contrast enhanced CT images shows decreased hepatic attenuation with mild peri-portal edema consistent with acute hepatitis. (B) After three months, findings of hepatitis were resolved.
Hepatic necrosis
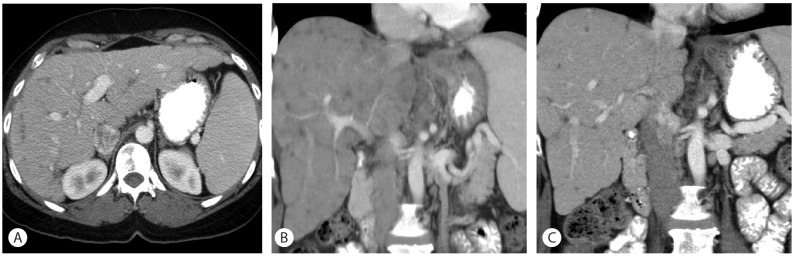
A more severe and dreaded consequence of liver injury from chemotherapy is the development of acute liver failure from hepatic necrosis. Hepatic necrosis should be identified by imaging to give perspective on a patient's clinical presentation. Patients present clinically with acute encephalopathy and loss of synthetic function of the liver. Essentially, chemotherapy drugs that can induce an acute hepatitis can likely cause hepatic necrosis. Mithramycin, an antitumor antibiotic, has been identified to be the most hepatotoxic to induce liver necrosis.33 CT findings of hepatic necrosis include marked decrease of the enhancement of hepatic parenchyma and cystic change when severe necrosis occurs (Fig. 7).
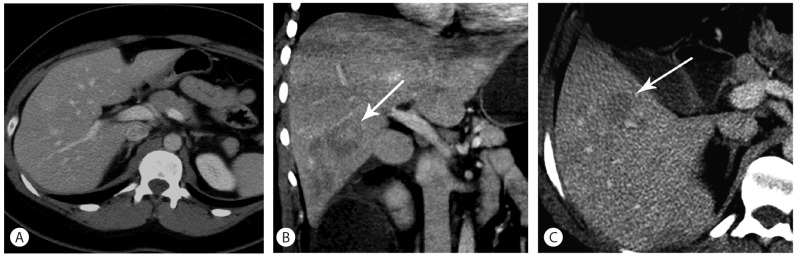
Hepatic Necrosis. Twenty-year-old female with acute myeloid leukemia, on COAP regimen (cyclophosphamide, oncovin, arabinosyl cytosine and prednisone). Post treatment course was complicated by increase in liver enzymes. (A) The pretreatment image shows no abnormality in liver (B) (C) After chemotherapy, coronal (B) and axial (C) contrast enhanced CT images demonstrate focal liver necrosis vs peliosis-centrilobular hemorrhagic necrosis of the liver (arrows).
Portal vein thrombosis
Portal vein thrombosis (PVT) has rarely been described during antineoplastic chemotherapy. However, in adults, a few cases have been reported following chemotherapy treatment of L-asparaginase, Autologous stem cell transplantation, and after haematopoetic cell transplantation (Fig. 8).34,35,36 In children, few cases of PVT have been reported and thus a definite correlation between treatment and prevalence of PVT has not been established. The mere fact that the patient has cancer and increased secretion of tissue factor 7 predisposes them towards thrombosis and may be a confounding factor, rather than the chemotherapy itself Table 1, 3.
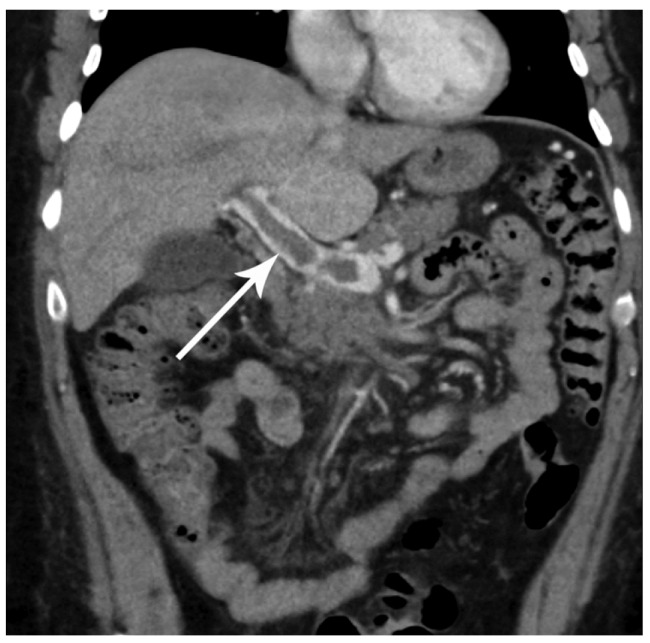
Sixty two-year-old female after bone marrow transplantation. Coronal contrast enhanced CT demonstrates a filling defect in the portal vein (white arrow) compatible with portal vein thrombosis.
Major classes of chemotherapeutic agents

Patterns of hepatotoxicity with chemotherapy
CONCLUSION
Cancer chemotherapy may be toxic to the liver, and recognition of patterns of liver injury is crucial to the clinician and radiologist. Conditions such as SOS, steatosis, pseudocirrhosis, and even hepatic necrosis can occur as a direct result of chemotherapy, which may simulate a clinical presentation of long term hepatic damage and cirrhosis. Imaging recognition of these conditions can allow the radiologists and clinicians to effect the appropriate management to reduce morbidity and mortality.
Notes
The authors have no conflicts to disclose.
Abbreviations
AST
aspartate Aminotransferase
ALT
alanine aminotransferase
SOS
sinusoidal obstruction syndrome