

INTRODUCTION
Hepatocellular carcinoma (HCC) is one of the leading causes of malignant cancer death and has an increasing incidence in worldwide.1 The prognosis of HCC is generally poor due to lack of promising molecular therapeutic targets. Recent positive randomized controlled trial of the multi-kinase inhibitor sorafenib proved beneficial therapeutic effect of molecular therapy in patients with advanced hepatocellular carcinoma2 and this result proposes necessity of studies in other molecular pathway of HCC development.
HCC is usually developed in the presence of continuous inflammation and hepatocyte regeneration during chronic hepatitis and cirrhosis. Prostaglandins, most notably prostaglandin E2 (PGE2) are products of the arachidonic acid pathway and key mediators of inflammation. Cyclooxygenase-2 (COX-2), a rate limiting enzyme in the pathway of PG synthesis has been suggested to be associated with carcinogenesis especially in colorectal cancer.3 Different authors have been reported that the increased PG production would contribute to carcinogenesis in many other cancers, including HCC.4 The expression pattern of COX-2 protein in HCC was found to be correlated with the differentiation grade which implies an important role of abnormal COX-2 expression in carcinogenesis of HCC.5 Furthermore, the COX-2 expression in well-differentiated HCC is significantly higher than that in liver cirrhosis, chronic viral hepatits and normal liver tissue.6
COX-2 is induced by a variety of stimuli such as growth factors, proinflmmatory stimuli, hormones and other cellular stresses7 and is involved in the regulation of cell growth,8 angiogenesis,9 and blastocyst implantation.10 Nonsteroidal anti-inflammatory drugs (NSAIDs) targets COX-2 which is the key step of conversion of arachidonic acid to prostaglandin then inhibits the growth of cell lines through preventing cell proliferation and potentiating apoptosis.11,12
PGE2 synthase (PGES) is the second key enzyme of synthesis of PGE2 interacting with COX-2. Three types of PGES are found: one cytosolic (cPGES) and two membrane-associated PGES, mPGES (micorosomal PGES)-1 and -2. Of three types of PGES, mPGES-1 is often found in the epithelial cells and catalyzes the synthesis of PGE2 upregulated during inflammatory condition.13 To maintain steady-state level of PGE2, synthetic pathway involving PGES and catabolic pathway including 15-hydroxyprostaglandin dehydrogenase (PGDH) needs to be balanced. PGE2 is responsible for cell proliferation, migration, angiogenesis and tumor metastasis and 15-PGDH reduces these functions as metabolizing PGE2 by oxidizing the 15(S)-hydroxyl group into a keto group producing 15-keto PGE2.14,15 With this role of 15-PGDH, many researchers reported that downregulation of 15-PGDH is related to carcinogenesis of various cancers.16,17,18,19 In recent study with human hepatoma cells, 15-PGDH is shown to be downregulated with a high COX-2 and mPGES-1 expression and suggested a relevant tumor suppressing role in HCC of 15-PGDH.20
Thus, the aim of this study was to evaluate the potential role of 15-PGDH in growth of hepatoma cell lines which expressed 15-PGDH initially or transfected with 15-PGDH vector. We compared the growth rate with naïve cells for estimating the anti-cancer effect of 15-PGDH. Furthermore we identified the level of 15-PGDH expression in human HCC tissue along with nontumor tissue and evaluated the role of 15-PGDH as a predictive factor for prognosis of HCC patients.
MATERIALS AND METHODS
HCC cell lines and immunoblotting
Three human HCC cell lines (PLC, HepG2, Huh-7) were purchased from the Korean Cell Line Bank (Seoul, Korea) and they were cultured in 90% Dulbecco's Modified Eagle's Medium (DMEM) supplemented with 10% fetal bovine serum, 100 units/mL penicillin and 100 mg/L streptomycin (GIBCO) in a humidified atmosphere containing 5% CO2 at 37Ōäā.
For immunoblotting, cells were lysed in radioimmune precipitation (RIPA) buffer (Upstate, NY, USA) supplemented with protease inhibitor. The cell lysates were electrophoresed on 10% polyacrylamide gel, transferred onto polyvinylidene difluoride membrane (Bio-Rad Laboratories, CA, USA) and blotted with appropriate primary and secondary antibodies. The signal was detected using ECL reagent kit (Biosciences, Buckinghamshire, UK) and exposed to an X-ray film. The primary antibodies used were rabbit anti-PGDH (1:5,000 dilution; Novus Biologicals, CO, USA), goat anti-COX-2 (1:500 dilution; Santa Cruz, CA, USA), and mouse anti-╬▓-actin (1:10,000 dilution; Sigma, St. Louis, MO, USA). Goat anti-rabbit IgG antibody conjugated with horseradish peroxidase was used as the secondary antibody (Santa Cruz, CA, USA).
15-PGDH transfection
15-PGDH expression vectors were the kind gift of Prof. Seung-Jae Myung. Wild-type (WT) 15-PGDH cDNA was amplified from normal colon cDNA using the PCR primers 5'-CAGCAGTGGCTGCACCATG-3' and 5'-ATTTGTGCTTATTTTCAGCTATGGC-3', and cloned into a pcDNA3.1 expression vector (Invitrogen, Carlsbad, CA, USA) to yield pcDNA3.1-WT-15-PGDH.
HepG2 cells were transfected with pcDNA3.1-empty vector (control), or an expression vector encoding WT 15-PGDH (pcDNA3.1-WT-PGDH), for 24 hr, using Lipofectamine 2,000 (Invitrogen) according to the manufacturer's protocol. The medium was next changed to medium without fetal bovine serum, and growth continued for 12 hr. The cells were next collected for cell proliferation assay and immunoblotting for 15-PGDH in subsequent days.
Cell proliferation assay
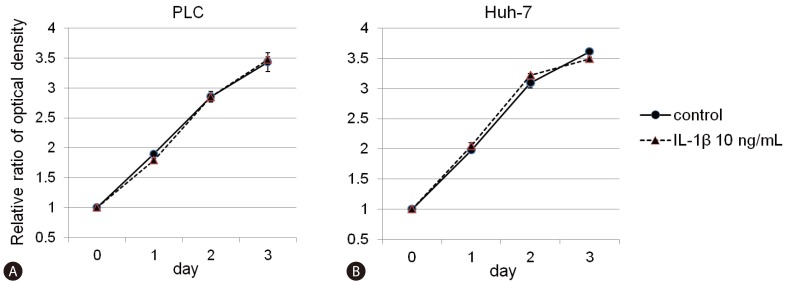
To explore the influence of 15-PGDH on cell proliferation, proliferation assay was performed in PLC and Huh-7 cells with/without interleukin-1 beta (IL-1╬▓) treatment and in HepG2 cells with 15-PGDH transfection. Cell proliferation was measured using the CellTiter 96 Aqueous One Solution cell proliferation assay (Promega, Madison, WI), on the basis of the cellular conversion of the colorimetric reagent MTS [3,4-(5-dimethylthiazol-2-yl)-5-(3-carboxymethoxyphenyl)-2-(4-sulfophenyl)-2H-tetrazolium salt] into soluble formazan by dehydrogenase enzymes found only in metabolically active, proliferating cells. Following each treatment, 20 ┬ĄL of dye solution was added into each well in 96-well plate and incubated for 3 hours. Subsequently, absorbance at 490 nm was measured with an ELISA reader (Magellan, TECAN, Austria).
Tissue microarray (TMA) construction of human HCC tissues
From January 2003 to December 2004, a total of 267 patients underwent curative hepatic resection because of HCC at Asan Medical Center (Seoul, Korea) and we established tissue microarray (TMA) slides using formalin-fixed paraffin-embedded tissues from these 267 surgically resected HCC and neighboring non-neoplastic liver tissue samples. Duplicates of two cores from the tumor tissue and one core from the non-neoplastic liver tissue, measuring 1.5 mm in diameter, were arrayed from the corresponding paraffin blocks into a recipient block using an arraying machine (TMArrayer; Pathology Devices, Westminster, MD, USA). Among these patients, we excluded 99 patients who underwent other treatment for HCC before hepatic resection, 12 who were diagnosed with double primary cancer and 3 with incomplete data, leaving 153 patients in the final clinical correlation analysis. We reviewed the clinical data for the remaining 153 patients, and analyzed the association between clinical parameters and 15-PGDH expressions. The study protocol (protocol #: 2011-0387) was reviewed and approved by the institutional review board of Asan Medical Center and the need for informed consent from the patients was waived by the institutional review board.
Immunohistochemistry in TMA of human tissues
Immunohistochemistry (IHC) to detect 15-PGDH expression in HCC and neighboring nontumor tissues was performed in TMA using a monoclonal anti-PGDH antibody. IHC results were evaluated by a single pathologist (Dr. Hyo Jeong Kang). We graded expression score from 0 to 3 points for 15-PGDH expression in HCC and neighboring nontumor tissues according to the distribution range (grade 0: negative, 1: <33%, 2: 34-66%, 3: >66%).
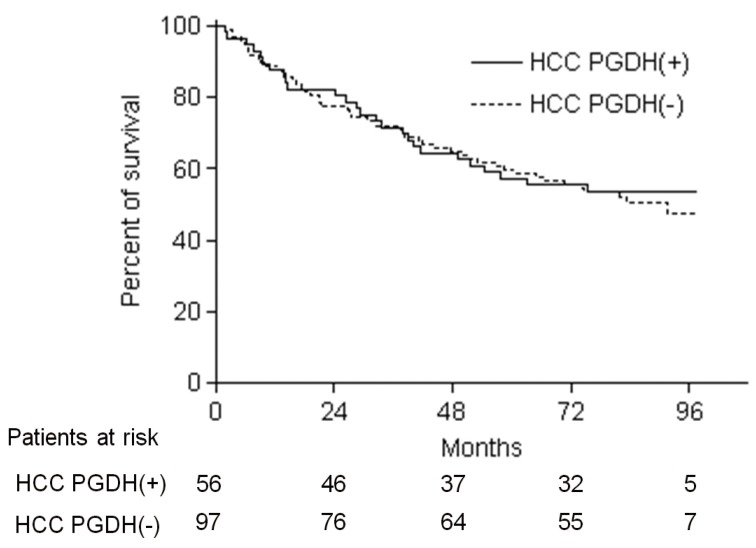
We classified all the 153 HCC patients into 2 groups according to 15-PGDH expression in HCC tissues. HCC PGDH (-) group includes patients without any 15-PGDH expression of HCC and HCC PGDH (+) group includes patients with grade 1-3 expression. In addition, especially in patients who showed 15-PGDH expression grade 1-3 in nontumorous tissues, we also sub-grouped the patients according to the suppression of PGDH in HCC tissues or not. We compared clinical parameters and overall survivals of patients according to the 15-PGDH expression in HCC tissues to elucidate the prognostic significance of 15-PGDH expression in HCC.
Statistical analysis
Descriptive statistics were expressed as median (range) or number (%). Continuous variables were compared using Student's t test and categorical variables using chi-square or Fisher's exact test. Survival curves were estimated according to the Kaplan-Meier method and statistically compared with the log-rank test. Patients lost to follow-up were censored at the date of the last observation. To establish the factors affecting patient survival, uni and multivariate analysis was performed using the Cox regression model. P values <0.05 were taken to indicate statistically significant differences. Statistical analysis was performed using SAS version 9.1 (SAS Institute, Cary, NC, USA).
RESULTS
15-PGDH expression and its association with proliferation of HCC cell lines
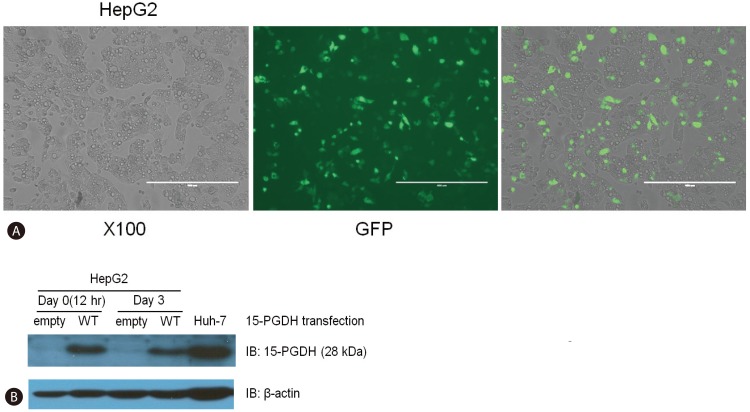
To investigate whether 15-PGDH was expressed in HCC cell lines, we performed immunoblotting of 15-PGDH in the cell lysates of PLC, HepG2 and Huh-7 cells. Both PLC and Huh-7 cells showed 15-PGDH expression, but HepG2 did not (Fig. 1A).
In both PLC and Huh-7 cells, we performed proliferation assay with or without suppression of 15-PGDH by IL-1╬▓ treatment. We confirmed treatment of IL-1╬▓ 10 ng/mL 24 hours suppressed 15-PGDH expression in Huh-7 cells, but this suppression was not observed in PLC cells (Fig. 1B). In MTS assay, addition of IL-1╬▓ 10 ng/mL in culture media did not change proliferation rate of Huh-7 cells compared with control media (Fig. 2B).
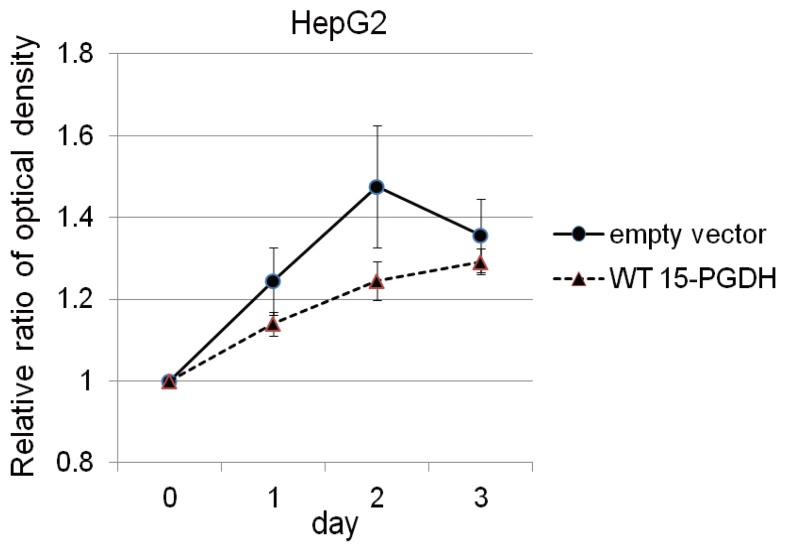
In HepG2 cells, which did not show baseline expression of 15-PGDH, we induced 15-PGDH expression by transfection with vector encoding WT 15-PGDH. Transfection was confirmed by GFP staining (Fig. 3A) and immunoblotting for 15-PGDH (Fig. 3B). 15-PGDH expression was strongest at day 0 of transfection and then diminished slowly as time goes by (Fig. 3B). Proliferation assay showed 15-PGDH expression induction in HepG2 cells suppressed cell growth at day 2, but this growth difference disappeared at day 3 of MTS assay (Fig. 4).
15-PGDH expression in HCC and neighboring nontumor tissues in patients who underwent curative resection
IHC for 15-PGDH was performed in TMA of 153 HCC patients who received curative resection in the period of 2003 to 2004 in our institution. Among total of 153 patients, Table 1 shows frequency of 15-PGDH expression score 0-3 in HCC and neighboring nontumor tissues respectively. According to 15-PGDH expression in HCC tissues, 56 (36.6%) patient showed 15-PGDH expression and was classified as HCC PGDH (+) group, and remaining 97 (63.4%) was HCC PGDH (-) group (Table 1). In neighboring nontumor tissues, 50 (32.7%) patient showed 15-PGDH expression and 96 (62.7%) did not show baseline 15-PGDH expression. Among 50 patients who showed baseline 15-PGDH expression in nontumor adjacent liver tissues, 28 (56%) showed decrease of 15-PGDH expression score in HCC tissues (NT (+) HCC (-) group) and the remaining 22 (44%) showed 15-PGDH expression score in HCC tissues not less than nontumor tissues (NT (+)HCC (+) group) (Table 2).
Clinical parameters and overall survivals of patients who was classified according to the 15-PGDH expression in HCC tissues
We reviewed the clinical data for the patients, and analyzed the association of clinical parameters and overall survival with 15-PGDH expression in HCC tissues. According to 15-PGDH expression in HCC tissues, 56 (36.6%) patient were classified as HCC PGDH (+) group, and remaining 97 (63.4%) as HCC PGDH (-) group. Baseline characteristics such as age, sex, liver disease etiology, Child-Pugh class and HCC stage and morphology were not different between HCC PGDH (+) and HCC PGDH (-) group. Number of the patients with serum alpha-fetoprotein (AFP) >400 ng/mL was significantly more in HCC PGDH (+) group than HCC PGDH (-) group (Table 3). The overall survival of 153 patients was not different according to the 15-PGDH expression in HCC tissues and 5-year survival rate (5-YSR) was 57.1% in HCC PGDH (+) group and 59.8% in HCC PGDH (-) group (P=0.93) (Fig. 5). To investigate whether 15-PGDH expression in HCC or adjacent tissues affects overall survival of HCC patients, we performed univariate and multivariate analysis with several clinicopathological factors. In multivariate analysis, age, sex, Child-Pugh class and AJCC tumor stage were significant prognostic factors, but expression of 15-PGDH in HCC tissues did not significantly affect patients overall survival (Table 4).
HCC patients with 15-PGDH downregulation in HCC tissues showed the trend of smaller number of long term survivor
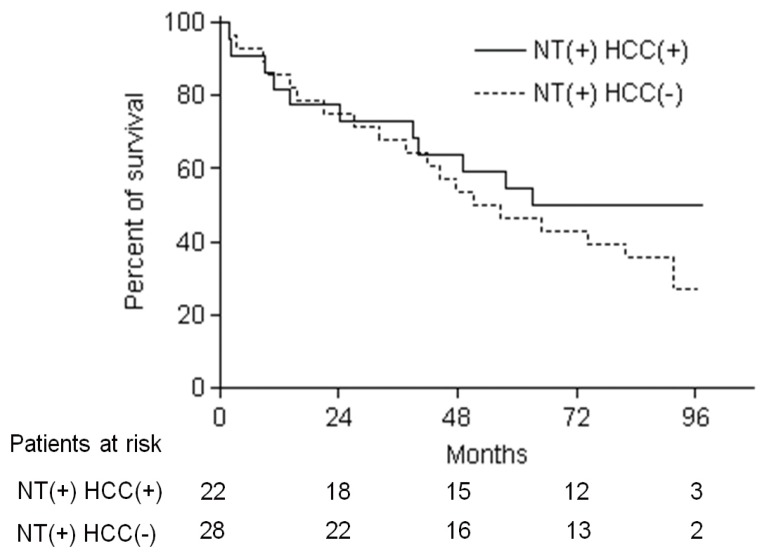
Among 50 patients who showed baseline 15-PGDH expression in nontumor adjacent liver tissues, 22 (44%) showed same or increment of 15-PGDH expression score in HCC tissues (NT (+) HCC (+) group) and the remaining 28 (56%) showed decrease of 15-PGDH expression score in HCC tissues compared with nontumor tissues (NT (+) HCC (-) group) (Table 2). All the baseline characteristics such as age, sex, liver disease etiology, Child-Pugh class serum AFP level and HCC stage and morphology were not different between NT(+) HCC (+) and NT (+) HCC (-) group (Table 5). The overall survival of 50 patients was not different according to the change of 15-PGDH expression score in HCC tissues, and 5-YSR was 54.5% in NT (+) HCC (+) group and 46.4% in NT (+) HCC (-) group (P=0.47) (Fig. 6). However, 8-YSR was 50.0 vs. 26.8% in NT (+) HCC (+) and NT (+) HCC (-) group respectively, so the patients with decrease of 15-PGDH expression in HCC tissues showed the trend of smaller number of long term survivor compared with the patients maintaining 15-PGDH expression (Fig. 6). In univariate and multivariate analysis of 50 patients, age, AJCC tumor stage and major vascular invasion were significant prognostic factors, and change of 15-PGDH in HCC tissues was not significant prognostic factor in HCC patients who showed baseline 15-PGDH expression (Table 6).
DISCUSSION
We aimed to investigate the role of 15-PGDH downregulation in HCC cell lines and patients tissues in our study. During our study, other investigators recently published in vitro evidence that 15-PGDH is downregulated in human hepatoma cells and suggested to have a relevant tumor suppressing role in HCC.20 In our HCC cell line experiments, 15-PGDH suppression with IL-1╬▓ did not change cell proliferation in PLC and Huh-7 cells, and 15-PGDH expression induction by transfection in HepG2 cells suppressed cell growth at day 2 but this inhibitory effect disappeared at day 3 of MTS assay. Actually our cell proliferation assay data after 15-PGDH induction were similar with stomach cancer cell line (SNU-719) experiment, that cell growth at day 2 after transfection was suppressed in both HepG2 and SNU-719 cells.21 This could be partially explained by the transient expression of 15-PGDH after transfection and immunoblotting of 15-PGDH after transfection also demonstrated decrease of 15-PGDH at day 3 after transfection than day 0 (12 hours) (Fig. 3B). 15-PGDH expression induction in stomach and HCC cell lines was reported to induce apoptosis in relevant cell lines, but we could not check apoptosis in our study.20,21
The characteristics of our study is that this is the first report which showed expression of 15-PGDH in the HCC tissues from the patients and investigated the correlation of 15-PGDH expression and clinical parameter and prognosis of the patients. In multivariate analysis, 15-PGDH expression did not have prognostic significance in HCC patients as a whole. However, in HCC patients with baseline 15-PGDH expression in nontumor tissue, decrease of 15-PGDH expression in HCC tissues had a trend of smaller number of long term survivors. This finding suggests 15-PGDH downregulation probably could facilitate de novo intrahepatic recurrence of HCC and affect the prognosis of HCC patients with baseline 15-PGDH expression. Considering one third of HCC patients still showed 15-PGDH expression in HCC tissues, PGE2 pathway will not be critical in the carcinogenesis of HCC. However if we confine the one third of HCC patients who showed baseline 15-PGDH in adjacent liver tissue, more than half of the patients (56%) showed decrease of 15-PGDH expression in HCC than nontumor tissue. These patients could have tendency of late recurrence of HCC and poor long term prognosis than the patients maintaining 15-PGDH expression. So, restoring 15-PGDH expression or COX-2 inhibitor treatment in this selected HCC patients could have adjuvant therapeutic impact reducing late recurrence after surgical resection. To elucidate this hypothesis, there have to be more studies with larger number of patients.
HCC is a heterogeneous tumor and well known to have several genomic alterations and aberrant activation of several signaling cascades such as epidermal growth factor receptor (EGFR), Ras/Raf/MEK/ERK, phosphoinositol 3-kinase/Akt/mammalian target of rapamycin (mTOR), Wnt/╬▓-catenin, and hepatocyte growth factor/c-Met pathways.1 Because of this complexity of genomic aberrations in HCC, inhibition of single pathway could have limited efficacy in the treatment and there has been efforts to find out adequate combination therapy to block critical pathways in HCC without any success except multikinase inhibitor, sorafenib until now. Furthermore, there have been rigorous efforts to find out predictive biomarkers in HCC for enrichment of the patients in specific targeted therapy. In colon and lung cancer, there have been reports linking EGFR signaling and 15-PGDH expression. In these reports, EGFR inhibition exerts their anti-proliferative effect through increased expression of 15-PGDH and reduction of PGE2.22,23 This cross link between EGFR signaling and 15-PGDH was not proved in HCC cell lines or tissues, but this could suggest another potential combination strategy or explanation for escape mechanism to EGFR inhibition in HCC treatment.
After the role of PGE2 and COX-2 was reported in carcinogenesis of colon cancer, chemoprevention strategy by COX-2 inhibitor was tested in colon cancer.3,24 However fatal cardiovascular adverse event have prevented wide spread usage of COX-2 inhibitor as a cancer prevention.24,25 Considering adverse event of COX-2 inhibitors, 15-PGDH induction to inactivate PGs could be pursued based on the emerging evidences that carcinogenesis in various cancers are related to reduced level of 15-PGDH,16,17,18,19 but still there remains major obstacle in clinical usage, because of the lack of adequate method to transfer 15-PGDH expression ability to human tissues. There has to be more studies and probably innovative technical advances in gene therapy.
Small number of the patients is the major limitation of this study. Especially the number of patients with baseline 15-PGDH expression in adjacent tissues was only 50, and this might make our results much less robust and statistically not significant in overall survival analysis. Furthermore, simultaneous measurement of COX-2 with 15-PGDH and direct measurement of PGE2 would be much more helpful in the interpretation of our results and we could have checked the efficacy of COX-2 inhibitor with/without 15-PGDH expression in proliferation of HCC cell lines. Meticulous another in vitro study and prospective study with more patients would be helpful in further elucidating the role of 15-PGDH down-regulation in the subgroup of HCC patients with baseline 15-PGDH expression.
In conclusion, our study did not prove significant tumor suppressive effect of 15-PGDH in HCC cell lines and expression/absence of 15-PGDH in HCC tissues did not show prognostic significance in terms of overall survival. However, one third of whole HCC patients showed baseline 15-PGDH expression in adjacent liver tissue and more than half of the patients showed decrease of 15-PGDH expression in HCC tissues. These patients with the decreased 15-PGDH expression in HCC showed tendency of poor long term prognosis than the patients maintaining 15-PGDH expression. So, restoring 15-PGDH expression or COX-2 inhibitor treatment in this selected HCC patients could have adjuvant therapeutic impact after surgical resection. To elucidate this hypothesis, further studies with larger number of patients are warranted.

 PDF Links
 PubReader
 ePub Link
 Full text via DOI
 Full text via PMC
 Download Citation
 Print
Print