Cardiovascular risk in chronic hepatitis B patients treated with tenofovir disoproxil fumarate or tenofovir alafenamide
Article information

Abstract
Background/Aims
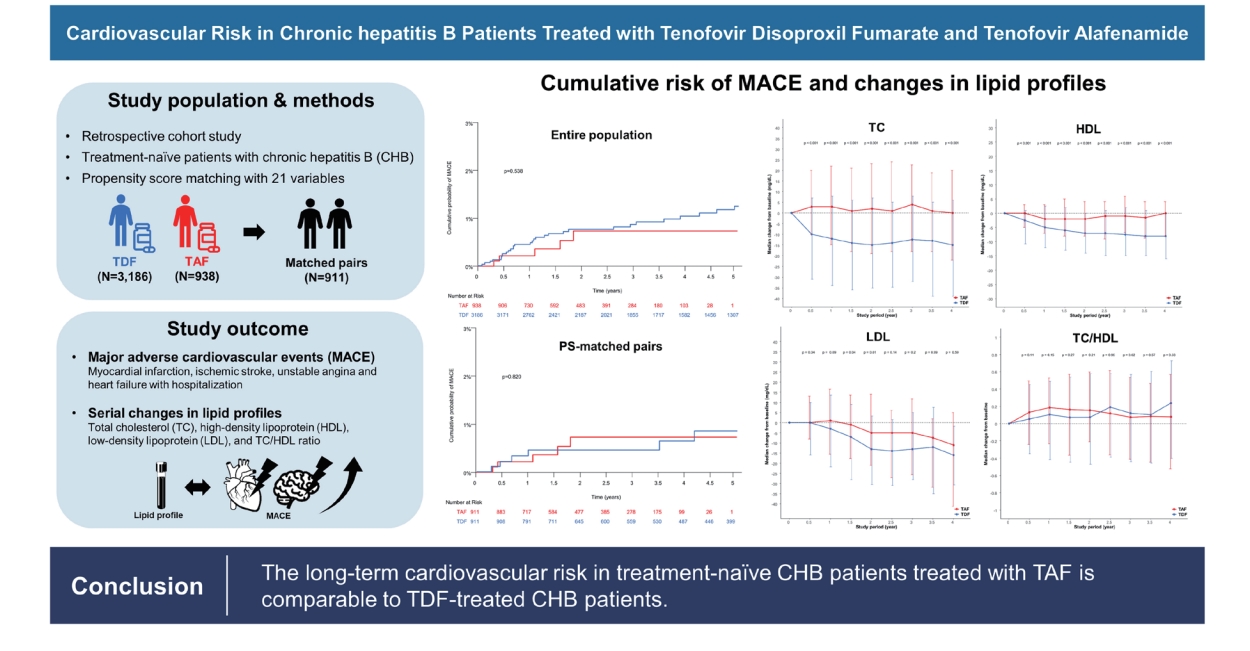
Tenofovir disoproxil fumarate (TDF) is known to have a lipid-lowering effect. This is in contrast to tenofovir alafenamide (TAF), which has a lipid-neutral effect. Therefore, concerns have been raised as to whether these differences affect long-term cardiovascular risk. Here, we aimed to evaluate the long-term risk of cardiovascular events in chronic hepatitis B (CHB) patients treated with TAF or TDF.
Methods
We retrospectively analyzed 4,124 treatment-naïve CHB patients treated with TDF (n=3,186) or TAF (n=938) between 2012 and 2022. The primary outcome was a composite endpoint of major adverse cardiovascular events (MACE), including myocardial infarction, ischemic stroke, and hospitalization for unstable angina or heart failure. Serial changes in lipid profiles between two treatments were also explored.
Results
The median age of the patients was 50.6 years, and 60.6% of the patients were male. At baseline, 486 (11.8%) and 637 (15.4%) of the patients had dyslipidemia and fatty liver, respectively. A total of 42 MACE occurred, with an annual incidence of 0.2%/100 person-years (PYs). At 1, 3, and 5 years, the cumulative risk of MACE was 0.4%, 0.8%, and 1.2% in patients treated with TDF, and 0.2%, 0.7%, and 0.7% in patients treated with TAF, respectively (P=0.538). No significant differences in the risk of MACE were observed between TDF and TAF. A multivariable analysis found that current smoker and a history of cardiovascular events were risk factors associated with an increased risk of MACE.
Conclusions
Patients treated with TAF had comparable risks of cardiovascular outcomes, defined as MACE, as patients treated with TDF.
Graphical Abstract
INTRODUCTION
Potent oral antiviral agents for chronic hepatitis B (CHB) have been proven to prevent disease progression and decrease the development of hepatocellular carcinoma (HCC) via effective suppression of hepatitis B virus (HBV) [1,2]. Currently, entecavir, tenofovir disoproxil fumarate (TDF), and tenofovir alafenamide (TAF) are widely used and recommended by international guidelines for the treatment of CHB [3-5]. However, a functional cure of CHB, defined as hepatitis B surface antigen (HBsAg) seroclearance, regardless of the appearance of the hepatitis B surface antibody, rarely occurs with these oral antiviral agents. Therefore, long-term antiviral treatment is inevitable in patients with CHB. In addition, age of patients with CHB and their prevalence of comorbidities such as dyslipidemia, diabetes, hypertension, and chronic kidney disease have increased over the past decades [6]. Indeed, metabolic risk factors are known to increase the risk of HCC in patients with CHB [7]. Hence, increased attention is being paid to the monitoring and management of comorbidities in patients with CHB under long-term antiviral treatment.
TAF is the most recently approved antiviral agent for CHB. The phase 3 trial for TAF approval demonstrated that its efficacy was not inferior to TDF and that it showed a better safety profile in bone and kidney [8-10]. However, in this trial, patients treated with TDF showed decreased lipid profiles, including levels of total cholesterol (TC), high-density lipoprotein (HDL), low-density lipoprotein (LDL), and triglyceride (TG). In contrast, no significant differences were observed in the lipid profiles of patients treated with TAF. These patterns of changes in lipid profiles were consistently reproduced in real-world data from Korean patients [11,12]. In general, previous studies, which are mostly from patients with human immunodeficiency virus (HIV), have shown that TDF exerts a consistent lipid-lowering effect [13]. In contrast, TAF is known to have a minimal effect on lipid profiles [14,15]. Nevertheless, concerns have recently been raised about whether these changes in lipid profiles affect the risk of long-term cardiovascular events in patients with CHB, since to date, this has not been well-studied.
In this study, we aimed to evaluate the risk of long-term cardiovascular events between TAF and TDF treatments and identify factors associated with cardiovascular events in patients with CHB in a large real-world cohort.
MATERIALS AND METHODS
Study design and study population
This study was a historical cohort study using data from adult treatment-naïve CHB patients who were either treated with TAF (25 mg/day) or TDF (300 mg/day) at Asan Medical Center, Seoul, Republic of Korea between January 2012 and May 2022. Patients meeting the following criteria were included in this study: (i) aged 18 years or older; (ii) HBsAg-positive for more than 6 months; (iii) no prior use of an oral antiviral agent for CHB; and (iv) treatment duration more than 6 months. Patients meeting any of the following criteria were excluded: (i) coinfection with hepatitis C virus, hepatitis D virus, HIV, or other hepatotropic viruses; and (ii) liver transplantation or solid organ transplantation. After screening patient records for inclusion and exclusion criteria, a total of 4,124 patients was included in the present study.
This study was approved by the institutional review board of Asan Medical Center (IRB Approval Number: 2022-0463) and was exempted from obtaining consent because of the retrospective nature of the patient evaluations. Moreover, we followed the guidelines for the reporting of observational studies in epidemiology (Supplementary Table 1).
Clinical and laboratory variables
Demographic variables characterizing the study population included age, sex, height, weight, body mass index, and smoking status. Comorbidities at baseline, including diabetes mellitus, hypertension, dyslipidemia, and a history of myocardial infarction (MI), stroke, heart failure (HF), and coronary artery disease (CAD) were manually reviewed using the electronic medical record database at Asan Medical Center. Dyslipidemia was defined as a history of dyslipidemia in the medical record, a total cholesterol level of 240 mg/dL or higher, or using a lipid-lowering agent. Information regarding medications, including aspirin, clopidogrel, and lipidlowering agents, were also obtained. Laboratory data included platelet count, aspartate aminotransferase (AST), alanine aminotransferase (ALT), total bilirubin, albumin, prothrombin time, TC, TG, HDL, LDL, creatinine, and estimated glomerular filtration rate (eGFR) as determined by the CKD-EPI equation [16]. HBV-related variables included hepatitis B e antigen (HBeAg) and serum HBV DNA. Serum HBV DNA levels were measured using real-time PCR (linear dynamic detection range, 15-1x10⁹ IU/mL; Abbott Laboratories, Chicago, IL, USA). Cirrhosis was clinically defined as the presence of any cirrhotic features, including coarse liver echotexture and nodular liver surface on ultrasonography, clinical features of portal hypertension (e.g., ascites, splenomegaly, or varices), or thrombocytopenia (<150,000/mm3). A fatty liver was determined by the detection of hyper-echogenicity by ultrasonography.
Study outcome and follow-up strategy
The primary outcome was a composite of major adverse cardiovascular events (MACE), which included MI, ischemic stroke, and hospitalization for unstable angina or HF [17]. The index date of this study was the date of oral antiviral agent initiation. Patients received regular follow-up sessions, including a routine clinical examination, liver function tests, and imaging tests for HCC surveillance at least every 3–6 months. Patients were followed up until the development of MACE, death from any cause, liver transplantation, the last scheduled follow-up date, or November 15, 2022, whichever came first.
Statistical analysis
Baseline characteristics were summarized using frequencies and percentages for categorical variables and means and standard deviations for continuous variables. When characterizing baseline characteristics between the two treatments, t-tests or Mann– Whitney U-tests were used to evaluate the statistical significance of differences in continuous variables, and chi-square or Fisher’s exact tests were used to assess the statistical significance of differences in categorical variables. Cumulative incidences of MACE between the two treatments were estimated using the Kaplan–Meier method and were compared using a log-rank test. In addition, we used Cox proportional hazard models to identify risk factors for MACE development. Propensity score (PS) matching was used to minimize confounding variables between the two treatments. Multiple imputation was used to estimate missing values; these values comprised 4.83–7.45% of the baseline laboratory data. PS was computed using the following 21 variables: age; sex; diabetes; hypertension; history of stroke; history of MI; history of HF; history of CAD; cirrhosis; fatty liver; TC; platelet count; AST; ALT; total bilirubin; albumin; creatinine; HBeAg positivity; aspirin use; clopidogrel use; lipid-lowering agent use. Finally, nearest-neighbor 1:1 matching was performed with a caliper size of 0.1.
In addition, we also performed two subgroup analyses for sensitivity analysis. First, patients who did not receive any lipid-lowering agents at baseline or during the follow-up period were analyzed to determine whether there were serial changes in their lipid profiles. Second, we compared the observed changes in lipid profiles among our study population to untreated patients with CHB as a control. A total of 4,309 untreated patients with CHB was used for this sensitivity analysis, and their baseline characteristics are presented in Supplementary Table 2. For all statistical analyses, P-values <0.05 were considered statistically significant, and all statistical analyses were conducted using R version 4.3.0 (https://www.r-project.org).
RESULTS
Baseline characteristics of the study population and propensity-score matched cohort
Our study population comprised 4,124 treatment-naïve patients with CHB. The baseline characteristics of these patients are presented in Table 1. The median follow-up period was 4.1 years. The median patient age was 50.6 years, and 60.6% of patients were male. At baseline, 382 (9.3%), 613 (14.9%), and 60 (1.5%) patients had diabetes, hypertension, and CAD, respectively. Among the 3,269 patients for whom smoking history data was available, 745 (18.1%), 613 (14.9%), and 1,911 (46.3%) patients were current, former, and never smokers, respectively.

Baseline characteristics of patients with chronic hepatitis B treated with TAF or TDF
TAF was initiated in 938 patients, and 3,186 patients were initially treated with TDF. Compared with the TDF treatment group, the TAF treatment group had a smaller proportion of patients who were male, had cirrhosis and HCC. However, patients who received TAF had a higher prevalence of dyslipidemia and fatty liver, and the administration of lipid-lowering agents than those that received TDF treatment. The TAF treatment group had significantly higher levels of TC, HDL, LDL, and TG than the TDF treatment group. Finally, PSmatching generated 911 pairs to enable comparisons between the two treatments. We did not observe statistically significant differences in the baseline characteristics of each treatment group, as shown in Table 1.
MACE
During the 15,527 person-years (PYs) of observation, 42 MACE occurred with an annual incidence of 0.27/100 PYs. The cumulative incidence of MACE in the entire study population was 0.4%, 0.8%, 1.2%, and 1.7% at 1, 3, 5, and 7 years, respectively.
Of the 42 occurrences of MACE, unstable angina requiring coronary artery evaluation with hospitalization was the most frequent (n=24), followed by ischemic stroke (n=14), MI (n=3), and HF requiring admission (n=1). Patients who developed MACE were significantly older and had a higher prevalence of diabetes, hypertension, and a history of CAD compared to patients who were not afflicted by a MACE (Supplementary Table 3). Critically, no significant differences in the rate of MACE occurrence were observed between the TAF and TDF treatments (P=0.134, Supplementary Table 3).
In the TAF group, MACE developed in five patients, in contrast, 37 patients experienced MACE in the TDF group. At 1, 3, and 5 years, the cumulative incidence of MACE was 0.4%, 0.8%, and 1.2% in patients treated with TDF, and 0.2%, 0.7%, and 0.7% in patients treated with TAF, respectively. No statistically significant differences in the risk of MACE were found when comparing the TAF and TDF treatments (P=0.538) (Fig. 1A).
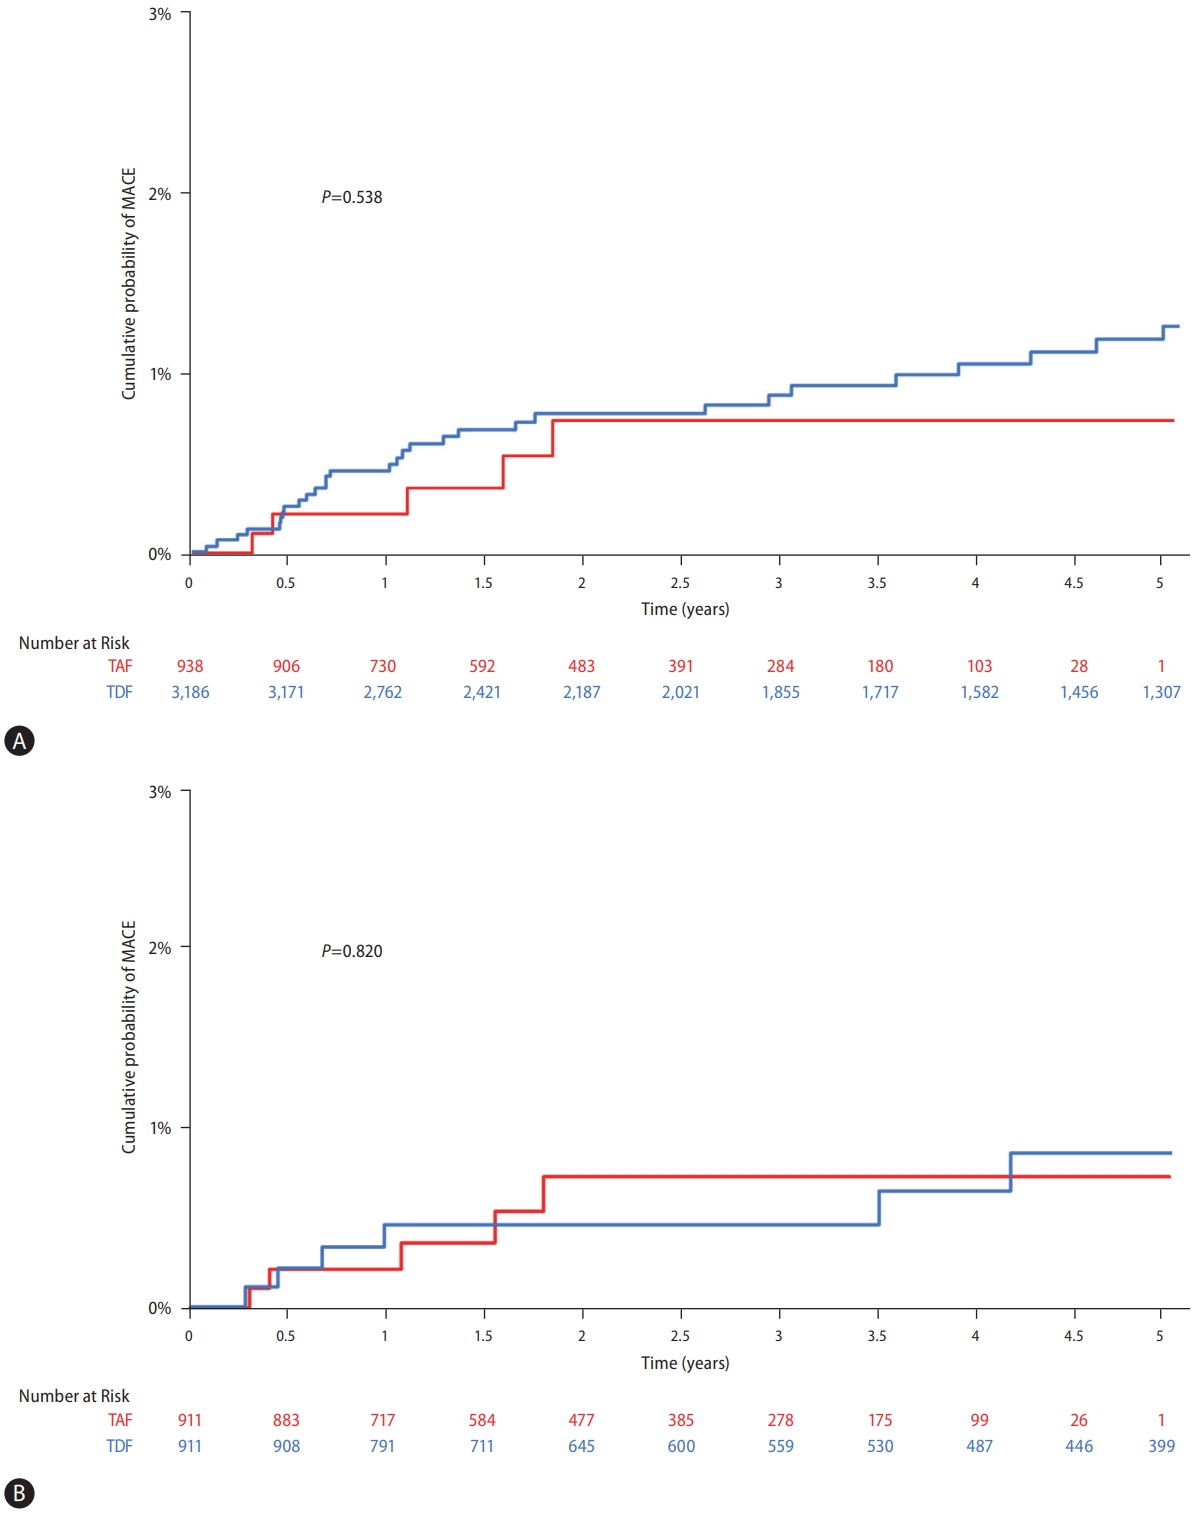
Cumulative probability of long-term cardiovascular outcomes in patients treated with tenofovir disoproxil fumarate (TDF) or tenofovir alafenamide (TAF). (A) Between TAF and TDF treatment in the entire study population. (B) Between TAF and TDF treatment in the propensity- score matched pairs. MACE, major adverse cardiovascular event.
Among the 911 PS-matched pairs, five patients in the TAF group and seven patients in the TDF group experienced MACE during the observation period. The cumulative risk of MACE in each group did not significantly differ in the PSmatched pairs (P=0.820, Fig. 1B).
Risk factors for MACE development
According to the univariate Cox model analysis, older age (hazard ratio [HR]: 1.07, 95% confidence interval [CI]: 1.04– 1.10, P<0.001), diabetes, hypertension, and a history of cardiovascular events were all significantly associated with an increased risk of MACE (Table 2, P<0.001 for all). In the multivariate Cox model, significant factors for an increased risk of MACE were current smoker (adjusted hazard ratio [AHR]: 2.25, 95% CI: 1.07–4.75, P=0.033), hypertension (AHR: 2.07, 95% CI: 1.03–4.13, P=0.040), and a history of cardiovascular events (AHR: 29.2, 95% CI: 14.7–57.9, P<0.001, Table 2). Diabetes appeared to be associated with a higher risk of MACE despite not reaching statistical significance. When comparing TDF to the reference TAF treatment, we found no significant association with an increased risk of MACE in univariate analysis.

Factors associated with the risk of cardiovascular events
Changes in lipid profiles
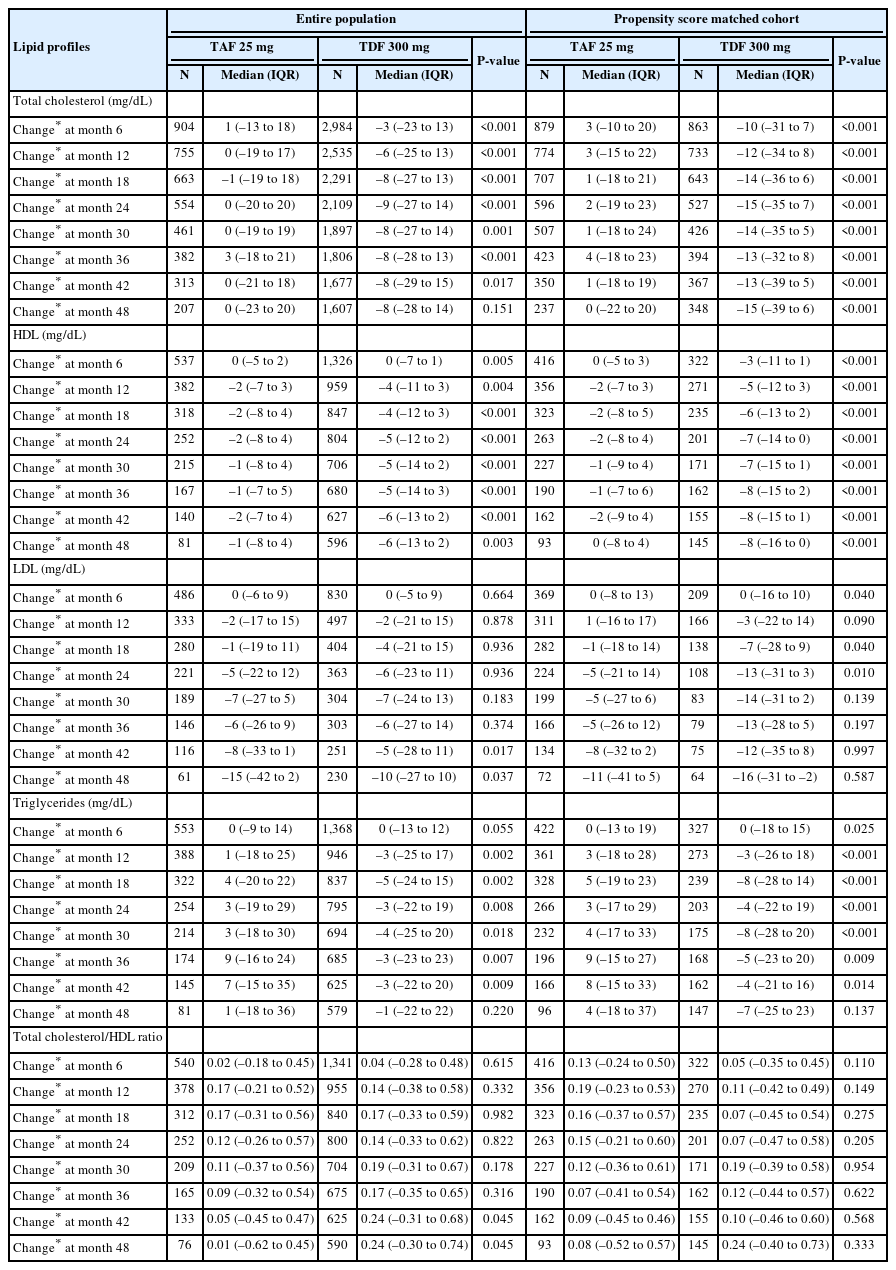
In the entire study population, the median changes in TC from the baseline after 1, 2, 3, and 4 years of treatment were –6 mg/dL, –9 mg/dL, –8 mg/dL, and –8 mg/dL in the TDF group and 0 mg/dL, 0 mg/dL, 3 mg/dL, and 0 mg/dL in the TAF group, respectively (Table 3 and Supplementary Fig. 1A). In the PS-matched pairs, the median changes in TC from the baseline were –12 mg/dL, –15 mg/dL, –13 mg/dL, and –15 mg/dL in the TDF group and 3 mg/dL, 2 mg/dL, 4 mg/dL, and 0 mg/dL in the TAF group at 1, 2, 3, and 4 years of treatment, being statistically significant difference between the two treatments (Table 3 and Fig. 2A).
Changes in lipid profiles during the study period
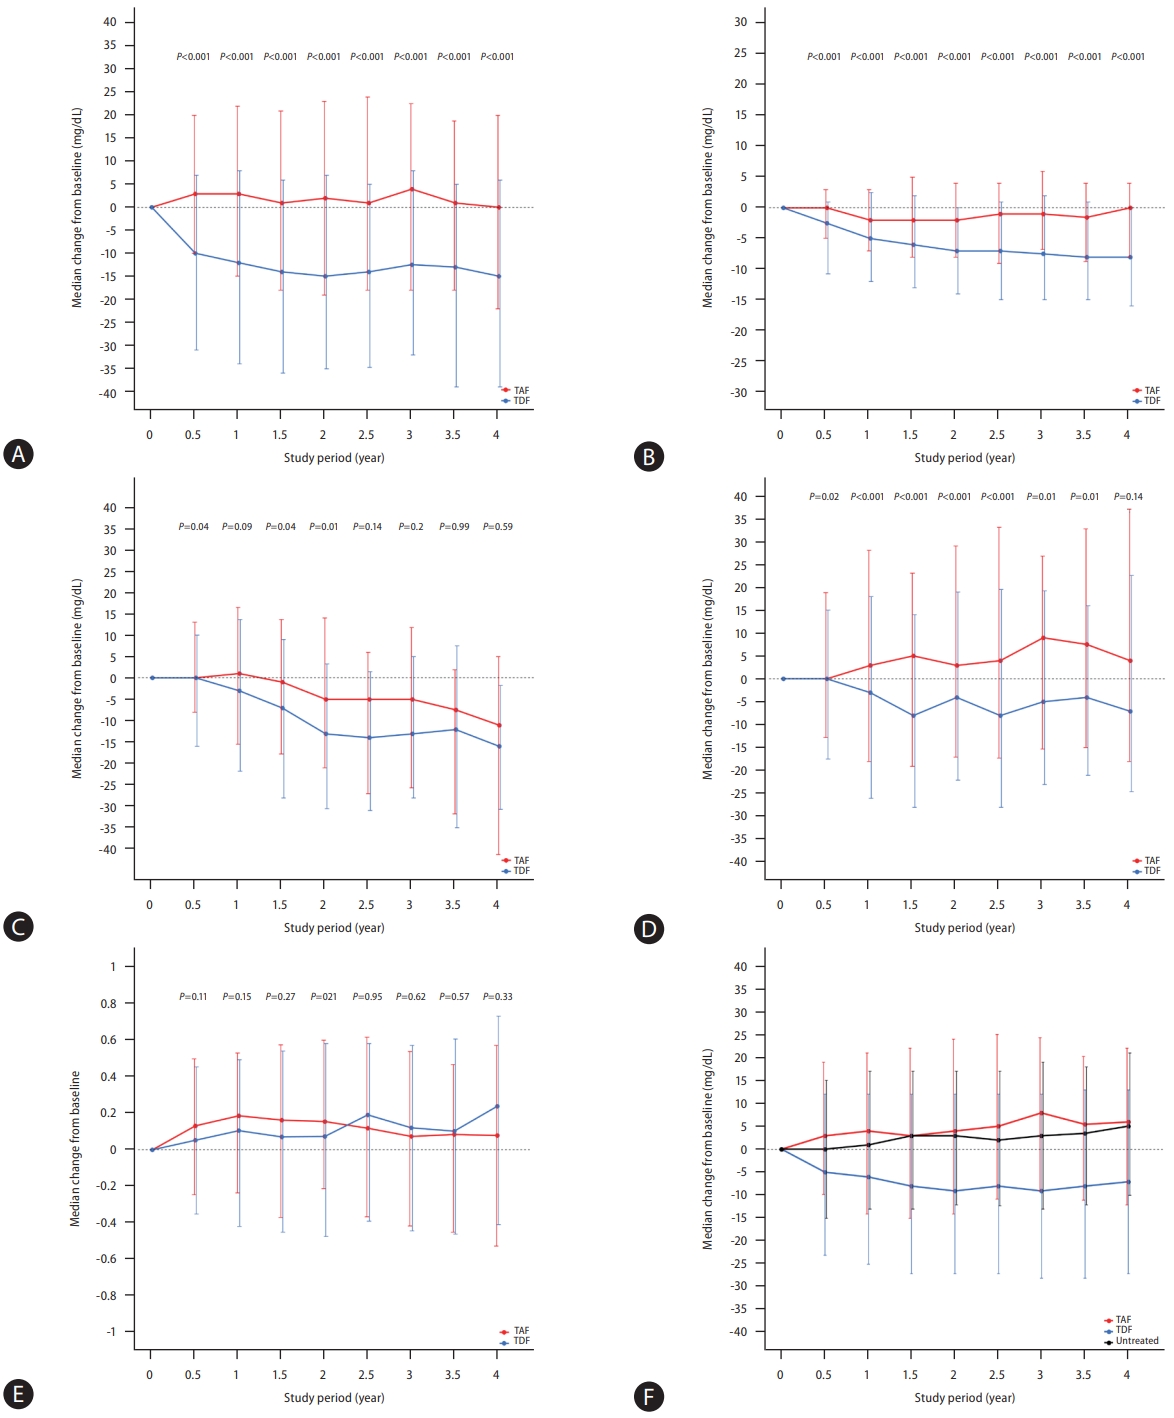
Changes in the lipid profiles. (A) Total cholesterol in propensity-score (PS) matched pairs. (B) High-density lipoprotein in PS-matched pairs. (C) Low-density lipoprotein in PS-matched pairs. (D) Triglyceride in PS-matched pairs. (E) Total cholesterol/high-density lipoprotein ratio in PS-matched pairs. (F) Total cholesterol in patients with and without antiviral treatment. TAF, tenofovir alafenamide; TDF, tenofovir disoproxil fumarate.
The median decrease in HDL levels from the baseline during treatment was significantly greater for the TDF treatment than the TAF treatment in both the entire population (P<0.05 for all, Table 3 and Supplementary Fig. 1B) and in the PSmatched pairs (P<0.001 for all, Table 3 and Fig. 2B).
Moreover, we found that LDL levels did not significantly differ between the two treatments in the entire population (Supplementary Fig. 1C), while the TDF treatment appeared to show a greater median decrease from the baseline than the TAF treatment in the PS-matched pairs (Table 3 and Fig. 2C).
Compared to the TAF treatment, the TDF treatment exhibited a significantly greater decline in median TG change from the baseline, both in the entire population (Supplementary Fig. 1D) and in the PS-matched pairs (Table 3 and Fig. 2D).
No significant difference was observed in the ratio of TC/HDL between the two treatments, either in the entire population (Supplementary Fig. 1E) or the PS-matched pairs (Table 3 and Fig. 2E).
Subgroup analysis
Of the 4,124 patients, 329 (8.0%) patients received lipidlowering agents at baseline, and 296 (7.2%) patients began any types of lipid-lowering agent treatment during the follow-up period. Therefore, 3,499 (85.9%) patients who never administered lipid-lowering agents were included in the first subgroup analysis (Supplementary Table 4). In this subgroup, the TDF treatment showed a significantly greater decrease in median TC changes relative to TAF treatment during the study period (Supplementary Table 5 and Supplementary Fig. 2A). We also observed a significantly greater decrease in the median HDL, LDL, and TG levels during TDF treatment than in TAF treatment (Supplementary Fig. 2B–D). However, no significant difference was observed in the serial change in the TC/HDL ratio between the two treatments (P>0.05 for all, Supplementary Fig. 2E).
We compared these study population to 4,309 untreated CHB patients in our center as a sensitivity analysis. As shown in Figure 2F, the TDF treatment showed a greater decrease in median TC relative to untreated patients (P<0.001 for all). However, the TAF treatment did not significantly affect the median change in TC levels relative to untreated patients during the follow-up period (P>0.05 for all).
DISCUSSION
In this study, an analysis of large-scale, real-world data of treatment-naïve CHB patients treated with TAF or TDF revealed no significant difference in the long-term risk of adverse cardiovascular outcomes, defined as MACE, between the two treatments. Compared with TAF treatment, the TDF treatment resulted in a significantly greater decrease in median TC, HDL, and TG, and tended to also show a greater decrease in the median change of LDL. However, the TC/HDL ratio did not significantly differ between the two treatments. Active smoker, history of MI, and CAD—all of which are regarded as traditional risk factors for MACE—were found to be significantly associated with an increased risk of MACE.
Remarkable differences in lipid profiles between patients treated with TAF and TDF have been previously observed in multiple studies. In general, these studies showed that TDF treatment was associated with a decrease in all lipid parameters, whereas TAF treatment was associated with stable lipid parameters. Notably, no significant difference was found in the TC/HDL ratios of the two treatments due to the simultaneous decrease in the TC and HDL levels in the TDF treatment population. In this regard, patients who switched from TDF to TAF generally showed an increase in lipid parameters—due to the loss of the suppressive effect of TDF on lipid parameters— without displaying a significant change in their TC/HDL ratio. Nevertheless, apprehension regarding increasing the risk of cardiovascular events is often raised due to long-term use of TAF accompanied by worsening lipid profiles, which is strongly associated with atherosclerosis. Interestingly, this concern originated among people living with HIV (PLWH) who require long-term antiviral treatment, as do patients with CHB.
Traditionally, a single lipid parameter, such as the LDL level, had been used to predict cardiovascular risk. However, according to a recent large epidemiologic study, the TC/HDL ratio is considered to be a better cardiovascular event predictor than the LDL level. In particular, adding LDL to the TC/HDL ratio does not increase its predictive power with respect to cardiovascular risk prediction. As shown in the phase 3 study for TAF approval in patients with CHB, no significant differences were observed in the TC/HDL ratios of patients who had up to three years of treatment. In the present study, we also observed that the TC/HDL ratio did not significantly differ between the two treatments in a patient population with a median follow-up duration of four years. This translates into a comparable cumulative risk of MACE, regardless of LDL levels, in TAF and TDF treatment groups.
Many predictive scores for predicting long-term cardiovascular risk have been developed and used for selecting patients for treatment, targeting treatment goals, and for prognostication. For example, the atherosclerotic cardiovascular disease (ASCVD) risk score is widely used [18,19]. A previous study comparing TAF and TDF in treatment-naïve PLWH showed that lipid changes associated with TDF treatment did not substantively affect cardiovascular risk profiles compared with TAF treatment [20]. In addition, the findings of that study suggested that cardiovascular risk was not related to lipid changes between the two treatments but rather to the presence of traditional cardiovascular risk factors such as smoking or hypertension [20]. Indeed, being a current smoker, having a history of MI or CAD, and having hypertension were all associated with an increased risk of cardiovascular events regardless of the type of antiviral treatment administered in the present study, despite hypertension showing marginal statistical significance between treatments.
Although TAF and TDF are both tenofovir prodrugs, questions regarding the differences in their effects on patient lipid profiles remain unanswered. An in vitro study demonstrated that TDF, compared with entecavir treatment and control, reduced supernatant cholesterol, activated PPAR-a-mediated signaling, and upregulated the expression of PPAR-a-target genes, including carnitine palmitoyltransferase 1 (CPT1) and CD 36 [21]. This study also suggested that silencing of hepatic CD36 and PPAR-a signaling negated the lipid-lowering effect of TDF [21]. However, the mechanism by which TAF affects lipid profiles has not been postulated so far, and whether the hypothesis of the above-mentioned study is also applicable to TAF requires further investigation.
Due to the increasing age of patients with CHB and the necessity of long-term antiviral treatment for most CHB patients, the management of comorbidities, including hypertension, diabetes, and hyperlipidemia, becomes more crucial. Cardiovascular events emerge as a major cause of death in virologically suppressed CHB patients without the development of HCC. Therefore, a thorough checkup, including an investigation of patient metabolic components (i.e., such as lipid profiles), may be added to routine care for patients with CHB regardless of the type of antiviral treatment used. Moreover, concerns regarding increased lipid levels resulting from TAF treatment may be diminished based on our findings, which suggests that there is no significant difference in lipid levels between TAF and no antiviral treatment.
The strengths of our study include the use of a large sample, which enabled us to obtain a sufficient number of primary outcomes despite the very low incidence of MACE. Given that TAF has recently been approved for CHB treatment, most previous studies reported data for lipid profiles as surrogate markers of long-term cardiovascular events. However, here, we investigated the association between two antiviral treatments and hard outcomes of CHB patients, which should ultimately be explored in greater detail in the future. In addition, we conducted a sensitivity analysis of patients who never received lipid-lowering agents to avoid the potential effect of lipid-lowering agents. Finally, our study population also compared treated and untreated CHB patients to explore the precise effect of TAF on patient lipid profiles.
However, the current study also has some limitations. First, as a retrospective single-center study based on observational data, there were possible selection biases. Also, not all patients were regularly followed-up with full lipid profiles unless some reasonable circumstance suggested that they be performed. However, the TC levels of almost all patients were available for analysis, and they showed trends that were consistent with those of previous studies [8-11,22]. Second, factors that may interfere with lipid profiles, including alcohol consumption and weight changes, were not investigated in this study. Third, we could not assess the longitudinal trend of the ASCVD score, which has been widely used for predicting the 10-year risk of cardiovascular events, because of the lack of variables that are components of the ASCVD score in some patients due to the nature of retrospective study. Fourth, our study population may not be adequately addressing the risk of cardiovascular outcomes considering the relatively young age of the study population (a median age of 50 years) because cardiovascular events occur more frequently with increasing age. However, previous studies consisting of treatment-naïve patients with CHB generally included patients aged 40–50 years [8,9]. Therefore, to evaluate and compare such outcomes in a prospective manner is not feasible. That is why we designed our study with a large number of patients and a relatively long period of follow-up. We believe that in order to strengthen and validate our findings, a population-level cohort study should be warranted in the future. Last, although we gathered information regarding all prescribed drugs from patient medical records, data related to lipid-lowering agents that may have been prescribed by other hospitals or obtained as over-the-counter drugs could not be obtained. However, most lipid-lowering agents require a prescription from a physician and cannot be purchased over the counter. Additionally, a few MACE may not have been captured despite the meticulous record review of our study population, which can limit our finding.
In conclusion, we demonstrated that the risk of long-term cardiovascular events in treatment-naïve CHB patients treated with TAF and TDF were comparable. Distinct serial changes between the two treatments were shown in lipid profiles. Nevertheless, no significant difference in the TC/HDL ratio, which is thought to be well-associated with the risk of cardiovascular events, was observed between the two treatments. Further studies with longer follow-up periods are necessary to validate our findings.
Notes
Authors’ contribution
All authors had full access to all data used in this study and take responsibility for the data integrity and the accuracy of the data analyses. H Hong and J Choi were responsible for the conception and design of the study; W-M Choi, D Lee, JH Shim, KM Kim, Y-S Lim, and HC Lee were responsible for the acquisition, analysis, and interpretation of data as well as the drafting of the manuscript. J Choi performed the statistical analyses. All authors approved the final version of the manuscript.
Conflicts of Interest
The authors have no conflicts to disclose.
Acknowledgements
This study was supported by grants from the National Research Foundation of Korea (NRF), funded by the Korean government (Ministry of Science and ICT) (No. 2021R1G1A1009506), Korea Health Technology R&D Project (No. HI21C2448), the Patient-Centered Clinical Research Coordinating Center (HC20C0062) of the National Evidence-based Healthcare Collaborating Agency, and the National R&D Program for Cancer Control through the National Cancer Center (HA21C0110), funded by the Ministry of Health and Welfare, Republic of Korea.
The authors would like to express their gratitude to Chaeyeon Lim and Mi Ryu for their assistance in this study.
SUPPLEMENTAL MATERIAL
Supplementary material is available at Clinical and Molecular Hepatology website (http://www.e-cmh.org).
STROBE statement
Baseline characteristics of 4,309 untreated patients with chronic hepatitis B.
Comparison of baseline characteristics between patients with and without the development of major adverse cardiovascular events (MACE)
Baseline characteristics of patients who did not administer any lipid-lowering agents at baseline and during the study period
Changes in the lipid profiles during the study period in patients who did not receive any lipid-lowering agents at baseline or during the study period
Serial changes in the lipid profiles of the entire study population.
Serial changes in the lipid profiles of patients who did not receive lipid-lowering agents.
Abbreviations
AHR
adjusted hazard ratio
ALT
alanine aminotransferase
AST
aspartate aminotransferase
CAD
coronary artery disease
CHB
chronic hepatitis B
eGFR
estimated glomerular filtration rate
HBeAg
hepatitis B e antigen
HBsAg
hepatitis B surface antigen
HBV
hepatitis B virus
HCC
hepatocellular carcinoma
HDL
high-density lipoprotein
HF
heart failure
HIV
human immunodeficiency virus
LDL
low-density lipoprotein
MACE
major adverse cardiovascular event
MI
myocardial infarction
PS
propensity score
TAF
tenofovir alafenamide
TC
total cholesterol
TDF
tenofovir disoproxil fumarate
TG
triglyceride
References
Article information Continued
Notes
Study Highlights
• TAF and TDF affect the lipid profiles of patients with CHB differently.
• In the present study, there was no significant difference in the long-term risk of adverse cardiovascular outcomes between patients treated with TAF and those treated with TDF.
• Patients treated with TDF exhibited a significantly greater decline in median changes of TC, HDL, and triglyceride than those treated with TAF. However, the TC/HDL ratio did not show a significant difference between the TAF and TDF groups.
• Active smoking and a history of cardiovascular events were significantly associated with an increased risk of adverse cardiovascular outcomes.
• Despite the distinct serial changes in lipid profiles, long-term cardiovascular outcomes were comparable between the TAF and TDF treatments among patients with CHB.