


Graphical Abstract
INTRODUCTION
According to global health estimates 2015 of the World Health Organization (WHO), approximately 1.2 million people worldwide die each year from cirrhosis and subsequent complications and 800,000 die of hepatocellular carcinoma, comprising 3.5% of all deaths worldwide [1,2]. Especially, the Asia-Pacific region accounts for 45% of the worldŌĆÖs deaths due to liver disease. As chronic liver disease (CLD) may develop due to a variety of etiologies including chronic viral infection, alcohol, and metabolic causes, the implement of population-based interventions that screen for the underlying cause and the use of lifestyle and pharmacological interventions to prevent or delay the progression to life-threatening cirrhosis complications and liver cancer is imperative.
The WHO recently proposed a strategic plan consisting of global efforts to eradicate hepatitis virus, the main cause of liver disease [3]. Despite ongoing efforts, the global burden of CLD is anticipated to increase in a generation [2]. More than 5% of all deaths worldwide are attributed to the harmful use of alcohol, and alcohol-related liver disease (ALD) accounts for one quarter of all alcohol-related deaths [4]. Considering the increase in per capita alcohol consumption in the Asia-Pacific region [5], the prevalence of ALD and its complications is expected to increase further in the near future. Non-alcoholic fatty liver disease (NAFLD), the most notable liver disease, has emerged as a new management subject as viral liver disease enters a genuine phase [6]. NAFLD is also expected to increase as the incidence of obesity increase due to westernized eating habits, a lack of exercise, and lifestyle changes [7].
Over the past three decades, there have been great successes in CLD management, particularly in viral hepatitis, as well as epidemiological changes. However, data on trends in the prevalence of CLD in Korea are sparse. Recently, NAFLD modeling is being actively attempted to forecast the disease burden using currently available data [7]. A nationwide prevalence investigation would provide more accurate rates in entire population and specific subpopulations [8] for use as basic data for CLD modeling.
Accordingly, we sought to determine the current prevalence of CLD in Korean adults aged 19 and older and whether the prevalence changed between 1998ŌĆō2001 and 2016ŌĆō2017 in a representative Korean adult population data from the Korea National Health and Nutrition Examination Survey (KNHANES).
MATERIALS AND METHODS
Sample population
The KNHANES is a series of cross-sectional national health and nutrition surveys designed to provide representative prevalence estimates for a variety of health measures and conditions. The KNHANES is conducted by the Korean Centers for Disease Control. The survey design is a complex, stratified, multi-stage probability sampling of the civilian, non-institutionalized Korean population. The procedures used to select the sample as well as to conduct the interviews and examinations have been specified elsewhere [9]. This survey included an interview to obtain information concerning an individualŌĆÖs health history, health behaviors, and risk factors. A subsequent health examination was performed at a mobile examination center.
Our analyses included data from 1998ŌĆō2001 (KNHANES I and II) and 2016ŌĆō2017 (KNHANES VII-1 and VII-2). We included a total of 14,801 participants aged 19 years and older from KNHANES 1998ŌĆō2001 and 12,900 participants from KNHANES 2016ŌĆō2017, respectively in this study. Of that number, 1,808 subjects who had incomplete data on NAFLD prediction model or biochemical/clinical parameters were excluded. Finally, 25,893 (14,438 in KNHANES 1998ŌĆō2001 and 11,455 in KNHANES 2016ŌĆō2017) participants were included in the analyses. Informed consent was obtained from all participants, and the protocol was approved by the Institutional Review Board of the Korean Centers for Disease Control.
Definition of CLD etiology
NAFLD was defined using the validated hepatic steatosis index which was calculate as 8 ├Ś alanine aminotransferase / aspartate aminotransferase (ALT / AST) ratio + body mass index (BMI) (+2, if diabetes; +2, if female) [10] in the absence of any other evidence of CLD, such as excessive alcohol intake or a positive hepatitis B or hepatitis C test. From 1998-2001, since anti-hepatitis C virus (anti-HCV) tests were not performed in KNHANES, chronic hepatitis C (CHC) cannot be ruled out in defining NAFLD during that period. The optimal cut-off value for NAFLD was set at >36. In the subpopulation with NAFLD, the AST-to-platelet ratio index (APRI) [11] and fibrosis-4 (FIB-4) [12] were used to evaluate liver fibrosis. Their formula were as follows: APRI = [(AST / upper limit of normal) / platelet count (109/L)] ├Ś 100, where the upper limits of normal AST levels were set at 37 IU/L for men and 29 IU/L for women [13]; FIB-4 = age ├Ś AST / [platelets in 109/L ├Ś (ALT)1/2]. Cut-off values for advanced fibrosis (ŌēźF3) were set at 1 of APRI and 2.67 of FIB-4. APRI and FIB-4 were calculated only in KNHANES 2016ŌĆō2017 due to a lack of data in the KNHANES 1998ŌĆō2001.
Chronic hepatitis B (CHB) was defined as HBsAg seropositivity. An anti-HCV test was done only in the KNHANES 2016ŌĆō2017, but an HCV RNA polymerase chain reaction (PCR) test was not performed. We assumed that CHC affected approximately 30% of those with anti-HCV positivity based on an observation in KNHANES 2013ŌĆō2015, in which an HCV RNA PCR test showed that 37 individuals were HCV RNA positive among 119 subjects with anti-HCV positivity. The study definition of ALD was a combination of excessive alcohol consumption (Ōēź210 g/week for men and Ōēź140 g/week for women) and an ALD/NAFLD index >0, which was calculated as ŌĆō58.5 + 0.637 (mean corpuscular volume) + 3.91 (AST/ALT) ŌĆō 0.406 (BMI) + 6.35 for male gender [14].
Definition of clinical parameters
Diabetes mellitus was defined based on use insulin or oral hypoglycemic agents or fasting plasma glucose Ōēź126 mg/dL. Participants were diagnosed as hypertensive if the systolic pressure was Ōēź140 mmHg, diastolic pressure was Ōēź90 mmHg, or antihypertensive medication was used. Hypercholesterolemia was defined as a cholesterol level Ōēź240 mg/dL. Obesity was defined as a BMI of Ōēź25 [15], while central obesity was defined using the thresholds for waist circumference (Ōēź90 cm for men and Ōēź80 cm for women) [16]. Insulin resistance was calculated using the triglycerides and glucose index as follows: Ln [fasting glucose (mg/dL) ├Ś triglycerides (mg/dL) / 2) [17].
Data analyses
Sample weights were included in the estimation process for all of the analyses to reflect the differential probabilities for selection, non-response, and non-coverage [9]. All analyses were performed using Complex Samples in SPSS statistics (version 25.0; IBM Corp., Armonk, NY, USA), which provides the specialized statistics for complex sample designs, such as stratified, clustered or multistage sampling. When merging KNHANES survey cycles, appropriate selection of sampling weights and adjustment coefficients were applied according to the KNHANES guidelines [18]. The data were presented as weighted means or weighted proportions with standard errors for continuous or categorical variables, respectively. Differences between the two study cycles were examined with Wald F test statistics in a general linear model for continuous variables and the Rao-Scott adjusted chi-square test for categorical variables.
RESULTS
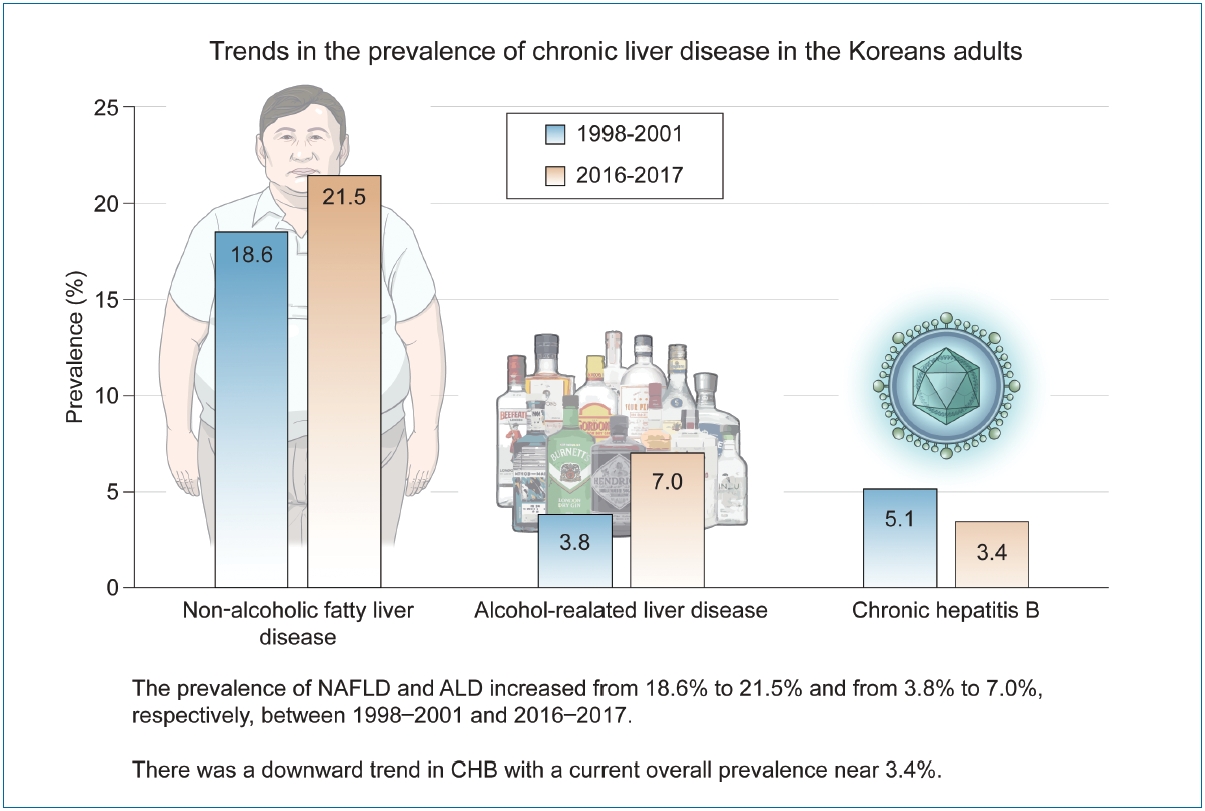
Table 1 shows the weighted distribution of the KNHANES 1998ŌĆō2001 and 2016ŌĆō2017 samples. With the exception of smoking status and CHB, all clinical parameters disadvantageously changed during two decades. Compared with 1998ŌĆō2001, the prevalence in 2016ŌĆō2017 increased for obesity, diabetes, and hypertension. These unfavorable changes represented with an increased NAFLD prevalence in 2016ŌĆō2017 from 18.6% (95% confidence interval [CI], 17.8ŌĆō19.5%) in 1998ŌĆō2001 to 21.5% (95% CI, 20.6ŌĆō22.6%). Along with increase in excessive drinking, the prevalence of ALD also increased from 3.8% (95% CI, 3.4ŌĆō4.2%) in 1998ŌĆō2001 to 7.0% (95% CI, 6.4ŌĆō7.6%) in 2016ŌĆō2017. In contrast, the prevalence of CHB in 2016ŌĆō2017 decreased from 5.1% (95% CI, 4.6ŌĆō5.5%) in 1998ŌĆō2001 to 3.4% (95% CI, 3.0ŌĆō3.8%) in 2016ŌĆō2017. The prevalence of CHC was approximately 0.3% in 2016ŌĆō2017. Gender-specific trends in the prevalence of CLD are presented in Table 2. Changes in the prevalence of NAFLD, ALD, and CHB during the study period were evident in both genders.
Figure 1 shows the changes in the prevalence of NAFLD, ALD, and CHB. The increase in the prevalence of NAFLD was led by the 20s, 30s, and 60s age groups. With the exception of the 60s group, increases in ALD prevalence were seen in all age strata. There was a sharp increase in ALD prevalence in 20s from 1.6% (95% CI, 1.1ŌĆō2.3%) in 1998ŌĆō2001 to 6.4% (95% CI, 4.9ŌĆō8.3%) in 2016ŌĆō2017. The prevalence of CHB was decreased in all age groups except in the 60s. In particular, the prevalence decreased dramatically in the 20s from 5.0% (95% CI, 4.1ŌĆō6.2%) in 1998ŌĆō2001 to 1.2% (95% CI, 0.7ŌĆō2.0%) in 2016ŌĆō2017. A similar trend was observed in the 30s from 5.8% (95% CI, 5.1ŌĆō6.7%) in 1998ŌĆō2001 to 3.6% (95% CI, 2.7ŌĆō4.8%) in 2016ŌĆō2017.
When the study sample was stratified by selected characteristics, the prevalence of NAFLD was approximately 50% among participants with obesity and diabetes and 30% among those with hypertension and hypercholesterolemia in both survey cycles (Table 3). Among the 2,440 participants with NAFLD in 2016ŌĆō 2017, the prevalence of advanced fibrosis, defined by an APRI >1 and an FIB-4 >2.67, were 1.4% (95% CI, 0.9ŌĆō2.1%) and 1.2% (95% CI, 0.8ŌĆō1.8%), respectively.
DISCUSSION
The current study provides an estimate of the current and past prevalence of CLD in Korean adult population and demonstrates how the prevalence has changed over two decades using KNHANES surveys. The KNHANES is the only population-based survey that provides nationally representative estimates of the prevalence -and, therefore, the lifetime risk- of CLD. Consequently, relatively accurate, clinically relevant population estimates can be generated, and time trends can be identified. The two surveys described here indicated that the prevalence of NAFLD and ALD increased by 16% and 84%, respectively, in persons aged 19 years or older over the 19-year interval. In contrary, we found encouraging results with regard to the prevalence of CHB which decreased by 33%.
From our analyses, we estimate that the prevalence of NAFLD increased from 18.6% in 1998ŌĆō2001 to 21.5% in 2016ŌĆō2017. This increase was evident in age groups of 20s, 30s, and 60s as well as in both genders. This increase may be large due to the increasing population of obesity and diabetes in which the prevalence of NAFLD is approximately 50%. It also could be attributable to the aging Korean population (42 years in 1998ŌĆō2001 vs. 47 years in 2016ŌĆō2017). This increasing trend of NAFLD prevalence reported here is similar to that of a recent systematic review of an Asian population [19]. Another study predicted that NAFLD prevalence in Asia will increase from ~18% in 2016 to 22% by 2030 and that obesity will increase from ~27% in 2016 to 28.5% by 2030 [8]. Taken together, our results demonstrate that unless there is apparent attenuation in the trend of well-established risk factors, the prevalence of NAFLD is expected to continually increase. We also found that 1.2ŌĆō1.5% of the participants with NAFLD had advanced fibrosis (ŌēźF3). Its prevalence is similar to previously reported estimates in US population [20], representing a major disease burden in now and near future.
As expected by the observed increase in excessive alcohol consumption, the estimated prevalence of ALD increased approximately 85% over this same period. This sharp increasing trend in ALD was primarily driven by increasing ALD levels in young adults. Our analysis identified a strong and upward trend in ALD prevalence among person younger than 40 years. Considering that the early initiation of alcohol abuse in early adulthood is associated with unhealthy drinking patterns and adverse psychosocial, behavioral, and other long-term health outcomes [21], this unfavorable trend of excessive consumption corresponding with ALD in young adults is a concern from a public health perspective.
Our results shed some light on encouraging trends in CHB. We observed a downward trend in CHB across all age groups, with the exception of the 60s. In the 20s age group, we revealed that the prevalence of CHB fell from 5% in 1998ŌĆō201 to 1.2% in 2016ŌĆō2017. Because CHB is a lifetime infectious disease, any increases or decreases in CHB are expected to be first evident in younger persons. This finding is in agreement with a previous study, which reported that the incidence and prevalence of CHB decreased over the last two decades due to the successful implementation of a vaccination program [22,23]. Despite the substantial progress in preventing CHB in young adults, this study confirms the ongoing high prevalence of CHB among Korean adults. The consequent burden of CHB remains high and is consistent with findings from a recent modelling study [24].
Our findings of the prevalence of anti-HCV positivity (0.8%; 95% CI, 0.6ŌĆō1.0%) are consistent with a prior analysis of Korean data in 2009 that reported 0.8% of about 300,000 health-check examinees [25]. Our study extended the temporal trend analysis through 2017 to demonstrate continued stability of anti-HCV positivity. Based on a finding that one third resulted in HCV RNA positivity among those with anti-HCV positivity, the extrapolation of KNHANES data suggests a 0.3% CHC prevalence in 2016ŌĆō 2017. The estimated prevalence of CHC reported here is much lower than previous estimates (approximately 1%) in Korea or a recent global estimate [26,27], which was based on anti-HCV positivity.
The main strength of the current study is that the data were representative of the Korean population and collected using standardized measurements. Although this study makes important contributions to the literature, it also has a number of limitations. First, because of the absence of imaging or histological diagnosis of NAFLD and ALD, we adopted operational criteria for defining NAFLD and ALD based on a predictive model that has been validated. Therefore, interpretation of our results should be made with caution. Second, the data on alcohol measurement were based on self-reports; thus, they may be influenced by recall and social desirability bias. Third, rather than tracing the changes that occurred over decades, our study simply compared the prevalence at two time points. Although we can confirm an increase in NAFLD and ALD during the study period, it is unclear whether the prevalence of the two diseases was continuously increasing. Finally, the survey participants were sampled only from the non-institutionalized Korean population. The following persons were excluded from the analysis: incarcerated persons, homeless persons, and person who were physically unable to undergo the survey. Therefore, the overall CLD prevalence might be underestimated.
In conclusion, our study found that the prevalence of NAFLD and ALD, particularly in young adults, increased in the Korean adult population from 18.6% to 21.5% and from 3.8% to 7.0%, respectively, between 1998ŌĆō2001 and 2016ŌĆō2017. However, there is a downward trend in CHB with a current overall prevalence near 3.4%. The CHC prevalence appears to have plateaued 0.3%. Our results demonstrate potential targets for interventions to reduce the future burden of CLD. Public health efforts are required to prevent and improve modifiable risk factors of CLD.

 PDF Links
 PubReader
 ePub Link
 Full text via DOI
 Full text via PMC
 Download Citation
 Print
Print