

INTRODUCTION
Hepatocellular carcinoma (HCC) is an important public health problem. It has an identifiable latent period, which necessitates an effective routine surveillance program.1 Small HCCs detected by routine surveillance can often be cured with a good prognosis (>50% 5-year disease-free survival rate), whereas HCCs detected after the onset of symptoms have a poor prognosis (≤10% 5-year survival rate).2 Furthermore, a randomized controlled study and a few uncontrolled studies have shown that HCC surveillance improves survival rates.345 Hence, HCC surveillance is widely used and recommended for at-risk populations.267
The surveillance process involves determining at-risk populations (who should enter the surveillance program), the surveillance (diagnostic) test, and the surveillance interval (how frequently the tests should be done). Although complete consensus has yet to be reached on all three issues, the dilemmas faced by physicians caring for high-risk patients stem mainly from determining the optimal surveillance interval.8 The optimal surveillance interval is determined based on the tumor size and growth rate in order to detect HCCs at a stage when treatment is likely to produce a cure.910 While the ideal HCC surveillance interval is not known, intervals ranging from 3-12 months have been proposed.21112 Currently, the American Association for the Study of Liver Diseases (AASLD), the European Association for the Study of Liver (EASL), and the Asian Pacific Association for the Study of the Liver (APASL) recommend that surveillance be conducted at 6-month intervals.2 This recommendation is based on the assumption that the HCC growth rate is similar in every patient. However, tumor growth in general is strongly affected by the microenvironment,13 and HCC doubling time is likely affected by host factors as well as by tumor factors.
Several previous studies have investigated HCC growth rates in order to determine the optimal surveillance or follow-up interval and reported several host factors that may affect the HCC growth rate, including sex, the doubling time of alpha-fetoprotein (AFP), and the presence of hepatitis B surface antigen (HBsAg).141516171819202122 Those studies all had small sample sizes (fewer than 30 cases, even in the largest series), however, and reported a wide range of tumor volume doubling times (TVDTs) and inconsistent results for the significance of host factors. Therefore, we examined a relatively large number (n=175) of untreated HCCs in patients with cirrhotic liver disease to obtain more solid estimates of TVDT and identify host factors that can significantly affect TVDT.
PATIENTS AND METHODS
Study population
This study was approved by the local institutional review boards of the two participating hospitals, and patient informed consent was waived. By searching the electronic database, we identified 15,890 patients diagnosed with HCC and underlying chronic liver disease between January 1, 2001 and December 31, 2010 at two tertiary care hospitals in Seoul, Korea. Two radiologists (C.A. and Y.A.C.) reviewed the medical records and imaging studies of each patient and identified 181 patients who met the following inclusion criteria: (1) untreated HCC detected by 3-phase or 4-phase dynamic CT or MRI with a slice thickness of 5 mm or less, (2) at least one follow-up 3-phase or 4-phase dynamic CT or MRI scan, (3) an interval of at least 1 month between the initial and follow-up studies without any anti-cancer treatment, and (4) met the Milan criteria (solitary HCC with a diameter ≤5 cm or up to 3 HCCs with diameters ≤3 cm and no extrahepatic manifestation or vascular invasion). Six patients were excluded because they had either combined infection with hepatitis B virus (HBV) and hepatitis C virus (HCV) (n=4) or a solitary HCC with a nodule in nodule appearance (n=2). We defined HCC as either (1) a tumor >1 cm in diameter with arterial enhancement and venous/delayed washout, (2) a hypervascular tumor >1 cm in diameter that had grown either more than 5 mm or more than 50% in diameter since the previous exam, or (3) a tumor that was pathologically confirmed by biopsy within a month of initial detection. Our final study population comprised 175 patients with a combined total of 204 HCCs (122 men and 53 women; mean age, 60 years; age range, 21-85 years). Of these 204 HCCs, 164 (80.4%) were defined as HCC because they were > 1cm and showed the typical enhancement pattern (arterial enhancement and venous/delayed washout); 21 (10.3%), hypervascular tumors > 1cm that had grown; 9 (4.4%), both showed the typical enhancement pattern and had grown; and 10 (4.9%), confirmed by biopsy. These 175 patients did not receive treatment during the observation period because treatment was delayed (n=92), treatment was refused (n=36), the initial diagnosis was uncertain or incorrect (n=20), the operative risk was high due to severe liver impairment or comorbidity (n=19), or the patients were waiting for liver transplantation (n=8). One hundred thirty-six of the patients eventually received treatment, which included loco-regional treatments such as transarterial chemoembolization or radiofrequency ablation (n=101), hepatic resection (n=20), liver transplantation (n=10), and chemotherapy with or without local radiation therapy (n=5). The remaining 39 patients did not receive treatment before loss to follow-up or death, primarily because they refused treatment or their physicians expected high morbidity or mortality related to the treatment.
Data collection
Electronic medical records were reviewed to obtain the clinical and laboratory data recorded for each patient within the first month before or after the initial imaging study. The clinical data included patient demographics, etiology of chronic liver disease, alcohol consumption, medication history, the presence of hepatic encephalopathy, and the type of treatment received. Alcohol intake was considered significant if it exceeded 25 g/day on average.23 Laboratory data included levels of alanine aminotransferase (ALT), AFP, protein induced by vitamin K absence (PIVKA-II), albumin, bilirubin, international normalized ratio (INR), serologic markers of viral hepatitis, and HBV DNA. The reference values used for AFP and PIVKA-II levels were <9 ng/mL and <40 mAU/mL, respectively. Chronic HBV infection was determined based on serum positivity for HBsAg for at least 6 months. Chronic HCV infection was determined based on serum positivity for both anti-HCV and HCV-RNA for at least 6 months. HBV DNA load was measured by the Digene hybrid capture assay (Digene Diagnostics, Beltsville, MD, USA), with a lower limit of 0.5 pg/mL, or by the fully automated COBAS AmpliPrep-COBAS Taqman 96 system (Roche Molecular Systems, Branchburg, NJ, USA), with a linear detection range of 20-170,000,000 IU/mL. The radiologists recorded the number and location of HCCs and the presence of ascites on the basis of CT and/or MRI scans. Child-Pugh score was calculated for each patient.
Measurement of tumor volume doubling time
This study included 3-phase and 4-phase contrast-enhanced dynamic CT and MRI studies. When more than two imaging studies were available, we selected two for TVDT calculation according to the following principles. First, two studies with the same imaging modality were chosen whenever possible. Second, if a patient had multiple follow-up examinations with the same imaging modality, only the follow-up with the maximum interval was used. Third, MRI was preferred over CT. The interval between the initial and last imaging studies ranged from 30 to 777 days (mean, 140 days; median, 91 days).
Two radiologists (M.S.P. and D.C.) who were unaware of the patients' clinical information measured the size of each HCC using the best available image of the tumor, with preference given to delayed images followed by portal phase images and finally arterial phase images. The average tumor diameter was calculated from the two greatest perpendicular dimensions, as measured on transverse images. The tumor size was then used to determine the tumor volume (TV) calculated as TV = (4/3) × ϖ × (D/2)3, where D is the average diameter. On follow-up imaging, the same plane of section was used to measure the tumor size and volume. The growth rate of the HCC was expressed as TVDT calculated using Schwartz's equation24: TVDT = (T - T0) × log2 / (log V/V0), where (T - T0) indicates the time interval between two measurements, and V0 and V represent the tumor volumes at the two measurement times. Based on the calculated TVDT, the time needed for each 1 cm increase in tumor diameter was also calculated.
Statistical analysis
The TVDT was distributed lognormally. A Kolmogorov-Smirnov test revealed that the TVDT was normally distributed after log transformation (P >0.15). Therefore, we used the log-transformed TVDT for statistical analysis. To analyze the TVDT among the patients, the HCC with the shortest doubling time was chosen for each patient that had multiple HCCs. Univariate and multivariate linear regression analyses were performed to find factors affecting the TVDT. The variables investigated were age, sex, alcohol consumption, antiviral medication, Child-Pugh class, virus type, serum AFP/PIVKA-II levels, AFP doubling time, initial average HCC diameter, and tumor multiplicity. Possible interactions of these variables with the different hospitals were tested in terms of their effects on TVDT. An ANOVA followed by Bonferroni post-hoc tests was performed to compare the TVDT among the different virus types. The relationship between the TVDT and the initial tumor diameter was estimated by a linear regression equation. Variables with alpha <0.05 in the univariate analysis were included in the multivariate analysis. The correlation between each factor in the multivariate analysis and the TVDT was analyzed using the Spearman rank correlation test. Two-sided P-values <0.05 were considered statistically significant. All statistical analyses were performed using SAS 9.2 (SAS Institute Inc., Cary, NC, USA).
RESULTS
Baseline patient and tumor characteristics
The patient and tumor characteristics are summarized in Table 1. Among the 175 patients, 116 (66.3%) and 37 (21.1%) were infected with HBV and HCV, respectively, and the remaining 22 (12.6%) were not chronic carriers of hepatitis virus. Of the 161 patients who could be given Child-Pugh scores, 117 (74.1%) were categorized as Child A, 26 (16.5%) as Child B, and 15 (9.5%) as Child C. Among the patients for whom the data were available, 33.5% (54/161) and 56.7 % (55/97) had normal AFP and PIVKA-II, respectively. We obtained the AFP doubling time for 132 patients, and 47 (35.6%) of those had stable or decreasing AFP levels during the observation period. A total of 31 patients received antiviral medication during the observation period: 22 received lamivudine (Zeffix; GlaxoSmithKline, Greenford, UK); 4 received adefovir (Hepsera; Gilead Sciences Inc., Foster City, CA, USA); 3 received entecavir (Baraclude; Bristol-Myers Squibb, Princeton, NJ, USA); 1 received both lamivudine and adefovir; and 1 received a combination of pegylated interferon α-2a (Pegasys; Roche, Seoul, Korea) and ribavirin (Viramid; Ilsung Pharmaceuticals, Seoul, Korea). Twenty-two patients (12.6%) had more than 1 HCC: 15 had 2 HCCs, and 7 had 3 HCCs. The initial tumor diameter ranged from 1 to 4.6 cm, with a median of 1.5 cm; Of 175 HCCs, 94 (53.7%) were 1.5 cm or smaller, 34 (19.4%) were between 1.5 cm and 2 cm, and the remaining 47 (26.9%) were larger than 2 cm. One hundred twenty-six HCCs (72%) were found in the right hepatic lobe, while the other 49 (28%) were found in the left or caudate lobe.
Tumor volume doubling time and associated factors
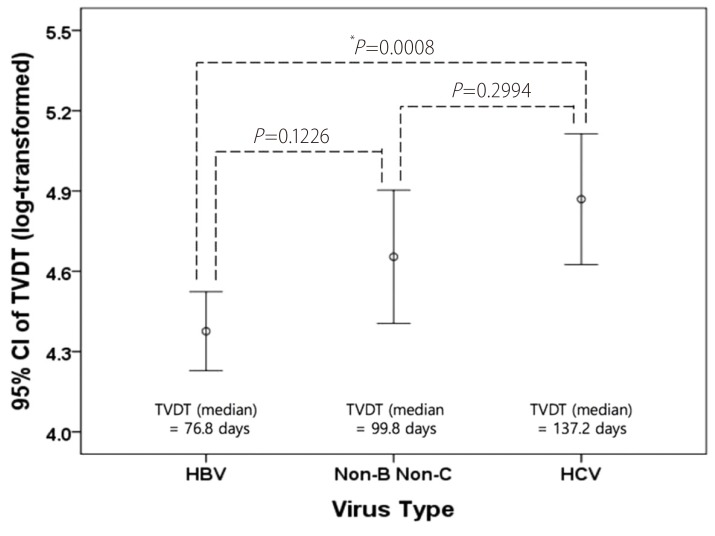
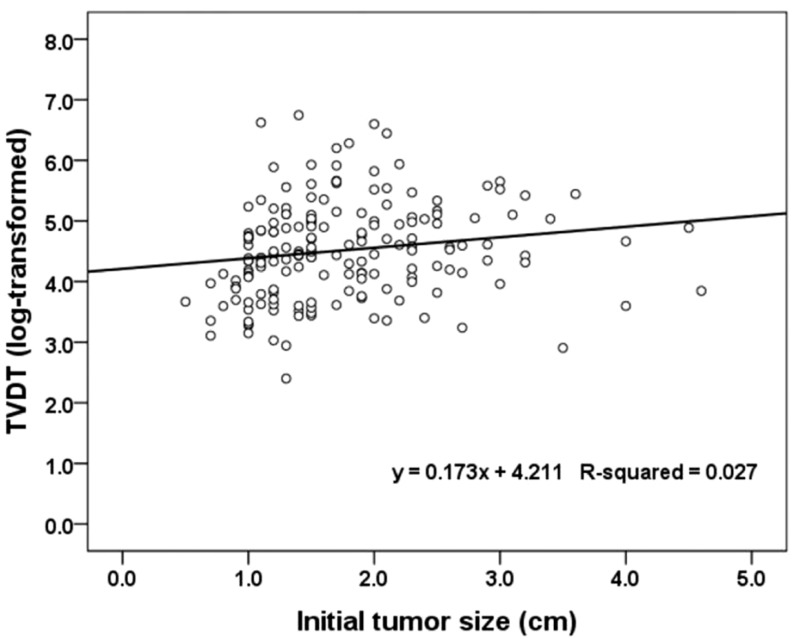
The TVDT ranged from 11 to 851.2 days (mean ± SD, 127.6 ± 128.7; median, 85.7 days), and its geometric mean ± SD, computed by reverse-transforming the mean of the log-transformed values, was 91.4 ± 2.2. The univariate linear regression showed that a shorter TVDT was significantly associated with serum AFP ≥ 400 ng/mL (vs. <9 ng/mL), smaller initial tumor diameter, and HBV infection. In the multivariate analysis, virus type (HBV vs. HCV, P =0.0234) and initial tumor diameter (P =0.0204) were independently associated with TVDT (Table 2). None of the variables investigated showed a significant interaction with hospital, so a subgroup analysis by hospital was not performed. The TVDT was shortest among the patients infected with HBV (median [range], 76.8 [11-752.2] days), longest among those infected with HCV (median [range], 137.2 [22.4-851.2] days), and intermediate among those with no hepatitis virus infection (median [range], 99.8 [33.6-288.4] days). There was a significant difference in TVDT between the patients infected with HBV and those infected with HCV (P<0.001) but not between those with no hepatitis virus infection and those with either HBV or HCV infection (no virus vs. HBV, P =0.1226; no virus vs. HCV, P =0.2994; Fig. 1). There was a positive linear relationship between the log-transformed TVDT and the initial diameter of the HCC (R2=0.027; Fig. 2). The linear regression equations for the entire study cohort and the virus-type subgroups were as follows: for all patients, TVDT = exp (0.173 × diameter + 4.211); for patients with HBV, TVDT = exp (0.124 × diameter + 4.161); for patients with HCV, TVDT = exp (0.221 × diameter + 4.475); and for patients with no hepatitis virus, TVDT = exp (0.316 × diameter + 4.094).
We used the regression equations to calculate the time it would take an HCC to increase its diameter by 1 cm based on its initial diameter (from 1 cm to 5 cm) and the virus type (HBV, HCV, or no virus) (Table 3). The estimated time needed for a HCC to grow from 1 cm to 2 cm was 212 days in patients with HBV infection and 328 days in those with HCV infection.
DISCUSSION
No prospective study has been performed to evaluate the HCC doubling time, and it is highly unlikely for ethical and practical reasons that one will ever be performed. The available evidence regarding the natural course of untreated HCC comes from retro-spective studies. To our knowledge, our study is the largest series (175 patients) yet reported in the literature.
Our study shows that the growth rate of HCC may be significantly associated with the hepatitis virus type and the initial tumor diameter. Unlike the tumor diameter, the hepatitis virus type is a host factor, which suggests that the HCC growth rate may vary depending on the individual patient. In our study population, HCC grew faster in patients infected with HBV than in those infected with HCV. Although one previous study reported a shorter mean TVDT among HBsAg-positive patients (48 days for HBsAg-positive vs. 140 days for HBsAg-negative),14 other studies did not find a significant relationship between HCC growth rate and the presence of HBsAg.151721 Each of the previous studies had relatively small numbers of patients overall and even smaller numbers in each subgroup (HBsAg positive and HBsAg negative). The resulting lack of statistical power in each study may have led to an increased probability of type II errors. In addition, most of the previous studies grouped patients with HCV infection and patients with no hepatitis virus infection together as "HBsAg-negative patients" and therefore could have not evaluated a potential difference in HCC growth rate between patients infected with HBV and those infected with HCV. Our results suggest that their estimates of HCC growth rates in patients with HCV infection may have been higher if the previous studies grouped the patients with HCV infection separately from those with no hepatitis virus infection.
It is reported that the etiology of HCC affects the characteristics of HCC.2526 Different HCC gene expression profiles are associated with different chronic liver disease etiologies,272829 which may lead to different tumor behaviors in patients infected with HBV and HCV. Furthermore, the morphologic and molecular characteristics of chronic viral liver disease vary significantly based on the virus type, and the resulting differences in the underlying liver parenchyma may impact on HCC growth through the interactions between cancer cells and the surrounding parenchyma.3031 Although our finding revealed that HBV-associated HCC may grow faster than HCV-associated HCC, the underlying mechanism for this disparity remains uncertain. To our knowledge, no direct comparison was made between HBV- and HCV-transformed cells, regarding cell growth rate in vitro.31 It is of interest to define the molecular mechanism underlying the faster growth of HBV-associated HCC, but this is beyond the scope of this study.
In our study population, the TVDT of HCC increased with increasing tumor size, which is consistent with the results of previous studies.1521 These results suggest that HCCs do not grow exponentially. Malignant tumors frequently undergo non-exponential growth, as the tumor growth pattern varies depending on the tumor characteristics and the environment.32 A sigmoidal growth model could explain an inverse relationship between the tumor growth rate and the tumor size, and several types of human cancer are reported to show such a growth pattern.333435 One possible explanation for tumors following a sigmoidal growth pattern is that only the tumor cells near the tumor boundary have access to enough nutrients for growth.32
The growth rate of HCC could be intimately intertwined with the recall strategy for non-invasive HCC diagnosis. The AASLD and EASL guidelines both state that any new nodule less than 1 cm in diameter cannot be diagnosed as HCC and should be followed up until the nodule grows to the point at which it can be diagnosed by imaging criteria. They recommend follow-up every 4 months for the first year and every 6 months thereafter.9 In our study, the average time required for an HCC to grow from 1 cm to 2 cm in diameter was 212 days for patients with HBV infection and 328.4 days for patients with HCV infection. We suggest different follow-up intervals for indeterminate small (<1 cm) nodules detected on surveillance tests in patients infected with HBV or HCV.
Our study has a few shortcomings. First, our study population is biased because we only included patients for whom TVDT was obtainable. Second, most of the HCCs included in the study were diagnosed radiologically without biopsy. We strictly followed the AASLD Practice Guidelines for radiologic diagnosis, which have been prospectively validated by a study that reported high positive predictive values for such diagnoses (MRI alone, 97.4%; combined MRI and contrast-enhanced ultrasonography, 100%).236 Furthermore, we believe that a radiologic diagnosis better reflects real clinical situations, where treatment decisions for high-risk patients are made when HCC is suspected based on imaging studies. Third, TVDT was calculated on the assumption that a tumor is spherical in shape, although a tumor can have a variety of shapes.
In conclusion, we found that untreated early-stage HCC grew faster in patients infected with HBV than in those infected with HCV. This viral factor may be used as a reference when determining surveillance or recall policy for HCC.
 PDF Links
 PubReader
 ePub Link
 Full text via DOI
 Full text via PMC
 Download Citation
 Print
Print