

INTRODUCTION
The Model for End-Stage Liver Disease (MELD) was primarily developed for the prediction of survival after a transjugular intrahepatic portosystemic shunt procedure.1 Since then, it has been highly accurate in predicting short-term mortality in various liver diseases. Since February 2002, the MELD system was implemented to prioritize patients waiting for liver transplantation in the United States and worldwide.2 However, unlike the Child-Pugh score, MELD does not reflect the assessment of ascites. Thus, MELD scores can be underestimated in patients with persistent ascites. According to some studies, persistent ascites and hyponatremia were powerful predictors of mortality regardless of low MELD scores.3,4 Hence, MELDNa, which combined MELD and serum sodium concentrations, was created to remedy these short-comings. Some studies have shown that MELDNa is a better predictor of short-term mortality than MELD.5,6 In addition, Refit MELD was introduced to prevent the overestimation of MELD in renal insufficiency by establishing a benchmark serum creatinine level. Refit MELDNa, which combined Refit MELD and serum sodium concentration, was also demonstrated recently.7 Previously, we reported that Refit MELDNa was not superior to Refit MELD in predicting mortality rates.8 In continuation with our previous study, we examined the 3-month predictive mortality value of the Child-Pugh score, Refit MELD, and Refit MELDNa in patients with cirrhosis and ascites.
MATERIALS AND METHODS
We conducted a medical record review of adults aged >18 years admitted with hepatic cirrhosis and ascites to the Konkuk University Hospital from January 2006 to December 2011. Patients were excluded for the following reasons: age <18 years, liver transplantation status, or other factors that may affect the mortality (such as other organ failure or severe infection). We also excluded patients diagnosed with primary or metastatic malignancies. Clinical cirrhosis was defined as radiologic features of cirrhosis with thrombocytopenia, esophageal varices, ascites, or encephalopathy. The ascites was assessed by physical examination or radiologic examination. Persistent ascites was defined that does not decrease amount of ascites or recurs within a short period of time after therapeutic paracentesis, despite sodium restriction and diuretic treatment or complications occurred after diuretics that preclude the use of an effective diuretic dosage.9 Alcoholic cirrhosis should be suspected in patients with a history of significant alcohol consumption. We defined significant alcohol consumption as a mean consumption of >100 g/day of alcohol (which corresponds to 6-7 drinks daily with each drink containing 13-15 g of alcohol). The diagnosis of chronic hepatitis B virus (HBV) infection was based on continuous positive results for the hepatitis B surface antigen for at least 6 months. Chronic hepatitis C virus (HCV) infection was defined as the presence of anti-HCV and HCV ribonucleic acid or positive results of the recombinant immunoblot assay. The Child-Pugh score, and the Refit MELD and Refit MELDNa scores were calculated based on physical and laboratory test results obtained on the first day of admission. The following formulas were used to calculate the scores7: Refit MELD="4.082"├Śloge (bilirubinc)+"8.485"├Śloge (creatininec)+"10.671" ├Śloge (INRc)+"7.432" where the modified terms bilirubinc=bilirubin bound by 1 mg/dL; creatininec=creatinine capped at <0.8 mg/dL and >3 mg/dL; and INRc=International Normalized Ratio (INR) limited by <1 and >3. Patients receiving renal replacement therapy were automatically assigned the upper limit of creatinine (3 mg/dL). Refit MELDNa="4.258"├Śloge (bilirubinc)+"6.792"├Śloge (creatininec)+"8.290"├Śloge (INRc)+"0.652"├Ś("140"-Nac)-"0.194"├Ś("140"-Nac)├Śbilicc+"6.327" where bilirubinc, creatininec, and INRc are as defined above, and Nac = Na limited by <125 mEq/L and >140 mEq/L; and bilicc = bilirubin limited by <1 mg/dL and >20 mg/dL. Patients on renal replacement therapy were assigned a creatinine level of 3 mg/dL.
Statistical analysis
The data are represented as the mean┬▒standard deviation (SD), and SPSS 17.0 (SPSS Inc., Chicago, IL, USA) was used for statistical analyses. Bivariate analyses were performed using the independent sample t-test for continuous variables. The chi-squared test was used for categorical variables to evaluate for significant differences in baseline characteristics. Variables with a p-value of <0.05 in the univariate analyses were included in the logistic regression model for the multivariate analysis. To avoid multicollinearity, multivariate analysis was performed except for prognostic values (Child-Pugh score, Refit MELD, and Refit MELDNa) and refit variables were analysed separately. The area under the receiver operator characteristic curve (AUROC) was used to measure the value of the Child-Pugh score, MELD, and MELDNa. The AUROCs were compared by the Delong's test, which used a MedCalc 12.7.2 (MedCalc Software, Mariakerke, Belgium).
RESULTS
Baseline characteristics
Of the 653 patients with cirrhosis and ascites, 123 were excluded (malignancy in 79, liver transplantation in 19, severe congestive heart failure in 3, liver abscess in 1, data missing in 11, and follow-up loss in 10). Thus, 530 patients (391 men, 139 women; mean age, 57.4┬▒11.4 years) were included in the present study. The baseline clinical and biochemical characteristics are listed in Table 1. The most common etiology of cirrhosis was alcohol alone (n=271, 51.1%), followed by HBV infection alone (n=150, 28.3%), and HCV alone (n=38, 7.2%). Furthermore, alcohol and HBV infection were indicated as causes of cirrhosis in 37 patients (7%). By all accounts, 312 patients (58.9%) had alcoholic cirrhosis. And of these, 165 patients (52.9%) continued drinking despite a diagnosis of cirrhosis. Persistent ascites was present in 115 patients (21.7%). Mean serum sodium, total bilirubin, creatinine, and albumin concentrations, prothrombin time (INR), and were 134.27┬▒5.86 mEq/L, 5.2┬▒7.37 mg/dL, 1.45┬▒1.49 mg/dL, 2.86┬▒0.58 mg/dL, and 1.64┬▒0.61, respectively. Mean Child-Pugh score and mean Refit MELD and Refit MELDNa scores were 9.19┬▒1.93, 18.01┬▒7.38, and 31.05┬▒31.11 respectively. No difference was noted between the 2 groups (alive and death) for sex, etiology of cirrhosis, ascites, and hepatic encephalopathy. However, statistical differences in age, serum sodium, creatinine, bilirubin, and albumin concentrations, and prothrombin time were found between groups, which are components of the Child-Pugh score and MELD (P<0.05). The mean Child-Pugh score and mean Refit MELD and Refit MELDNa scores were also higher in the death group (P<0.001) (Table 1). Serum sodium was classified into five categories depending on the concentration and Pearson chi-squared test was performed. No statistical relationship was noted between serum sodium concentration and a 3-month mortality rate if patients with a serum sodium concentration of <125 mEq/L were excluded (Table 2). In total, 87 patients (16%) died within 3 months. Varix bleeding was the most common cause of death (n=20, 23%) (Table 3).
The relationship between the 3-month mortality rate and variables
Univariate analysis using a logistic regression with the 3-month mortality as the dependent variable and serum sodium, bilirubin, creatinine, and albumin concentrations, prothrombin time, Child-Pugh score, Refit MELD score, and Refit MELDNa score as the independent variables revealed a highly significant and positive relationship (P<0.001). In addition, refit serum sodium, bilirubin, and creatinine concentrations, and refit prothrombin time, which are re-evaluations of the lower and upper limits, were also more strongly correlated with 3-month mortality. But, the mortality was not related with serum sodium and creatinine in HBV cirrhosis group (Table 4). In the multivariate analysis utilizing logistic regression, 3-month mortality was associated with serum sodium, bilirubin, prothrombin time, and albumin. In addition, refit serum bilirubin, creatinine, and prothrombin time were linked to short term mortality. However, when the subgroup analysis was performed by underlying etiology, 3-month mortality was linked with serum creatinine and refit serum creatinine in alcoholic cirrhosis group and refit prothrombin time in HBV cirrhosis group (Table 5).
The predictive value of the 3 prognostic models for 3 month mortality
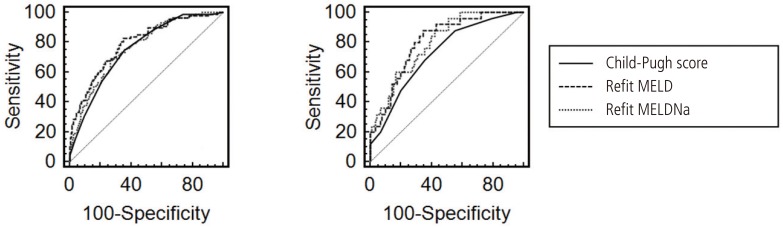
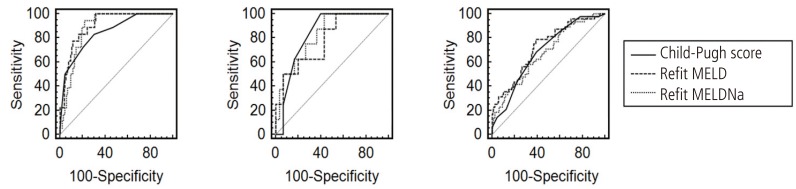
The estimated AUROCs for the Child-Pugh score, Refit MELD and Refit MELDNa scores were 0.754, 0.791, and 0.764 respectively. If analysis was only performed in patients with persistent ascites (n=115), the AUROCs were 0.725, 0.804, and 0.796, respectively (Fig. 1). Refit MELD showed the highest value among the 3 prognostic models, which also holds true for patients with persistent ascites. When the predictive value of the three models was analyzed according to the underlying etiology of liver cirrhosis, the estimated AUROCs for the Child-Pugh score, Refit MELD and Refit MELDNa scores were 0.849, 0.905, and 0.883 in the hepatitis B infection alone group, 0.833, 0.783, and 0.829 in the hepatitis C group, and 0.687, 0.723, and 0.673 in the alcohol alone group, respectively (Fig. 2). However, the difference was not statistically significant among the 3 models, except between the Child-Pugh score and Refit MELD in the persistent ascites group (P=0.039) and between the Refit MELD and Refit MELDNa in the alcohol alone group (P=0.012) (Table 6).
DISCUSSION
Refit MELD, which is a re-evaluation of the lower and upper limits for bilirubin and creatinine levels and prothrombin time based on current data, and Refit MELDNa, which is the addition of serum sodium concentrations to Refit MELD, were introduced in 2011 by Leise et al.7 They secured data and derived a new MELD model through adult primary liver transplantation candidates from the Organ Procurement and Transplantation Network in 2005-2006 (14,214 people). The excellence of this new model was demonstrated by its application to liver transplantation candidates in 2007-2008 (13,945 people). Their results showed the Refit MELDNa score to be a better predictor in comparison with the others.
Based on this, we previously published the predictive value of Refit MELD, Refit MELDNa, and a pre-existing scoring system for 3-month mortality in Korean patients with cirrhosis. However, we could not prove that Refit MELDNa is the most accurate method for mortality prediction.8 Our present research, which is performed on the basis of existing data, also demonstrated that Refit MELDNa is not better than Refit MELD as a predictor of 3-month mortality in patients with cirrhosis and ascites. Refit MELDNa even showed a lower value than Refit MELD (Figs. 1 and 2).
Several reasons should be considered. First is the difference in etiology between Korea and the United States (US) as we have mentioned in our previous report.8 According to the research in the US by Leise et al7, underlying liver disease was most commonly caused by HCV infection (43%), followed by alcohol consumption (17%), whereas HBV infection and alcohol constituted approximately 84% of the causes in the present study. Actually, chronic HBV infection is the most common cause of liver cirrhosis in Korea,10 unlike the present study, which showed an alcohol was the cause of the majority of patients with cirrhosis. It may be due to only hospitalized patients were included in the study. The present study showed that the overall predictive ability of the three prognostic models was low in alcoholic cirrhosis compared with viral cirrhosis (Fig. 2). Furthermore, the difference of variables which associated with short term mortality according to the underlying etiology suggest that there is likewise a difference of predictive ability of the prognostic models by the cause of chronic liver disease (Table 4 and 5). The environment factors (e.g. socioeconomic status, presence of family) among alcoholics should be considered. In particular, patients' compliance is low in alcoholic cirrhosis as this study show the 165 patients (52.9%) continued drinking despite a diagnosis of cirrhosis. Thus, such an uncontrolled factor would affect the predictive ability of the prognostic mortality models. Besides, the role of antiviral drugs in patients with viral hepatitis should be thought despite the lack of research on drug use in the present study. Some study revealed that histological regression of fibrosis after long term treatment of antiviral drugs.11,12 More research needs to be conducted on how underlying liver disease affects mortality. Second is the fact that most patients with ascites receive diuretics. The measured serum sodium concentration under these circumstances does not reflect the true status of liver function. Third is that change in serum sodium concentration does not reflect the severity of liver disease before occurrence of severe hyponatremia. The present study showed no statistical difference between serum sodium concentration and short-term mortality if serum sodium concentration was >125 mEq/L (P=0.099). In addition, severe hyponatremia (<125 mEq/L) did not occur often (n=39, 7.3%). In the multivariate analysis, the association between refit serum sodium concentration and short-term mortality could not be determined. Consequently, adding serum sodium concentration to Refit MELD was not conducive to improvement of discrimination capacity for predicting mortality in patients with ascites.
Statistically, we could not validate the superiority of the predictive value of Refit MELD and Refit MELDNa to the Child-Pugh score, although their AUROCs were higher numerically. However, the AUROC of Refit MELD was higher than that of the Child-Pugh score in patients with persistent ascites (Fig. 1). The predictive value of the Child-Pugh score was expected to reduce with the exclusion of the ascites variable, which was a component of the Child-Pugh score. This was also an indirect manifestation of the importance of persistent ascites in the prediction of mortality.
Impairment of sodium and water renal excretion is commonly found in cirrhosis and these eventually lead to ascites. These abnormal hemodynamic states are known to be closely associated with high mortality.13 Thus, a new prognostic model including serum sodium concentration, which indirectly reflects the hemodynamic status, was developed. Although serum sodium concentration is easy to measure, it affects dietary habits, other organ functions, and efficacy of medications. In this study, Refit MELDNa rather than Refit MELD showed a low predictive value in alcoholic cirrhosis (P=0.012) (Table 6). Probably irregular eating habits and continued drinking of them would have affected the electrolyte. Therefore, some recent studies attempted to increase the predictive power by including other variables in addition to the serum sodium concentration. In practice, Somsouk et al. included radiographic ascites, measured by computed tomography (CT), to the MELD and MELDNa and found significant improvement in the prediction of 1-year mortality.14 Nevertheless, significant cost and time are needed to perform a CT scan, and it not only increases healthcare costs but is also not conveniently available. In addition, a recent study had shown that modification of MELD and MELDNa to include serum albumin concentration, which is a component of the Child-Pugh score, improved the prediction of mortality.15 In summary, serum sodium and albumin concentrations are closely related to the ascites. Therefore, a combination of serum sodium and albumin concentration is preferably used instead of serum sodium concentration alone to determine the hemodynamic status. In particular, some diuretics such as furosemide are active when bound to albumin; therefore, low albumin concentration is considered a good indicator of persistent ascites.16
A number of limitations of this study should be noted. First, this study did not consider the medications taken by the patients that could have affected the serum sodium concentration. Second, some patients had transient liver damage because this study enrolled only hospitalized patients.
In conclusion, the results of our study suggest that Refit MELD and Refit MELDNa showed good predictability for 3-month mortality in patients with cirrhosis and ascites. These can also be considered the most advanced prognostic models compared to the existing scoring system. In theory, Refit MELDNa seems to be the best prognostic model, but our study could not validate its superiority to Refit MELD. We suspect that the result was affected by the low sensitivity of serum sodium concentration for several reasons. A larger prospective study is required, and a more constant and sensitive surrogate marker will be needed.
 PDF Links
 PubReader
 ePub Link
 Full text via DOI
 Full text via PMC
 Download Citation
 Print
Print