

INTRODUCTION
Portal hypertension in cirrhosis leads to the development of collateral veins and portosystemic shunts, which in turn increase cardiac output and splanchnic blood flow, resulting in high portal venous inflow and persistent portal hypertension. Serious complications can ensue, including gastroesophageal varices, ascites, renal insufficiency, and hepatic encephalopathy. Variceal bleeding is the most common and most serious complication. After the first bleeding episode, variceal bleeding recurs within 1 year in 70% of patients and the rate of mortality attributable to recurrent bleeding is now approaching 30%.1 Consequently, an assessment of portal hypertension is very important in caring for patients with cirrhosis and for predicting their prognosis.
The hepatic venous pressure gradient (HVPG), defined as the difference between the wedged and free hepatic vein pressures, is widely used to reflect portal vein pressure. HVPG measurement is a simple, safe procedure, and the HVPG is thus accepted as the best predictor of portal hypertension and survival in patients with cirrhosis. In addition, the HVPG is significantly correlated with the Child-Turcotte-Pugh (CTP) and Model for End-Stage Liver Disease (MELD) scores.2-4 Clinically significant portal hypertension is diagnosed when the clinical manifestations of the disease appear or when the portal pressure gradient exceeds a threshold value of 10 mmHg. An HVPG of Ōēź10 mmHg leads to varices and a value of Ōēź12 mmHg leads to variceal bleeding;5-7 therefore, the HVPG must be reduced to <12 mmHg to prevent variceal bleeding.
PATIENTS AND METHODS
Subjects
This study was based on a retrospective cohort in a multicenter setting. A total of 535 patients with cirrhosis underwent HVPG measurement at Wonju Christian Hospital Yonsei University Wonju College of Medicine, Hallym University Chuncheon Sacred Heart Hospital, and Soonchunhyang University Seoul Hospital. In all patients, the diagnosis of cirrhosis was made based on clinical symptoms, and imaging, histologic, and biochemical findings. Patients with concomitant hepatocellular carcinoma or portal-vein thrombosis were excluded. Regarding the causes of cirrhosis, confirmed hepatitis B surface antigen positivity for at least 6 months indicated cirrhosis induced by chronic hepatitis B virus (HBV), hepatitis C virus (HCV) RNA positivity indicated cirrhosis caused by chronic hepatitis C, and alcohol-induced cirrhosis was diagnosed in females/males who consumed on average more than 20/40 g of alcohol per day over 5-10 years.10
Method
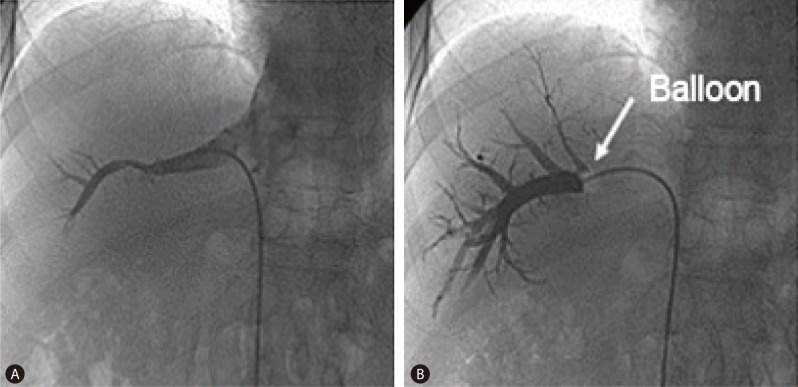
The HVPG, which was measured during clinical care, was estimated from three repeated measurements, and the mean value was calculated. A catheter was placed percutaneously into the right hepatic vein through the femoral or jugular veins, and the pressure in both the wedged position and the free position was recorded with a 7-F balloon-tipped catheter (Arrow Deutschland, Erding, Germany). The HVPG was determined by subtracting the free hepatic venous pressure from the wedged hepatic venous pressure (Fig. 1).11,12
The endoscopic findings of esophageal varices were classified according to the General Rules for Recording Endoscopic Findings of the Japanese Research Society for Portal Hypertension, in which the form of any varix is graded as F0 (no varicose appearance), F1 (small: straight, small-caliber varices), F2 (medium: moderately enlarged, beady varices), or F3 (large: markedly enlarged, nodular or tumor-shaped varices).13,14
HVPG was measured when liver cirrhosis was diagnosed for the first time or cirrhotic patient was hospitalized with variceal hemorrhage. The patients' medical records were analyzed retrospectively, and their MELD and CTP scores were calculated. The variables used for the two indicators were taken from the results of examination on or closest to the day of HVPG measurement. The CTP score was calculated using established criteria. The MELD score was calculated using a formula developed at the Mayo Clinic: 3.8├Ślog (bilirubin [mg/dL])+11.2├Ślog (international normalized ratio)+6.4├Ś(etiology score: 0 if cholestatic or alcoholic, 1 otherwise).15
Statistical analysis was performed using SPSS software (version 18.0 for Windows, SPSS, Chicago, IL, USA). Quantitative data are expressed as mean┬▒SD, range, or n (%) values, as appropriate. The presence of esophageal varices, presence of gastric varices, variceal hemorrhage, and varix size were compared using the two-sample t-test and one-way analysis of variance. The correlation between variables was analyzed using the Pearson correlation coefficient. The HVPG was compared according to varix size, CTP score, and MELD score using Student's t-test. The level of statistical significance was set at P<0.05 (two-tailed).
RESULTS
Baseline characteristics
This study enrolled 535 patients (440 males, 95 females; mean age 52 years) with cirrhosis. The cause of cirrhosis was alcohol in 382 (71.4%) patients, HBV in 105 (19.6%), alcohol with HBV in 20 (3.7%), HCV in 9 (1.7%), alcohol with HCV in 3 (0.6%), HBV with HCV in 1 (0.2%), and other causes, including autoimmune hepatitis, in 15 (2.8%) patients. The esophageal varices were graded as F0 in 142 (26.5%) patients, F1 in 134 (25.0%), F2 in 200 (37.4%), and F3 in 59 (11.0%) patients. Gastric varices were found in 134 (25.0%) patients. The non-hemorrhage group comprised 414 patients and the variceal hemorrhage group comprised 121 patients. The CTP classification was A (i.e., a CTP score of 5-6) in 188 (35.1%) patients, B (i.e., a CTP score of 7-9) in 207 (49.9%), and C (i.e., a CTP score of 10-15) in 80 (15.0%), and the MELD score was 1-10 in 251 (46.9%) patients, 11-20 in 252 (47.1%), and >20 in 32 (6.0%). The HVPG was 16.46┬▒7.05 mmHg (mean┬▒SD). The patient's characteristics are summarized in Table 1.
HVPG according to variceal status
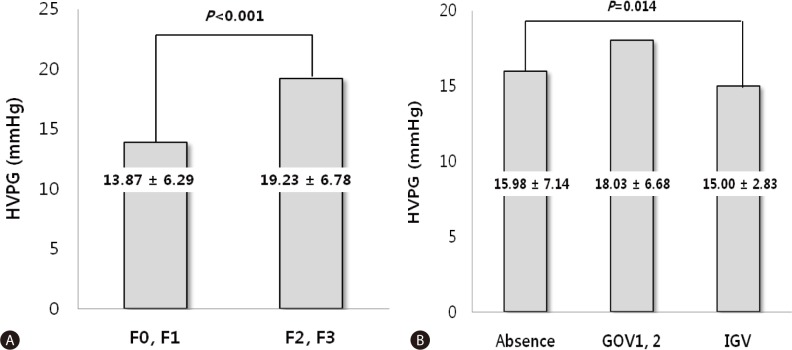
The HVPG was significantly higher in the group with esophageal varices (18.46┬▒6.58 mmHg) than in those without esophageal varices (10.94┬▒5.13 mmHg, P<0.001), and significantly higher in those with gastric varices (17.99┬▒6.58 mmHg) than in those without gastric varices (15.98┬▒7.15 mmHg, P=0.006). Of the 535 patients, 259 (48.4%) had F2 or F3 varices. The HVPG was significantly higher in the patients with gastric varices than in patients with small varices (19.23┬▒6.78 vs. 13.87┬▒6.29 mmHg, P<0.001; Fig. 2). The HVPG differed significantly according to gastric varix type as follows: absence, 15.98┬▒7.14 mmHg; GOV1 and GOV2, 18.03┬▒6.68 mmHg; and IGV, 15.00┬▒2.83 mmHg (P<0.00; Table 2, Fig. 2).
HVPG according to CTP and MELD scores
The HVPG was positively correlated with the CTP class (r=0.488, P<0.001) and the MELD score (r=0.478, P<0.001). The HVPG increased significantly with the CTP class: 12.03┬▒5.58 mmHg for class A, 18.40┬▒6.27 mmHg for class B, and 21.61┬▒6.95 mmHg for class C (P<0.001). Similarly, the HVPG differed significantly with the MELD score, being 12.71┬▒5.86, 19.53┬▒6.46, and 21.77┬▒4.78 mmHg for MELD scores of 1-10, 11-20, and 21-30, respectively (P<0.001; Table 3).
HVPG, CTP and MELD scores according to episode of first variceal hemorrhage
The HVPG was significantly higher in the group with first variceal hemorrhage (18.30┬▒5.75 mmHg) than in those without such hemorrhage (16.20┬▒7.19 mmHg, P=0.023). However, the CTP and MELD scores did not differ significantly between the two groups (Table 4).
DISCUSSION
The HVPG clearly reflects portal pressure in patients with cirrhosis. Its relationship with variceal hemorrhage has been well studied. In particular, it has been found that an HVPG level of >12 mmHg increases the risk of variceal bleeding, and that the HVPG is a key predictor of cirrhosis.16 However, the relationships between the HVPG and first variceal hemorrhage and severity of liver disease are not well established. Hence, the present study investigated the correlations between the HVPG and first variceal hemorrhage.
Many previous studies have found significant correlations between the HVPG and variceal hemorrhage. Indeed, the first variceal hemorrhage is associated with the increased risk of mortality in the patients with cirrhosis. We found that the HVPG was significantly higher in the group with first variceal hemorrhage than in patients without such hemorrhage, which suggests that this measure is a good predictor of variceal hemorrhage and confirms that portal-pressure-lowering drugs are needed to prevent the first onset of variceal hemorrhage.1,4,17
Gastric varices occur in approximately 25% of patients with portal hypertension. Although the reported rate of hemorrhage from gastric varices is lower than that from esophageal varices, the rupture of gastric varices (and especially fundal varices) tends to be more severe, requiring more transfusions, and is associated with a higher mortality rate. We found that the HVPG differed significantly between patients with and without gastric varices.
The severity of cirrhosis (CTP score, MELD score) is a risk factor of variceal hemorrhage. Nevertheless, our study showed that the CTP and MELD scores did not differ significantly between the group with first variceal hemorrhage and the group without such hemorrhage. Although several factors affect variceal hemorrhage, these suggest that HVPG is more reliable predictive factor of the first variceal hemorrhage rather than CTP and MELD scores.
Many studies have examined the correlation between the HVPG and MELD score, some with conflicting results. Lee et al10 measured the HVPG in 136 patients with decompensated cirrhosis and found that it was not a significant predictor of mortality. To determine the predictive nature of the HVPG, prospective studies with a broad group of patients (e.g., etiology, sex, and geographic region) are needed. In addition, Huo et al18 and Wang et al19 found that the MELD score was related to the HVPG and serum sodium level, and that high MELD and CTP scores, and high HVPG predicted a negative outcome.
We found significant correlations between the HVPG and both CTP and MELD scores, which indicates that HVPG monitoring is clinically beneficial. HVPG of 11 mmHg predicted first variceal bleeding with a sensitivity of 92.4% and a specificity of 27.7%. Low specificity of HVPG means that multiple factors such as thrombocytopenia, coagulation factors, and tense ascites can affect variceal hemorrhage. In conclusion, the HVPG was higher in cirrhotic patients with first variceal hemorrhage than in patients without such hemorrhage. Hence, the measurement of HVPG might be beneficial to prevent first variceal hemorrhage in patients with cirrhosis.
 PDF Links
 PubReader
 ePub Link
 Full text via DOI
 Full text via PMC
 Download Citation
 Print
Print